Abstract
In this study, droplet formations in microfluidic double T-junctions (MFDTD) are investigated based on a two-dimensional numerical model with volume of fluid method. Parametric ranges for generating alternating droplet formation (ADF) are identified. A physical background responsible for the ADF is suggested by analyzing the dynamical stability of flow system. Since the phase discrepancy between dispersed flows is mainly caused by non-symmetrical breaking of merging droplet, merging regime becomes the alternating regime at appropriate conditions. In addition, the effects of channel geometries on droplet formation are studied in terms of relative channel width. The predicted results show that the ADF region is shifted toward lower capillary numbers when channel width ratio is less than unity. The alternating droplet size increases with the increase of channel width ratio. When this ratio reaches unity, alternating droplets can be formed at very high water fraction (wf = 0.8). The droplet formation in MFDTD depends significantly on the viscosity ratio, and the droplet size in ADF decreases with the increase of the viscosity ratio. The understanding of underlying physics of the ADF phenomenon is useful for many applications, including nanoparticle synthesis with different concentrations, hydrogel bead generation, and cell transplantation in biomedical therapy.
I. INTRODUCTION
Due to broad application areas, including purification technologies, immobilization of bioactive materials, and spacer and calibration standards, the fabrication of microparticles is receiving increasingly significant interests.1–5 Mini-emulsion, emulsion, precipitation polymerization, and soap-free emulsion polymerization are the methods used to prepare monodisperse micro particles. However, most of those methods are either material-specific or time-consuming, and seldom provide a sufficiently narrow size distribution of the resulting particles, which is very important for quality control in the aforementioned applications.2 Microfluidic system is new and advanced approach that has recently become available for preparing microparticles with narrow size distribution from monodisperse droplets.3,6,7 The first report on the preparation of microparticles (water-in-oil droplets) in microchannels with the mechanism of liquid droplet formation was provided by Thorsen et al.8 In general, the microdroplets of the solution are continuously formed at a junction while two immiscible liquids, such as a hydrophilic solution and hydrophobic oil, are introduced into separate microchannels.3,9,10 Depending on the geometry, these microfluidic devices can be divided into four types, co-flowing devices, T-junctions, flow-focusing devices, and terrace devices, which can generate droplets with speed and reproducibility.4,6,11,12 Moreover, by optimizing flow conditions, the resulting droplets can be uniform with easy size control.
Microfluidic double T-junction device (MFDTD) is a relatively new device, which was developed from the original T-junction device for producing the monodisperse microdroplets. Since the droplet pairs with different compositions are possible to be formed, it can be used for indexing the concentrations of solutes in a droplet, protein crystallization13 or used as an initial process in droplet-merging techniques.14–16 The stable formation of droplets is expected in such a way that the miniature volume of each dispersed flow is controllable as accurately as possible. As a result, investigations on the dynamic behavior of multiphase flows in a microfluidic double T-junction device are required in order to determine flow conditions, channel geometries, and fluid properties for generating stable alternating droplets. A number of previous studies on MFDTD and associated mechanism of the droplet formation exist. Zheng et al.13 identified four different regimes of the fluid flow in a double T-junction that are characterized as a function of capillary number and water fraction. In particular, for low water fraction and low Reynolds number with capillary number ranging from 0.001 to 0.05 droplets are formed from each of the two inlets of the dispersive flow in an alternating fashion.
In addition, the formation of different droplets by using different viscosities of two dispersed flow streams or different flow rates was shown by Jin et al.14 Empirical formulas of flow rate range of dispersive flow fluids were also proposed in his paper with the aim of choosing the best inflow conditions for alternating droplet formation (ADF). Another form of the double T-junction that includes tapered expansion chamber and two triangular wings placed at T-junction was also used to generated ADF by reducing the flow instability and preventing reagents from back flowing.17 By controlling relative flow rates of the two dispersed flows and pinch function width, various droplet size ratios (1:5 to 5:1) can be obtained in alternating mode. On the other hand, for more efficient ADF, a typical double junction which includes two inclined side channels having 45° angle to the main channel can be used in combination with adopted input parameters such as capillary number and flow rate ratio of dispersed and continuous flow fluids.18 While these experimental investigations provide important information on ADF in MFDTD, a systematic numerical study can be very useful for identifying more comprehensive parameter ranges for ADF and gaining further insight into this interesting phenomenon.
Computational fluid dynamic (CFD) has been used in studying formation of microdroplets in microfluidic devices. The dynamics of droplet when it collides to the wall and breakup into two smaller droplets in a microfluidic symmetric T-junction was studied numerically using phase-field model. Three distinct regimes of droplet formation, namely, squeezing, dripping, and jetting, in microfluidic T-shaped junction were proposed by Menech et al.19,20 On the other hand, two phase level-set method used to investigate extensively wetting effects on the droplet size and droplet generation in a specific T-junction with different flow rate ratios, viscous ratios, and surface tensions were reported by Bashir et al.21 Three flow regimes depending on the capillary number and the flow rate ratio were also observed in a flow focusing device which was investigated by numerical approach.22 Moreover, droplet generation in flow-focusing devices of various designs was studied by several research groups with the Lattice Boltzmann method.23–25 Computational study of double the T-junction microfluidic device, however, is very scarce, and can contribute greatly to the understanding of the ADF phenomenon.
In this study, droplet formations in MFDTD are investigated based on a two-dimensional numerical model with volume of fluid (VOF) method. We consider the effects of the channel width ratio, capillary number, and water fraction on the flow characteristics. The time-dependent pressure difference between two dispersed flows is introduced to track the variation of physical quantities during the transition between the merging droplet formation (MDF) and the ADF mode. The ADF phenomenon is explained by analyzing the dynamical instability of the system. The geometrical effects of double T-junctions on droplet formation are also studied extensively by three typical values of channel width ratios.
II. NUMERICAL MODEL AND CODE VALIDATION
A. Mathematical model
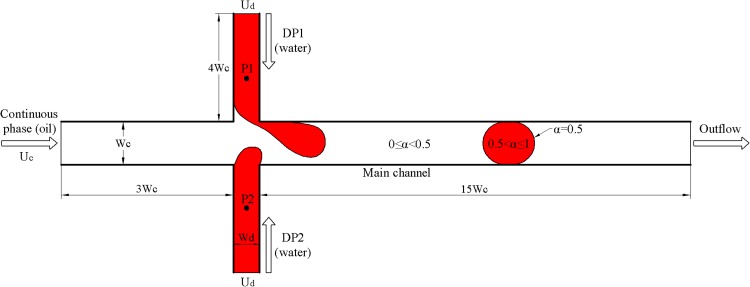
The droplet formation in a generic MFDTD is illustrated in Fig. 1, where geometric dimensions are specified in units of the main channel width Wc. Among the three inlets shown, that for the continuous flow feeds oil through the main channel with average velocity Uc while the other two for the dispersed flows deliver water with identical average velocity Ud through two side channels perpendicular to the main channel. By varying the feeding speed of the continuous and dispersed flows, water droplets are formed in this MFDTD with controllable concentrations.
FIG. 1.
Schematics of computational domain for MFDTD. Dispersed flow 1 (DP1) and 2 (DP2) are both water with identical properties and inlet velocity Ud. P1 and P2 are two pressure measurement points used to check pressure difference between the two dispersed flows.
Both fluids are assumed to have constant physical properties, and the conservation of mass and of momentum for the entire fluid domain are expressed by
| (1) |
| (2) |
where u, p, ρ, and μ are the velocity, pressure, bulk density, and bulk viscosity of fluid flows, respectively. Here, the subscript t represents time derivative, and I is the identity tensor. The last term on the right hand side of Eq. (2) is the volumetric surface-tension force acting only on the interfaces between different fluids, where σ, κ, and n denote surface tension coefficient, curvature, and unit normal vector of the interface, respectively. Here, δ is the Dirac delta function, which is zero everywhere except on the interface. This force can be calculated using Continuum Surface Force (CSF) model proposed by Brackbill et al.26
In this bulk description, two phases are differentiated by the volume fraction α of the dispersed flows satisfying
| (3) |
This volume fraction is 0 in the continuous flow and varies sharply to 1 across the interface (α = 0.5),27 as shown in Fig. 1.
The unit normal and curvature of the interface can be consequently expressed as a function of the volume fraction as
| (4) |
The bulk properties of fluids are calculated as the volume-weighted average of the two phases
| (5) |
where the subscript c and d indicate continuous (oil) and dispersed (water) flows, respectively.
The system is scaled using the main channel width Wc and average velocity of continuous flow Uc as the length and the velocity scale, respectively. The nondimensional variables are thus defined as
In dimensionless form, the governing system is denoted as after dropping the asterisk (*)
| (6) |
| (7) |
| (8) |
where Re and Ca are the Reynolds number and the Capillary number, respectively,
| (9) |
The conservation of momentum (7) can be rewritten for the dispersed flows as
| (10) |
where the density and the viscosity ratio are
| (11) |
In order to calculate the interfacial position in a computational cell, a geometric reconstruction scheme (the piecewise linear interpolation calculation, PLIC) is to be used. This is the most accurate scheme in ANSYS Fluent28 with low numerical diffusion compared with others. In general, a special boundary condition of wall adhesion is used to adjust the normal of the interface in cells adjacent to the wall
| (12) |
where nw and tw are the unit vectors normal and tangential to the wall, respectively. In present study, fully non-wetting boundary condition characterized by setting θw = 180° was used, so that dispersed flows do not wet the walls. The dispersive phase, DP1 and DP2, convected through the side feeding channel, does not form a contact line on the main channel wall, consistent with experimental observation.
At the three inlets velocity profiles of laminar fully developed Poiseuille flow corresponding to the average inlet velocity are imposed through the User-Defined Function (UDF). Atmospheric pressure condition is imposed at the outlet as a reference pressure in the system. Influence of the outlet boundary is eliminated by locating it sufficiently far away from the main inlet. For the parameter ranges studied, this is achieved by setting the channel length to fifteen times the main channel width. No-slip boundary condition is used on the channel wall. A geometrical parameter arises from the channel width ratio of the dispersed to the continuous flow, λ = Wd/Wc.
The Fractional step which can reduce computational cost28 is used for pressure-velocity coupling. PRESTO (Pressure Staggering Option) and QUICK (Quadratic Upstream Interpolation for Convective Kinetics) scheme are utilized for pressure interpolation and computing a higher-order value of convective variable at a face, respectively. The option of implicit body forces making the solution more robust is enabled to handle large body forces, such as the surface force acting on the interface between two different fluids.
B. Code validation
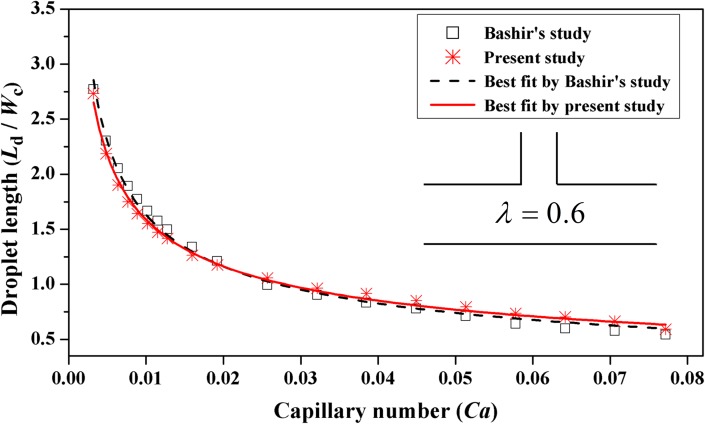
In order to verify the formulation and computational implementation used in the present study, our result on the microfluidic T-junction is compared with that of Bashir et al.,21 which is based on three-dimensional (3D) finite-element formulation with the level-set method for tracking the moving interface. As shown in Fig. 2, both results exhibit almost identical behavior of droplet length with respect to the increase of capillary number. Two fitting lines characterized by the power law, Ld/Wc = 0.2Ca−0.45, are agree well with each other. Although 3D effects are known to play an important role on the dynamics of droplet breakup and formation in microfluidic T-junctions play,29–32 2D-simulation results obtained in the present study also provide good qualitative prediction on the dynamics in the T-junction. It has been reported that 3D effects become less important as the channel aspect ratio (h/Wc) decreases below 0.05.21 Usefulness of 2D simulation for studying droplet formation in T-junction has also been discussed by Li et al.,33 Liu and Zhang,34 Leshansky and Pismen,35 Amaya-Bower and Lee,36 and Arias et al.37
FIG. 2.
Comparison between present result and the result obtained by Bashir's study21 dealing with droplet formation in microfluidic T-junction for dispersed flow velocity Ud = 0.012 m/s and viscosity ratio β = 0.8.
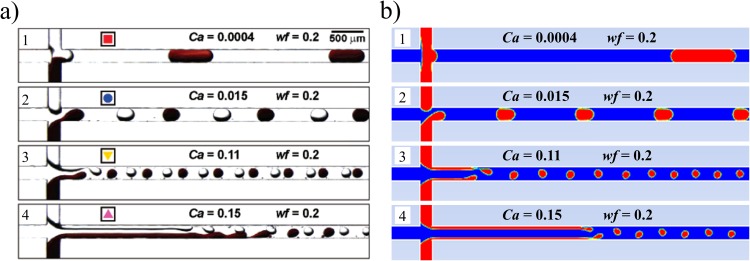
In order to further validate the present numerical model, our numerical results are compared with experimental observation by Zheng et al.13 Figure 3 illustrates the four regimes of droplet formations in a MFDTD. In this figure, the water fraction wf denotes the ratio between the combined flow rate of aqueous flows (water) and the total flow rate of the carrier fluid (oil) and the aqueous flows. In the dimensionless form of numerical model, it was used to specify the average velocity of dispersed flows Ud = wf/[2λ(1 − wf)] while Uc is unity for all cases. Figure 3(b) shows that four regimes of droplet formation in present numerical model including merging, alternating, small droplets, and laminar regimes are consistent with experimental observations under identical flow conditions. Although discrepancies can be observed in finer details of the droplet formation due to the limitation of the 2D formulation adopted in the present study and other factors associated with the experimental procedures of by Zheng et al.,13 essential features for the four different regimes are clearly reproduced with satisfactorily consistent geometrical scales. It can thus be concluded that the present numerical implementation can be used for studying the qualitative flow behaviors associated with the MDF and the ADF.
FIG. 3.
Four regimes observed for the formation of alternating droplets as a function of the capillary number Ca. (a) Experimental results observed by Zheng et al.13 in case of λ = 1.0 and the carrier fluid and the aqueous streams were both viscous (μ = 16 mPa·s). (b) Present computational results.
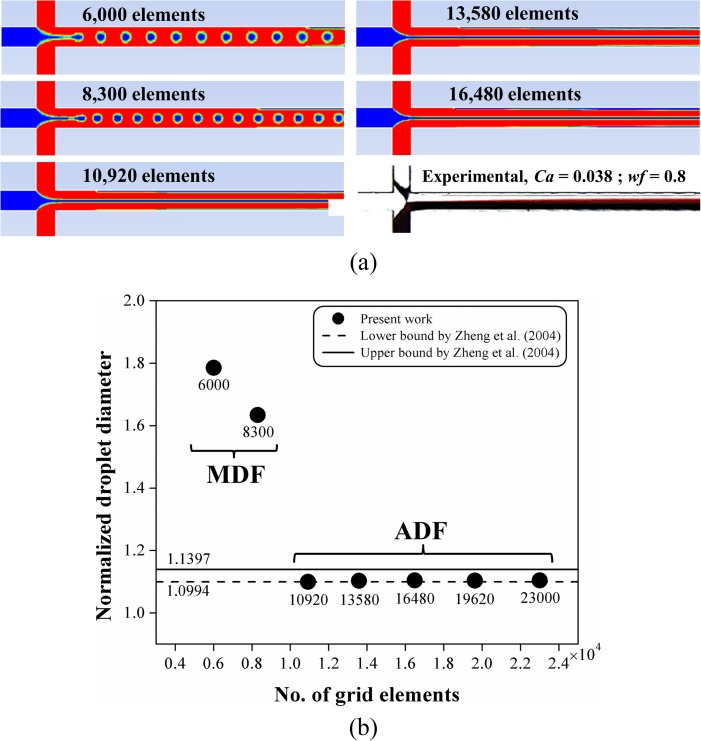
Mesh convergence study was carried out, as shown in Fig. 4. A non-uniform rectangular grid was used for 2D simulation. The mesh was refined by increasing the number of elements (m) on each edge of the model while keeping bias factor (BF) (is the ratio of the largest element to the smallest one). Thus the growth rate (GR) is defined by BF1/(m−1). The numbers of elements on a half vertical edge of main channel are 8, 10, 12, 14, 16, 18, and 20, and BF of 2 was used in present study. Eventually, the grid models of 6000, 8300, 10920, 13580, 16480, 19620, and 23000 elements were considered, as shown in Fig. 4. It is worth noting that the denser mesh has been concentrated in the following important regions: near the walls, at the centerline of the main channel, and at the junction.
FIG. 4.
Grid convergence study in comparison with the experimental study of Zheng et al.13 (a) Contours of volume fraction for various grid models for Ca = 0.038 and wf = 0.8 (red: water, blue: oil). (b) The dependence of droplet diameter on the mesh resolution, Ca = 0.015 and wf = 0.4. Normalized droplet diameter is defined by (4Ad/π)0.5/Wc, where Ad is the droplet area.
As shown in Fig. 4(a), for the same flow conditions and initial condition, the flow regime was changed significantly from oil droplet formation in flow focusing to jetting (dripping) of two water flows. With coarse meshes (6000 and 8300 elements), the interfacial thickness is not fine enough to resolve the correct physics, and spurious droplet formation results. With proper mesh refinement, the correct physics in agreement with experimental results is recovered. It is thus imperative to refine mesh far beyond the unphysical ranges. Gupta et al.38 provide very useful guidelines on mesh resolution and solver settings to accurately model microchannel flows using ANSYS Fluent.
Figure 4(b) also shows the change in flow regime from MDF to ADF while changing the mesh resolution. The droplets form in MDF regime at low Ca and wf due to the large thickness of the interface with the coarser meshes (6000 and 8300 elements). It can be seen from Fig. 4(b) that the grid independence is achieved when the droplets form in ADF regime, observed experimentally by Zheng et al.13 in the same flow condition. The droplet diameter obtained in present study lies within the range between the lower and upper bounds reported,13 showing quantitative agreements with experiments.
The data presented in this work are based on the grid model of 10920 elements for λ = 1.0. Similarly for other channel-width ratios, grid models of 9480, and 12360 elements are used for λ = 0.5, and λ = 1.5, respectively.
III. RESULTS AND DISCUSSIONS
A. Geometry effects and ADF phenomenon
The size of the microdroplets depends significantly on its channel geometry, as reported in other studies.22,39 In a MFDTD with λ = 1.0, however, it is difficult to generate polymerized droplets that are much bigger or smaller than the width of main channel. To improve this limitation, the effects of different geometries on droplet formation and droplet size are analyzed in this study. By changing the geometric parameter, the dynamics in droplet generation is changed accordingly due to the correlative increase or decrease of interaction between two aqueous streams.
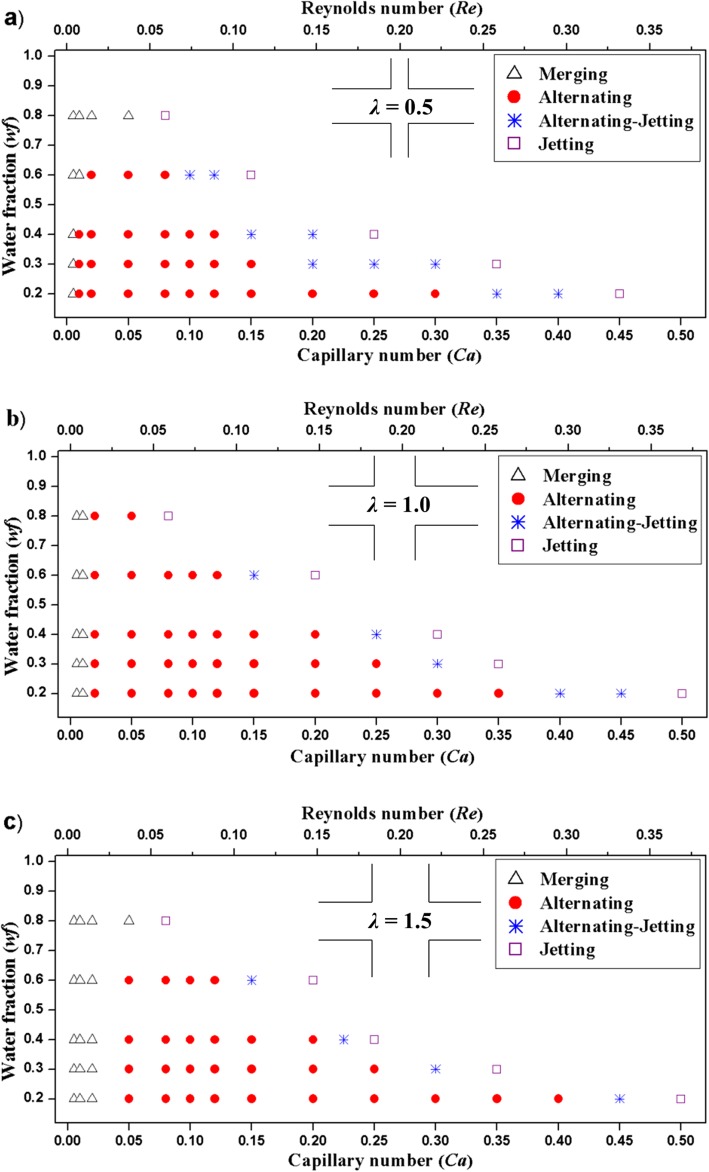
The four regimes, namely, merging (MDF), alternating (ADF), alternating-jetting, and jetting, experimentally observed by Zheng et al.13 are reproduced for the first time by numerical simulations in the present study, which in turn allow comprehensive parametric study not available in previous reports. Here, extensive numerical study is performed to investigate the effect of capillary number (10−3 ≤ Ca ≤ 0.5), Reynolds number (7.4 × 10⁻⁴ ≤ Re ≤ 0.37), and channel width ratio (λ = 0.5, λ = 1.0, and λ = 1.5). Figure 4 shows a comprehensive view of these four regimes on capillary number versus water fraction planes for three typical values of channel width ratio.
When the channel with of the dispersed flow is less than that of the continuous flow (λ < 1), the domain for ADF moves to the direction of lower capillary number (Fig. 5(a)). This is due to the fact that the relative distance between two dispersed flows increases to allow larger space for droplet generation in comparison with their channel width. As increases, the domain for ADF moves to the opposite direction of higher capillary number. When equals unity, the ADF can occur at very high water fractions (e.g., wf = 0.8 as seen in Fig. 5(b)). When λ exceeds unity, ADF expands its domain to the highest Ca, while it shrinks at low Ca. Two dispersed flows are easier to contact and merge with each other at very low Ca, and higher shear force is required to carry higher flow rates of dispersed flows when the width of lateral channels becomes larger than that of the main channel. It is noteworthy that the unstable formation of alternating droplets can be formed at a region close to alternating-jetting mode with high Ca. Based on these predicted results, the usable range of wf and Ca for ADF can be extended for more flexibility in operating a MFDTD.
FIG. 5.
Phase diagrams of droplet formation in a MFDTD as a function of capillary number and water fraction for (a) λ = 0.5, (b) λ = 1.0, and (c) λ = 1.5; β = 0.0173.
In Fig. 6, the size of droplets formed in a MFDTD is illustrated. It is seen that the droplet size increases consistently with the channel width ratio, as expected. In addition, it increases with the increase of water fraction while other parameters, including capillary number and Reynolds number, are fixed. This tendency is in agreement with experimental observations.18,22 It is thus to be noted that droplets that are bigger than the width of the main channel can be generated with precise control of their size.
FIG. 6.

Formation of droplets as a junction of channel width ratio at various water fractions in the regularly alternating regime with Ca = 0.12, Re = 0.0885, and β = 0.0173.
The evolution of droplet formation in microfluidic T-junction was monitored through pressure variation in time measuring at two points of both dispersed and continuous flows,40 at only one point near junction in continuous flow,20 “junction point” where two flows mix each other,41 or measuring on the bubble surface.42 In all cases, numerical approaches can play an important role in studying the interfacial dynamics of fluid flows in small channels, where the installation of measurement device becomes very difficult. In this study, besides monitoring the evolution of droplet formation, the physical behaviors of the ADF in MFDTD is analyzed by measuring the pressure difference between two water flows with respect to time. Two pressure points are specified close to junction enough to capture the dynamics of droplet formation, and they always lies in dispersed flows during operation because only signals from these two flows are expected to be comparable each other. The results observed in other locations also indicate the advantages in choosing these points.
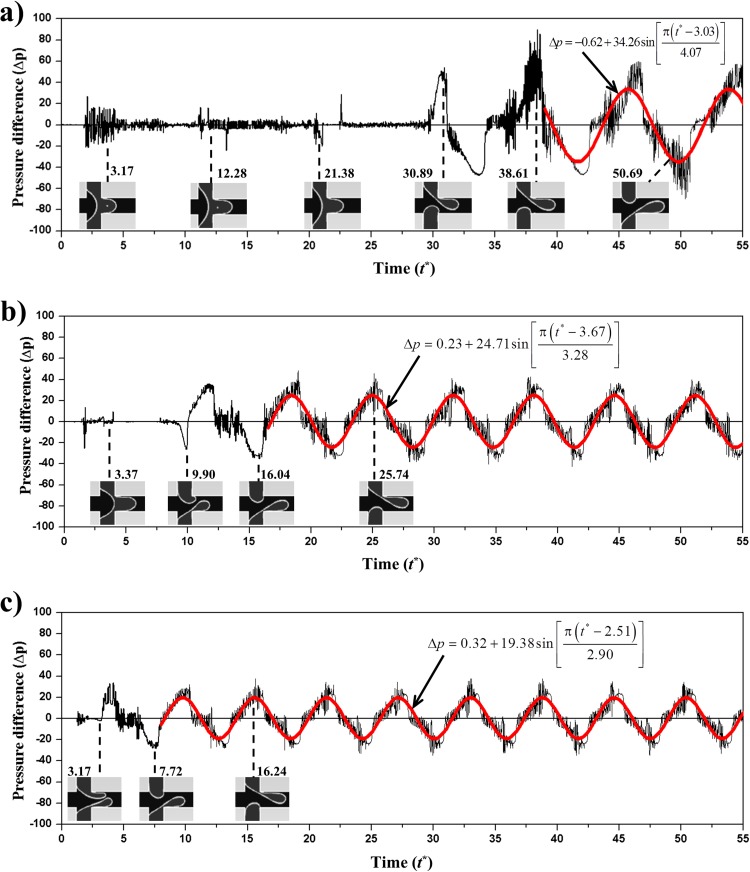
With low Ca the two water flows through the inlets tend to meet with each other to form a merged droplet translating down the channel due to the dominant capillary force. This merging process causes the fluctuation in amplitude of pressure difference compared with zero level in the range of initially operating time, as shown in Figs. 7(a) and 7(b). Consequently, the phase discrepancy between two water flows is derived mainly from the non-symmetrical breaking of merging droplet when this droplet is detached to move into main channel (Fig. 8(a)). Especially, it is easy to observe this phenomenon in case of Ca = 0.02, as illustrated from Fig. 8(b) to Fig. 8(d). The sequence of merging droplets is generated after breaking alternately over time. It means that the alternating phenomenon is implicit even in merging droplet formation. The phase discrepancy is easier to occur in experiment due to the inherent asymmetry derived from either fabrication process or operating conditions. This discrepancy increases over time until it is high enough that only one preceding-dispersed flow moves to the main channel ahead while the other follows with a lag.
FIG. 7.
Pressure difference between two dispersed flows in term of time for (a) Ca = 0.04, (b) Ca = 0.06, (c) Ca = 0.08 with wf = 0.2 and λ = 1.0 fixed for all cases. Δp is calculated by subtracting pressure at measurement point P1 from P2 shown in Fig. 1. Highlighted smooth curves are fitted by wave function from forth droplet after alternating occurrence. The amplitude (A) and half period (T/2) of wave functions corresponding to Ca = 0.04, 0.06, and 0.08 are A = 34.26, 24.71, and 19.38 and T/2 = 4.07, 3.28, and 2.9, respectively.
FIG. 8.

Non-symmetrical breaking of merging droplet caused the phase discrepancy of two dispersed flow. (a) Merging droplet prior to alternating droplet formation with Ca = 0.04. (b), (c), and (d) Sequence of merging droplets breaks alternately, Ca = 0.02 and λ = 1.0.
Here, two scenarios are possible. The preceding-dispersed flow can merge into the following one when distance between them is small enough. The merging will depend on the surfactant effects usually present in actual operation43 and the viscous ratio affecting on the interfacial mobility.44 This explains why the alternating process is easier to observe in experiments even though precisely symmetric conditions are imposed for the two dispersed flows. This merging process continues, with the phase discrepancy growing as well over time. It can be stated that this discrepancy always exists in such system when two dispersed flow flows competes with each other to move into one channel. The other scenario is that the preceding-dispersed flow is detached completely before the following one can gain on it. The presence of following-dispersed flow in the cross-junction then causes the increase in compression force on the remaining, and the preceding-dispersed flow can be snapped-off more easily. Ultimately, the ADF is generated continuously and can persist.
The ADF phenomenon in MFDTD can also be explained by analyzing the dynamical stability of fluid flows. Also shown in Fig. 6, the fluctuating amplitude of the pressure difference tends to return symmetric point (Δp = 0) over time for the MDF. This is due to the spontaneous correction of a fluid flow system without any external perturbation. However, it cannot reach a symmetric point if two water flows merge each other because of non-symmetric breaking of merging droplet, as shown above. A new more preferred state thus needs to be established. It is noteworthy that the system is stable when MDF becomes ADF because the variation of pressure difference in ADF obeys sinusoidal law over time as illustrated by highlighted smooth curves in Fig. 6. Furthermore, this law satisfies all conditions of marginal stability. It is not asymptotically stable because all solution cannot converge to an equilibrium point, and it is obviously not unstable because the amplitude of pressure difference tends to stay constant in time. Thus, there always exist a positive number (ε), so that the condition of Lyapunov stability for equilibrium points is satisfied.45 If the equilibrium point is zero, then ||Δp(t*)|| < ε with all local time from an initial time of ADF. Note that the blocking and breakup process occur for the dispersed flow with lower pressure. For example, DP1 droplet was formed in the upper area of abscissa (pP1* < pP2*) and vice versa.
Sinusoidal law also represented the continuity and steady during droplet formation as expected. In addition, from the variation of pressure difference in time with different capillary numbers, it is also known that the fluctuating amplitude decreases (from 34.26 down to 19.38) as the capillary number increases. The frequency of alternating generation increases correspondingly. The frequency of wave function (f) can be expressed in terms of wave period by 1/T. This law matches with the droplet formation process in general droplet-based microfluidic devices, where the droplet size decreases as capillary number increases, while the frequency of droplet generation increases proportionally.20–22,24 It also means that the alternating state depends significantly upon the capillary number. In all cases, the equilibrium point of wave functions corresponding to Δp = −0.62, 0.23, and 0.32, which has a small deviation from zero. It is expected to attenuate to zero as the ultimate state is reached.
B. Effects of viscosity ratio
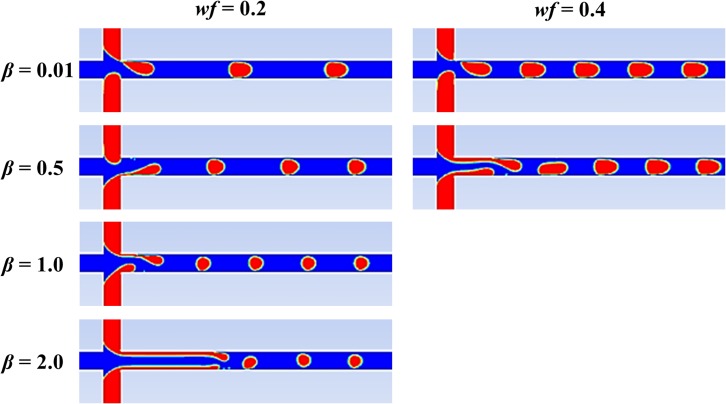
To consider the effects of the viscosity ratio between dispersed and continuous fluid flows on the droplet formation, a wide range of viscosity ratios (from 0.01 to 2.0) is investigated while the other parameters are kept constant. The results indicate that the droplet formation in a MFDTD depends significantly on the viscosity ratio. Figure 9 shows the change of the flow regime (from ADF to jetting formation) as a function of the viscosity ratio. The droplet size in ADF decreases with the increase of viscosity ratio. Droplets are formed in ADF at low viscosity ratio due to the dominance of the capillary force. This can be explained through the relationship between the surface tension and the viscosity for liquids. The effect of surface tension increases with the decrease of viscosity ratio, as discussed in previous studies.46–48 The capillary force thus becomes dominant when the viscosity ratio between the two liquids decreases.
FIG. 9.
Droplet formation as a function of viscosity ratio for Ca = 0.05, wf = 0.2, and λ = 1.0.
When the viscosity ratio increases, the capillary force tends to decrease, and the viscous force becomes more dominant. It becomes easier to force dispersed flows into the main channel, although input parameters such as the flow rate and pressure at the three inlets are kept constant. The transition between ADF and the jet formation is observed at β = 1.0, as shown in Fig. 9. In the jet formation existing at high viscosity ratio (β = 1.5), small droplets are generated far downstream from the cross junction of the MFCD. This phenomenon is also observed for other water fractions, but the range of viscosity ratio valid for the transition between ADF and the jetting formation is narrowed, as illustrated in Fig. 9 with wf = 0.4.
IV. CONCLUSION
In this study, droplet formations in microfluidic double T-junctions are investigated based on two-dimensional numerical model with volume of fluid method. A comprehensive parametric study has been performed to understand the dynamics of droplet formation in a MFDTD. The conditions for four different droplet-formation behaviors, observed in previous experimental investigations, are identified based on numerical study. A physical background responsible for the ADF is suggested by analyzing the dynamical stability of flow system. Since the phase discrepancy between dispersed flows is mainly affected by non-symmetrical breaking of merging droplet and Lyapunov stability, merging regime becomes the alternating regime at appropriate conditions. The effects of channel geometry on the behaviors of droplet formation are studied extensively in terms of the channel width ratio. The predicted results show that the ADF shifts to the direction of lower capillary number when channel width ratio is less than unity. The ADF can occur at very high water fraction (wf = 0.8) when the width of side channel becomes identical to that of the main channel, and the alternating droplet size increases as it increases further. The droplet formation in MFDTD depends significantly on the viscosity ratio, and the ADF tends to transform to the jet formation as the viscosity ratio increases beyond unity. Furthermore, the droplet size in ADF decreases with the increase of the viscosity ratio. This study provides insight into the ADF and the dynamic behaviors of droplet formation under different operating conditions in a MFDTD, and is applicable to diverse microfluidic devices associated with droplet formations.
ACKNOWLEDGMENTS
This work was funded by 2014 Yeungnam University Research Grant.
References
- 1.Dendukuri D., Pregibon D. C., Collins J., Hatton T. A., and Doyle P. S., Nat. Mater. 5, 365 (2006). 10.1038/nmat1617 [DOI] [PubMed] [Google Scholar]
- 2.Nie Z. H., Li W., Seo M., Xu S. Q., and Kumacheva E., J. Am. Chem. Soc. 128, 9408 (2006). 10.1021/ja060882n [DOI] [PubMed] [Google Scholar]
- 3.Nisisako T., Torii T., and Higuchi T., Chem. Eng. J. 101, 23 (2004). 10.1016/j.cej.2003.11.019 [DOI] [Google Scholar]
- 4.Serra C. A. and Chang Z. Q., Chem. Eng. Technol. 31, 1099 (2008). 10.1002/ceat.200800219 [DOI] [Google Scholar]
- 5.Sugiura S., Nakajima M., Tong J. H., Nabetani H., and Seki M., J. Colloid Interface Sci. 227, 95 (2000). 10.1006/jcis.2000.6843 [DOI] [PubMed] [Google Scholar]
- 6.Whitesides G. M., Nature 442, 368 (2006). 10.1038/nature05058 [DOI] [PubMed] [Google Scholar]
- 7.Engl W., Backov R., and Panizza P., Curr. Opin. Colloid Interface Sci. 13, 206 (2008). 10.1016/j.cocis.2007.09.003 [DOI] [Google Scholar]
- 8.Thorsen T., Roberts R. W., Arnold F. H., and Quake S. R., Phys. Rev. Lett. 86, 4163 (2001). 10.1103/PhysRevLett.86.4163 [DOI] [PubMed] [Google Scholar]
- 9.Hao G., Duits M. H. G., and Mugele F., Int. J. Mol. Sci. 12, 2572 (2011). 10.3390/ijms12042572 [DOI] [PMC free article] [PubMed] [Google Scholar]
- 10.Teh S. Y., Lin R., Hung L. H., and Lee A. P., Lab Chip 8, 198 (2008). 10.1039/b715524g [DOI] [PubMed] [Google Scholar]
- 11.Dang T. D., Kim Y. H., Kim H. G., and Kim G. M., J. Ind. Eng. Chem. 18, 1308 (2012). 10.1016/j.jiec.2012.01.028 [DOI] [Google Scholar]
- 12.Dang T. D. and Joo S. W., Colloids Surf., B 102, 766 (2013). 10.1016/j.colsurfb.2012.09.016 [DOI] [PubMed] [Google Scholar]
- 13.Zheng B., Tice J. D., and Ismagilov R. F., Anal. Chem. 76, 4977 (2004). 10.1021/ac0495743 [DOI] [PMC free article] [PubMed] [Google Scholar]
- 14.Jin B. J., Kim Y. W., Lee Y., and Yoo J. Y., J. Micromech. Microeng. 20, 035003 (2010). 10.1088/0960-1317/20/3/035003 [DOI] [Google Scholar]
- 15.Fidalgo L. M., Abell C., and Huck W. T. S., Lab Chip 7, 984 (2007). 10.1039/b708091c [DOI] [PubMed] [Google Scholar]
- 16.Tang S. K. Y., Li Z. Y., Abate A. R., Agresti J. J., Weitz D. A., Psaltis D., and Whitesides G. M., Lab Chip 9, 2767 (2009). 10.1039/b914066b [DOI] [PubMed] [Google Scholar]
- 17.Hung L. H., Choi K. M., Tseng W. Y., Tan Y. C., Shea K. J., and Lee A. P., Lab Chip 6, 174 (2006). 10.1039/b513908b [DOI] [PubMed] [Google Scholar]
- 18.Jin B. J. and Yoo J. Y., Exp. Fluids 52, 235 (2012). 10.1007/s00348-011-1221-0 [DOI] [Google Scholar]
- 19.De Menech M., Phys. Rev. E 73, 031505 (2006). 10.1103/PhysRevE.73.031505 [DOI] [PubMed] [Google Scholar]
- 20.De Menech M., Garstecki P., Jousse F., and Stone H. A., J. Fluid Mech. 595, 141 (2008). 10.1017/S002211200700910X [DOI] [Google Scholar]
- 21.Bashir S., Rees J. M., and Zimmerman W. B., Chem. Eng. Sci. 66, 4733 (2011). 10.1016/j.ces.2011.06.034 [DOI] [Google Scholar]
- 22.Liu H. H. and Zhang Y. H., Phys. Fluids 23, 082101 (2011). 10.1063/1.3615643 [DOI] [Google Scholar]
- 23.Dupin M. M., Halliday I., and Care C. M., Phys. Rev. E 73, 055701(R) (2006). 10.1103/PhysRevE.73.055701 [DOI] [PubMed] [Google Scholar]
- 24.Wu L., Tsutahara M., Kim L. S., and Ha M. Y., Int. J. Numer. Methods Fluids 57, 793 (2008). 10.1002/fld.1659 [DOI] [Google Scholar]
- 25.Kim L. S., Jeong H. K., Ha M. Y., and Kim K. C., J. Mech. Sci. Technol. 22, 770 (2008). 10.1007/s12206-007-1201-8 [DOI] [Google Scholar]
- 26.Brackbill J. U., Kothe D. B., and Zemach C., J. Comput. Phys. 100, 335 (1992). 10.1016/0021-9991(92)90240-Y [DOI] [Google Scholar]
- 27.Hirt C. W. and Nichols B. D., J. Comput. Phys. 39, 201 (1981). 10.1016/0021-9991(81)90145-5 [DOI] [Google Scholar]
- 28.ANSYS FLUENT Therory Guide, Release 14.0, ANSYS, Inc., 2011.
- 29.van Steijn V., Kleijn C. R., and Kreutzer M. T., Phys. Rev. Lett. 103, 214501 (2009). 10.1103/PhysRevLett.103.214501 [DOI] [PubMed] [Google Scholar]
- 30.van Steijn V., Kleijn C. R., and Kreutzer M. T., Lab Chip 10, 2513 (2010). 10.1039/c002625e [DOI] [PubMed] [Google Scholar]
- 31.Hoang D. A., Portela L. M., Kleijn C. R., Kreutzer M. T., and van Steijn V., J. Fluid Mech. 717, R4 (2013). 10.1017/jfm.2013.18 [DOI] [Google Scholar]
- 32.Hoang D. A., van Steijn V., Portela L. M., Kreutzer M. T., and Kleijn C. R., Comput. Fluids 86, 28 (2013). 10.1016/j.compfluid.2013.06.024 [DOI] [Google Scholar]
- 33.Li Z. L., Kang J. F., Park J. H., and Suh Y. K., J. Mech. Sci. Technol. 21, 162 (2007). 10.1007/BF03161722 [DOI] [Google Scholar]
- 34.Liu H. H. and Zhang Y. H., J. Appl. Phys. 106, 034906 (2009). 10.1063/1.3187831 [DOI] [Google Scholar]
- 35.Leshansky A. M. and Pismen L. M., Phys. Fluids 21, 023303 (2009). 10.1063/1.3078515 [DOI] [Google Scholar]
- 36.Amaya-Bower L. and Lee T., Philos. Trans. R. Soc. A 369, 2405 (2011). 10.1098/rsta.2011.0025 [DOI] [PubMed] [Google Scholar]
- 37.Arias S., Legendre D., and Gonzalez-Cinca R., Comput. Fluids 56, 49 (2012). 10.1016/j.compfluid.2011.11.013 [DOI] [Google Scholar]
- 38.Gupta R., Fletcher D. F., and Haynes B. S., Chem. Eng. Sci. 64, 2941 (2009). 10.1016/j.ces.2009.03.018 [DOI] [Google Scholar]
- 39.Kashid M. N., Renken A., and Kiwi-Minsker L., Chem. Eng. Res. Des. 88, 362 (2010). 10.1016/j.cherd.2009.11.017 [DOI] [Google Scholar]
- 40.Garstecki P., Fuerstman M. J., Stone H. A., and Whitesides G. M., Lab Chip 6, 437 (2006). 10.1039/b510841a [DOI] [PubMed] [Google Scholar]
- 41.Yan Y., Guo D., and Wen S. Z., Chem. Eng. Sci. 84, 591 (2012). 10.1016/j.ces.2012.08.055 [DOI] [Google Scholar]
- 42.Jensen M. J., Stone H. A., and Bruus H., Phys. Fluids 18, 077103 (2006). 10.1063/1.2214461 [DOI] [Google Scholar]
- 43.Hudson S. D., Jamieson A. M., and Burkhart B. E., J. Colloid Interface Sci. 265, 409 (2003). 10.1016/S0021-9797(03)00396-5 [DOI] [PubMed] [Google Scholar]
- 44.Yang H., Park C. C., Hu Y. T., and Leal L. G., Phys. Fluids 13, 1087 (2001). 10.1063/1.1358873 [DOI] [Google Scholar]
- 45.Lyapunov A. M. and Fuller A. T., The General Problem of the Stability of Motion ( Tayor & Francis, London; Washington, DC, 1992). [Google Scholar]
- 46.Pelofsky A. H., J. Chem. Eng. Data 11, 394 (1966). 10.1021/je60030a031 [DOI] [Google Scholar]
- 47.Schonhorn H., J. Chem. Eng. Data 12, 524 (1967). 10.1021/je60035a016 [DOI] [Google Scholar]
- 48.Queimada A. J., Marrucho I. M., Stenby E. H., and Coutinho J. A. P., Fluid Phase Equilib. 222–223, 161 (2004). 10.1016/j.fluid.2004.06.016 [DOI] [Google Scholar]


