Abstract
Purpose:
Here, the authors describe a dosimetry measurement technique for microbeam radiation therapy using a nanoparticle-terminated fiber-optic dosimeter (nano-FOD).
Methods:
The nano-FOD was placed in the center of a 2 cm diameter mouse phantom to measure the deep tissue dose and lateral beam profile of a planar x-ray microbeam.
Results:
The continuous dose rate at the x-ray microbeam peak measured with the nano-FOD was 1.91 ± 0.06 cGy s−1, a value 2.7% higher than that determined via radiochromic film measurements (1.86 ± 0.15 cGy s−1). The nano-FOD-determined lateral beam full-width half max value of 420 μm exceeded that measured using radiochromic film (320 μm). Due to the 8° angle of the collimated microbeam and resulting volumetric effects within the scintillator, the profile measurements reported here are estimated to achieve a resolution of ∼0.1 mm; however, for a beam angle of 0°, the theoretical resolution would approach the thickness of the scintillator (∼0.01 mm).
Conclusions:
This work provides proof-of-concept data and demonstrates that the novel nano-FOD device can be used to perform real-time dosimetry in microbeam radiation therapy to measure the continuous dose rate at the x-ray microbeam peak as well as the lateral beam shape.
Keywords: fiber optic detector, nano-crystalline scintillator, microbeam, dosimetry
1. INTRODUCTION
1.A. Microbeam radiation therapy
Microbeam radiation therapy (MRT) is an experimental and preclinical radiation therapy that distinguishes itself from the conventional broad beam radiation in dose distribution, treatment fractionation, and total dose. MRT is a spatially fractionated radiation delivered by an array of parallel, planar, x-ray microbeams for an ultrahigh dose single treatment.1 Decades of animal studies have shown that MRT preferentially damages tumors while under the same radiation insult, normal tissue is spared.2,3 Over the years, different sizes of microbeams have been developed and used in animal studies including beam widths as small as 20 μm (Refs. 4–7) and ranging up to 700 μm, often referred to as minibeam radiation therapy.8,9 Despite the promising animal study results, the working mechanisms of MRT are still poorly understood, hindering the potential clinical translation of this promising cancer radiation therapy. To promote MRT translational research, our group at UNC has developed a novel compact x-ray MRT irradiation system using nanotechnology.10–13 The purpose of the compact x-ray tube based system is not to match the exquisite MRT dosimetry from the massive synchrotron facility based MRT systems. Our hypothesis is that the compact MRT system, especially future generation systems, can produce similar radiobiology response as the synchrotron-based MRT system.
There is tremendous challenge in dosimetric measurement of all the forms of MRT. The available clinical radiation detectors are typically designed for spatial resolution of several millimeters and thus not suited for MRT measurement as the detectors are significantly larger than the microbeams themselves. As a result, a combination of radiation detectors and/or methods (such as film and Monte Carlo) are typically employed to provide full characterization of a microbeam.14 Characterization of microbeams would be greatly simplified if there were a single detector capable of providing a cost-effective and real-time method of measuring the dose rate and lateral profile.
The ratio of the dose rate in the beam centerline (peak) to the space between adjacent beams (valley), known as the peak to valley dose rate (PVDR), is an important characteristic of MRT since it has been shown to relate to both the normal tissue response and the tumor-cell killing.15,16 Traditionally, radiochromic film has been used for evaluating PVDRs and other clinically relevant parameters such as percent depth dose curves and scatter factors.17–19 A new detector that provided comparable resolution and accuracy to film along with real-time (on-line) dosimetry measurements would afford an ideal means of characterizing microbeam radiation.
1.B. Fiber-optic detectors
Advantages of fiber-optic detectors include: real time dose measurements, no artifacts in imaging or dose perturbation owing to the use of low Z materials, and sub millimeter diameter fiber sizes. Plastic scintillator based fiber-optic dosi-meters have been widely studied for use and applications in radiation therapy measurements.20–23 Prior work has shown the ability of fiber-optic dosimeters that feature 5 mm-long plastic scintillators to measure small radiation fields down to 1 cm diameter.24 Similarly, fiber-optic sensors assembled in 2D arrays have been demonstrated to measure radiation field sizes down to 1.5 × 5 cm with a resolution of 5 mm.25 However, the overall dimensions of these detectors are typically larger than 1 mm, limiting their utility for microbeam measurements.
1.C. Translation technique for measuring 1D profiles
Silicon strip detectors have been successfully used with translational motors to scan microbeam profiles by using on-line readout methods.26 Similarly, researchers have used a plastic scintillator based fiber-optic dosimeter for translational movement with a stepper motor and drive screw as a device to acquire the 1D lateral dose profile of a 10 × 10 cm electron beam at a resolution of 3.9 mm.27 However, for microbeam measurements in which the overall lateral beam dimension is less than 1 mm, a smaller optical fiber based point detector is required to achieve the necessary spatial resolution.
To date, there is no published work demonstrating the utility of a fiber-based detector for characterizing microbeam radiation. Herein, we demonstrate real-time radiation dose measurements in a mouse phantom at sub-millimeter resolution using a planar x-ray microbeam irradiation geometry. This study is made possible by the development of a dosimetry device based on an inorganic nano-crystalline scintillator, featuring a 600 μm diameter, 11 μm thick active detector element at the fiber terminus. This device was shown to provide accurate dosimetry for both diagnostic imaging (80 kVp) and small-animal radiation therapy (225 kVp).28 Here, we further compare the nano-crystalline scintillator fiber-optic detector dose measurements to independent radiochromic film measurements to assess its suitability as a real-time dosimetry tool for MRT.
2. METHODS AND MATERIALS
2.A. Compact microbeam x-ray system
The nanotechnology-based compact x-ray microbeam irradiator uses five linear carbon-nanotube (CNT) cathodes aligned in the length direction to produce a linear cathode for microbeam x-ray production. The linear cathode array design enables significantly higher dose rate compared to the conventional point cathode x-ray tube design. The five segments of electron source array are focused onto the surface of a common tungsten-rhenium anode with an energy 160 kVp.12,13 The resulting reflective x-ray focal line, created by the five aligned linear electron beams bombarding the tungsten anode, was 142 μm by 160 mm after projection into an angle of 8°. This projection angle was defined by the angle of the collimator slit relative to the anode surface. The 9 mm thick collimator featured an aperture measuring 175 μm × 150 mm with ±0.1 μm flatness over the entirety of the collimating surfaces. The collimator was aligned in two dimensions for maximum x-ray transmission. The resulting microbeam exited the collimator at a distance of 75 mm from the focal line; its width at the measurement point increased as a function of source to object distance (SOD).
2.B. Nano-scintillator fiber optic detector (nano-FOD)
The nano-FOD was fabricated from a 600 μm diameter inner core UV/vis optical fiber (LEONI Fiber Optics, Inc.) and an inorganic scintillator sensor pellet fabricated from an emissive [Y 1.9O3; Eu0.1, Li0.16] nanoscale scintillator composition.28 One end of the fiber was terminated with the 600 μm diameter, 11 μm thick scintillator sensor pellet, while the other end was connected to a PM100USB photo-diode laser power meter and S150C silicon diode (Thorlabs, Inc.). The diode was connected to a laptop computer via USB for real-time data acquisition and display. Using this setup, the detector system was able to record the rate of scintillator light output (in units of watts) due to the incident x-ray radiation field at the location of the scintillator. The diode software sampling rate was 20 Hz and the background signal due to diode noise and ambient light was subtracted from all of the data points during post-processing of the data. The standard deviation of the dark noise from the power meter and diode system was 6.21 × 10⁻¹³ W when operating at 20 Hz.
The scintillator sensor pellet thickness (z-axis dimension, aligned with the axis of the fiber) was measured using scanning electron microscope (SEM) imaging. Samples were mounted to a 90° post using carbon tape and were then imaged using an FEI XL30 SEM with Olympus Scandium imaging software. Measurements of thickness were made from four samples using the in-software measurement tools.
2.B.1. Calibration of the nano-FOD
A 0.18 cm3 (RadCal) ion chamber calibrated at the University of Wisconsin Accredited Dosimetry Calibration Laboratory was used to cross calibrate a 0.6 cm3 ion chamber (RadCal). The nano-FOD was then calibrated using the 0.6 cm3 ion chamber in a free-in-air geometry and an open field x-ray beam at 160 kVp, 8% duty cycle, 30 mA tube current, and 124 mm SOD. The emissive scintillator crystal on the tip of the fiber was located at the same position as the center of the cavity of the chamber, so that the effective point of measurement was equivalent for the two radiation detectors. By varying the duration of irradiation, four different levels of cumulative exposure were obtained, ranging from 52.2 to 824 R. These separate exposure levels were then used to create a linear fit of the integrated energy of the inorganic scintillator light output as a function of the cumulative exposure as measured by the 0.6 cm3 ion chamber. The slope of this line (units of J R−1) was divided by the f-factor for soft tissue at 160 kVp in order to obtain the calibration factor (CF) of the nano-FOD, represen-ting the scintillator light output as a function of dose (units of J cGy−1). Once obtained, this conversion factor was applied to the data to relate the light output measured by the diode to the instantaneous dose rate, (cGy s−1), according to
| (1) |
where G(t) is the time dependent optical power gross signal level measured by the diode (J s−1), B is the constant diode background signal level (J s−1), and CF is the calibration factor (J cGy−1). The cumulative uncertainty due to the calibration process was estimated to be 2%, due to 0.46% uncertainty in the calibration slope value, 1.9% uncertainty from UW ADCL calibration for the 0.18 cm3 ion chamber, and a standard deviation of 0.44% among the repeated measurements performed during the cross-calibration of the 0.6 cm3 ion chamber.
The f-factor was determined according to TG-61 and required a direct measurement of the half-value layer (HVL) of the CNT x-ray source. Varying thicknesses of aluminum were placed between radiochromic film (Gafchromic EBT2) and the microbeam source during multiple 14 min exposures conducted at 160 kVp, 30 mA, and 8% duty cycle. The HVL was found to be 7.5 mm Al, corresponding to a dose-in-air to dose-in-water conversion factor of 1.042 as taken from Table IV in TG-61; when multiplied by 0.877 cGy R−1 (in air), the resulting f-factor was 0.91 cGy R−1 (in water).
2.B.2. Nano-FOD dose measurement
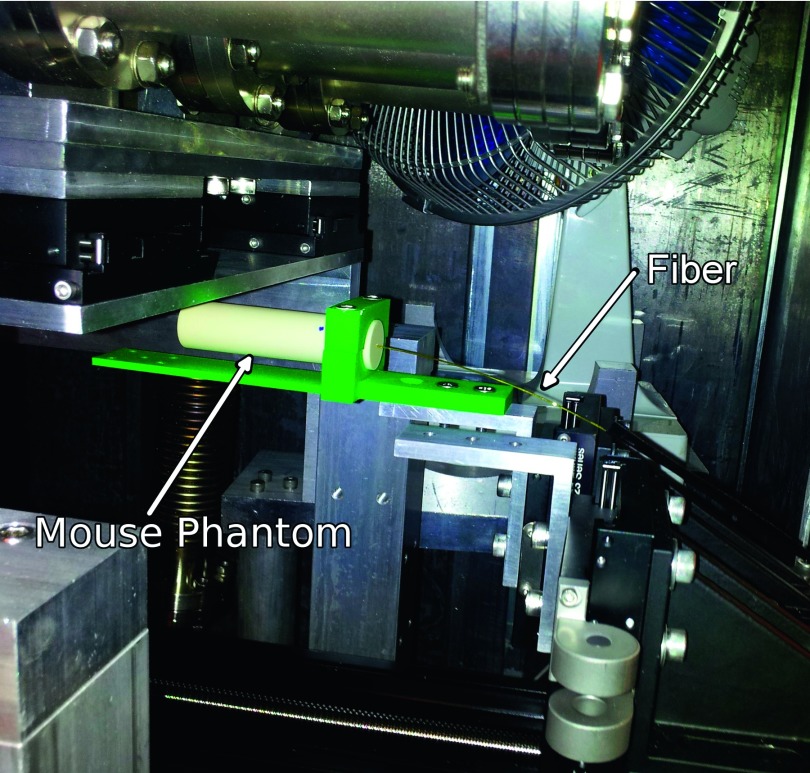
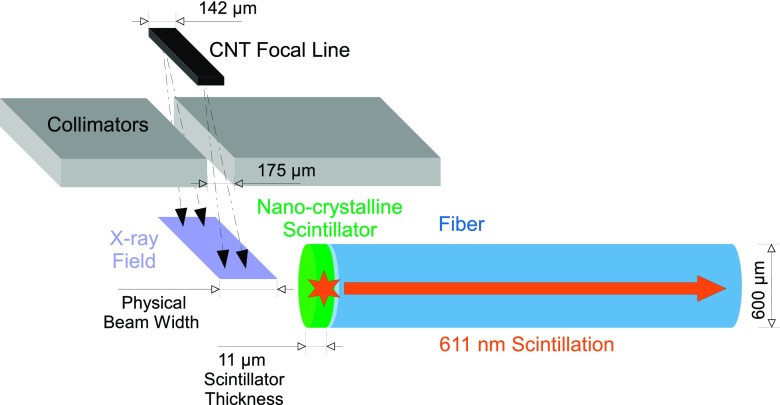
The nano-FOD was placed in a hole drilled in the center of a 2 cm diameter, cylindrical, tissue-equivalent mouse phantom (CIRS, Inc.). The detector was fixed at the central location along the Z-axis of the cylinder, and the entire phantom setup was clamped in place on a custom assembled translation stage (Newport) with 0.1 μm minimum incremental motion, as shown in Fig. 1. The fiber-optic was aligned approximately perpendicular (8° off perpendicular, due to the beam angle) to the direction of the collimated microbeam (Fig. 2) to ensure that the smallest dimension of the sensor pellet would be utilized to provide the highest measurement resolution possible; this technique is very similar to that employed in an “edge-on” MOSFET measurement.29
FIG. 1.
Experimental setup showing the placement of the fiber-optic detector in the tissue-equivalent mouse phantom, below the MRT x-ray tube. The green hardware served to clamp the mouse phantom on the stepper motor controlled translational stage. The translation stage moved from right-to-left as shown in this figure, along the axis of the fiber and the smallest scintillator dimension.
FIG. 2.
Diagram of the experimental setup showing fiber and scintillator orientation relative to the collimated microbeam. Note—not shown to scale, this is meant as a visual depiction only.
The software-controlled stepper motor translational stage moved the phantom and detector through the beam at a constant rate of 3.136 μm s−1. In order to sweep the lateral microbeam profile, the direction of translation was perpendicular to the long dimension of the planar x-ray beam and along the axis of the fiber. Similar to calibration, measurements were performed at 8% duty cycle, 30 mA, and 160 kVp, with the only difference being that the beam was now fully collimated. The stage was moved from right-to-left through the beam, as shown in Fig. 1.
2.C. Radiochromic film
2.C.1. Calibration of film
For film calibration, eleven swatches from the same batch of Gafchromic EBT2 film (Ashland Advanced Materials, Inc.) were cut and exposed to varying amounts of radiation from the uncollimated microbeam irradiator ranging from 0 to 60 R as measured by the 0.6 cm3 ion chamber. Films were placed at an equivalent distance from the x-ray focal line at the center of the ion chamber, as recommended in TG-61. Films were enveloped in 1.1 mm of acrylic, consistent with the x-ray attenuation experienced by the wall of the ion chamber. The encased film and ion chamber were placed side by side during the 160 kVp exposure for the calibration.
After irradiation, films were scanned with a Perfection V700 (Epson) scanner, according to manufacturer recommendations, in a consistent orientation in the center of the scanner and at 24 h after irradiation. A scan resolution of 72 dpi and 16 bits per channel color depth was employed. Raw RGB values were averaged over the entirety of the irradiated area for each color channel and anchored to the exposure readings as given by the ion chamber. Using FilmQATM Pro (Ashland Advanced Materials, Inc.), a rational function was fit to the eleven calibration points for each color channel.
2.C.2. Film measurement of beam profile and dose rate
After film calibration, the microbeam collimator on the irradiator was replaced and realigned and the microbeam dose rate was determined by irradiating several EBT2 film swatches from the same batch with various beam on-times, again using 160 kVp, 30 mA, 8% duty cycle, and 124 mm SOD. The film was scanned using the same procedure as film calibration, except with 2400 dpi to ensure the resolution necessary to observe the fine structure of the microbeam. The exposure at the microbeam peak was measured using FilmQATM Pro, plotted against the machine on-time, and then fit with linear regression. The average exposure rate was determined and converted to the dose rate in water using the f-factor above, while the full width at half maximum (FWHM) was measured by a simple inspection of the microbeam dose profile with FilmQATM Pro.
3. RESULTS
3.A. Nano-scintillator SEM measurement
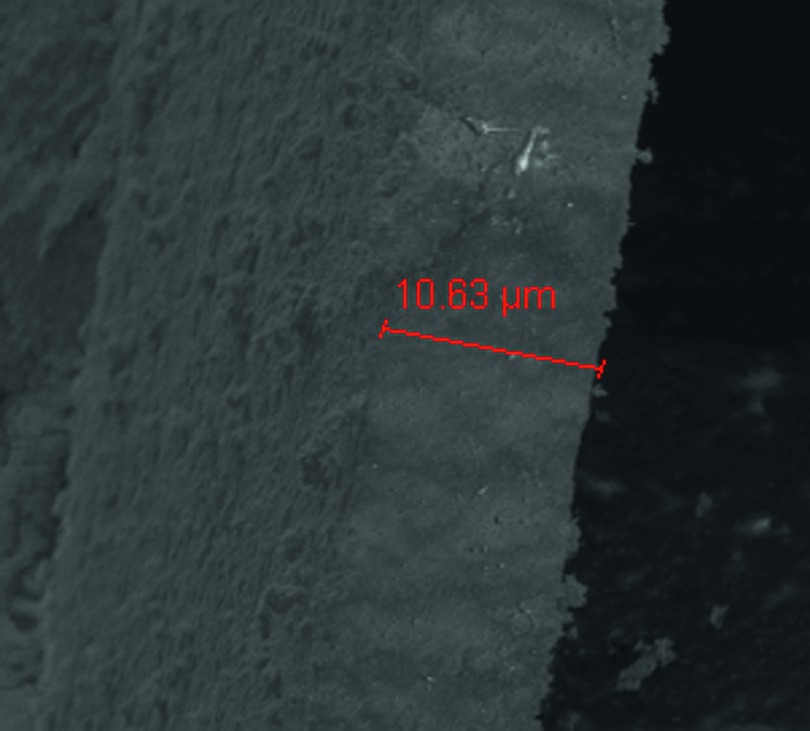
The thickness dimension of the 600 μm diameter sensor pellet, constructed from the nanoscale scintillator material was measured to be 11 μm; a SEM image is shown in Fig. 3.
FIG. 3.
SEM image highlighting the thickness of the sensor pellet fabricated from the emissive nanoscale scintillator. The pellet is shown here with the same relative orientation as it is depicted in Fig. 2.
3.B. Nano-FOD results
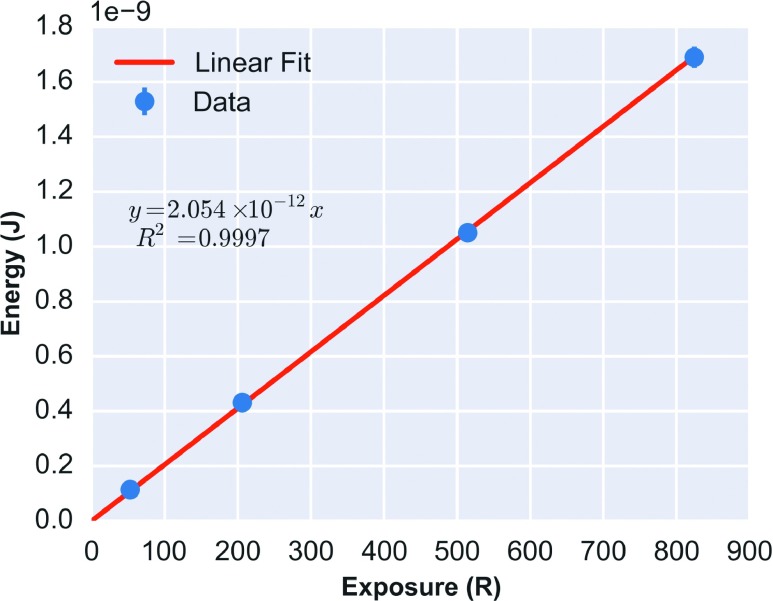
Using the CNT x-ray beam, the cross-calibrated correction factor of the 0.6 cm3 ion chamber was found to be 1.029 R Rdg−1 at 160 kVp. Figure 4 shows the linear fit of scintillator integrated optical power output vs cumulative x-ray exposure (R2 = 0.9997; slope = 2.054 × 10⁻¹² J R−1) for the nano-FOD. Dividing the calibration slope by the f-factor of 0.91 cGy R−1 yielded a nano-FOD dose calibration value of 2.257 × 10⁻¹² J cGy−1.
FIG. 4.
Linear calibration curve for the nano-FOD, measured at 160 kVp in an open-field. The nano-FOD integrated optical power (J) was calibrated in free-in-air geometry to the cumulative exposure using a 0.6 cm3 ion chamber.
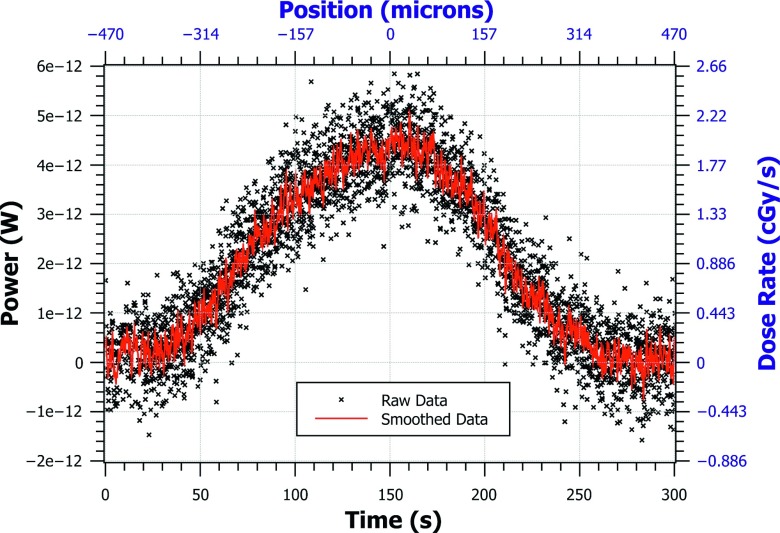
The real-time dose rate (cGy s−1), as shown in Fig. 5, was calculated according to Eq. (1), using the CF of 2.257 × 10⁻¹² J cGy−1.
FIG. 5.
The nano-FOD tip was translated through the microbeam to obtain this 1D beam profile of dose rate. The raw data were acquired as a function of time since the optical power can be converted to real-time dose rate as shown in Eq. (1). The position of the translational stage was obtained by multiplying the translation speed by the diode data timestamps. The left and bottom axes (black) are the units of raw data. The right and top axes (blue) are converted units. Time zero represents the right edge of the beam and time 300 s represents the left edge of the beam as the stage was moved from right-to-left.
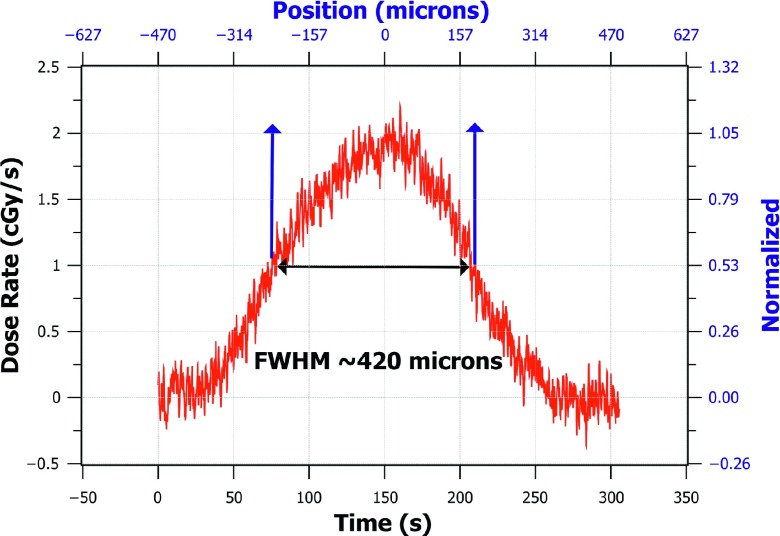
Similarly, by multiplying the diode timestamp values of the raw data by the constant speed of the translational stage, the position of the nano-FOD tip in the microbeam was calculated and could be displayed to the user in real time. To remove the noise and background signal in the beam profile measurement, smoothing was performed on the raw data by convolution with a “rect” function of width 0.55 s (11 data points), and the average background signal level was subtracted from all of the measurement points, as shown in Eq. (1). The continuous dose rate at the microbeam peak as measured with the nano-FOD was found to be 1.91 ± 0.06 cGy s−1; the nano-FOD-measured dose profile FWHM was 420 μm (as shown in Fig. 6).
FIG. 6.
FWHM measurement of the smoothed nano-FOD data showing the dose normalized to the average peak dose rate value on the right axis, shown in blue. Raw data were smoothed by convolution with a rect function of width 0.55 s (11 data points).
3.C. Film results
The microbeam dose rate as measured using film was found to be 1.16 Gy min−1 at 124 mm from the source and underneath 1.1 mm of acrylic, while the FWHM was found to be 320 μm. Since the nano-FOD was placed at 117 mm SOD within the cylindrical solid water phantom described above during dose rate measurement, a correction for attenuation and source distance was made, using TMR tables of planar and cylindrical phantom geometries, in order to appropriately compare the two values. Using these tables, a TMR of 0.974 was found to account for the attenuation of the flat 1.1 mm of acrylic used in the film irradiation; a TMR of 0.853 was found to describe the attenuation within the 10 mm radius cylinder. Moreover, a line source distance fall-off correction was used to relate the two measurements at different SOD, derived from a table previously measured using equivalent geometry. Using this table, the flux at the SOD of the nano-FOD measurement was found to be a factor of 1.1 higher than at the SOD of the film measurement. When combining these factors, it was found that the dose in the nano-FOD geometry could be compared to the dose value as measured by film, after the film dose value was adjusted by −3.9%. Therefore, the expected dose rate calculated from film measurements, with corrections applied (3.9%) for the purpose of comparison to the nano-FOD measurement, was 1.86 ± 0.15 cGy s−1.
4. DISCUSSION
The continuous dose rate at the x-ray microbeam peak measured with the nano-FOD was 1.91 ± 0.06 cGy s−1, a value 2.7% higher than that determined via radiochromic film measurements. The magnitude of the dose difference (2.7%) was found to be only marginally larger than the estimated calibration uncertainty of the fiber optic detector (2%), a difference that is within the uncertainty/accuracy of the MRT film measurement as reported by others.19 This finding suggests that the nano-FOD can be used to accurately measure the peak dose rate in microbeams with similar width as the CNT x-ray system used in this study.
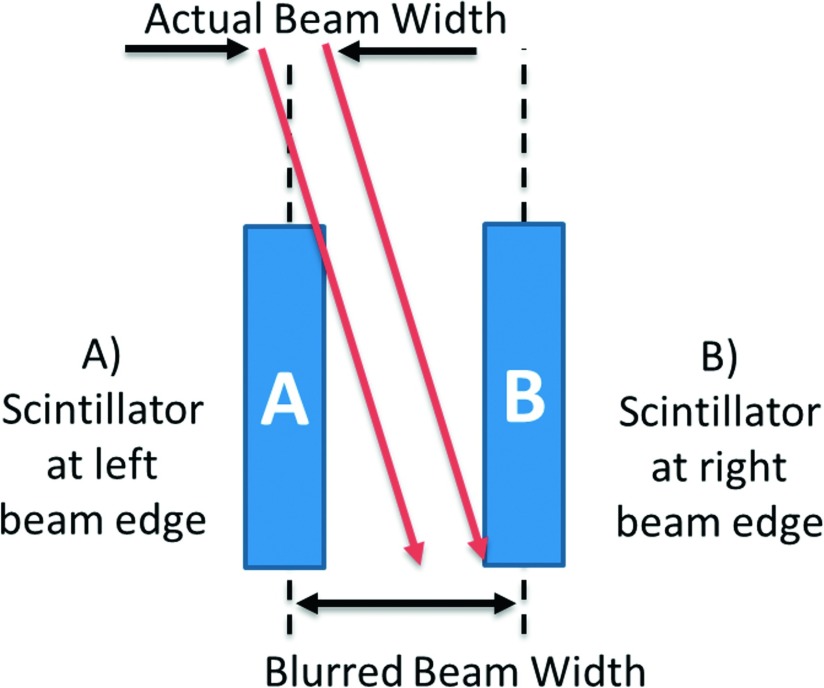
Due to the combined effect of the 11 μm width of the detector and the 8° beam angle with respect to vertical, the nano-FOD obtained a microbeam profile with a FWHM value that was 100 μm larger than the film measurement. As a result of these volumetric effects and blurring (depicted in Fig. 7), the nano-FOD did not provide a true “point-dose” measurement of the microbeam. Given the high resolution movement of the translation stage (3.136 μm s−1) and the 20 Hz sampling rate, the resulting dose profile was plotted at a resolution smaller than the emissive sensor pellet thickness, shown in Fig. 6.
FIG. 7.
Side view, visual representation of volumetric effects of detector element and geometric blurring induced from the 8° angle of the microbeam incident on the sensor pellet (see above). Beam angle is exaggerated in this figure to make volumetric effects more easily visible. The microbeam was scanned from right to left (time zero corresponds to position “B”).
To remove the effect of blurring due to the dimensions of the nano-crystalline detector element at the fiber optic terminus, one could theoretically de-convolve the measured profile by the point-spread-function (PSF) of the detector. This is a difficult task, since the measurement system was not necessarily linear-shift-invariant (LSI) and the PSF of the detector element is unknown. The reason the measurement system is not LSI is due to the changes in geometry that are dependent on the translational position of the scintillator relative to the radiation beam. For instance, when the scintillator was at the right edge of the beam, shown as position B in Fig. 7, the side of the scintillator sensor pellet is irradiated. This is in contrast to the geometry when the detector element was at position A where the beam was incident on the top of the scintillator sensor pellet. These two geometries may have different scintillation responses due to the portions of the sensor under irradiation, and possible corresponding differences in the light collection efficiencies at these positions of the fiber optic aperture. Spatial changes in sensitivity due to volumetric effects were not accounted for during the calibration of the device since a free-in-air and open-beam geometry was used.
Similarly, the modest variance between the film- and nano-FOD-determined beam FWHM is to be expected due to differences in the attenuation coefficients of the two dosimeters. The mean free path (MFP) of x-rays at an energy equal to the mean beam energy (60 keV) after undergoing a 90° Compton scatter event (53.7 keV) in the nano-FOD material was calculated to be a factor of 87 times smaller than the MFP of an x-ray in a near tissue equivalent material such as film.30 The tissue MFP (4.6 cm) was much larger than the overall dimension of the beam, so the majority of scattered-photon deposited dose occurred at large distances from the primary beam. However, the nano-crystalline detector element MFP (0.05 cm) is on the same order as the beam dimension, suggesting that a majority of the scattered photons interacted with and deposited energy into the scintillator at close distances to the primary beam. The resulting beam profile as measured with the nano-FOD would thus have increased dose in the penumbra, which may have led to the difference in the measured FWHM.
5. CONCLUSIONS
This work demonstrates that the nano-FOD detector opens up new possibilities for in-vivo dose measurements and real-time data acquisition when using x-ray microbeam irradiators. In addition, the nano-FOD offers a new way to measure the continuous dose rate at the peak of a microbeam.
Conceivably, the nano-FOD can be used to detect any finite number of beams in a parallel array and determine the PVDR of multi-collimated microbeams. The average dose in the x-ray microbeam peak for a 160 kVp beam was found to be in agreement to radiochromic film, indicating that the nano-FOD is a viable candidate to perform real-time dosimetry in MRT; this device thus stands in sharp contrast to the capabilities offered by radiochromic film dosimeters, which require several hours stabilizing time between irradiation and the obtained dosimetry result.
Due to the 8° angle of the microbeam, the FWHM measurements reported here achieved a resolution of ∼0.1 mm. However, a beam angle of 0° would theoretically lead to less blurring due to volumetric effects, with the limiting theoretical resolution approaching the width dimension of the nanocrystal-based scintillator detection element (∼0.01 mm).
5.A. Limitations and implications of the study
The valley dose from a multi-slit collimated array of microbeams was not measured in this study. To confirm the utility of this device for PVDR measurements, follow-up experiments must be performed to directly compare measured PVDR values from the nano-FOD to another technique (either Monte Carlo or film).
Since calibration was performed in an open field by illuminating the entire scintillator, the use of the light-to-dose conversion factor is only valid when the entire scintillator is illuminated by the radiation field. Therefore, the dose measurements made at the edges of the microbeam, where the scintillator was partially illuminated, are likely to have inherent error due to volumetric effects.
Differences in the mean-free-path of the nano-FOD’s nano-crystalline material relative to film may account for the differences between the measured values of the beam FWHM obtained using these detectors.
ACKNOWLEDGMENTS
This work was supported, in part, by grants from the U.S. Nuclear Regulatory Commission Health Physics Fellowship Grant (No. NRC-HQ-12-G-38-0022), the National Institute of Allergy and Infectious Diseases (5U19AI067798), the Department of Homeland Security, Domestic Nuclear Detection Office – Academic Research Initiative (2012-DN-077-ARI062), and the National Science Foundation (NSF-ECCS-11-40037). The work at UNC was supported by the National Cancer Institute (NCI) funded Carolina Centre for Cancer Nanotechnology Excellence (U54-CA151652). The authors report no conflicts of interest in conducting the research.
REFERENCES
- 1.Anschel D. J., Bravin A., and Romanelli P., “Microbeam radiosurgery using synchrotron-generated submillimetric beams: A new tool for the treatment of brain disorders,” Neurosurg. Rev. 34, 133–142 (2010). 10.1007/s10143-010-0292-3 [DOI] [PubMed] [Google Scholar]
- 2.Slatkin D. N., Spanne P., Dilmanian F. A., Gebbers J.-O., and Laissue J. A., “Subacute neuropathological effects of microplanar beams of x-rays from a synchrotron wiggler,” Proc. Natl. Acad. Sci. U. S. A. 92, 8783–8787 (1995). 10.1073/pnas.92.19.8783 [DOI] [PMC free article] [PubMed] [Google Scholar]
- 3.Crosbie J. C., Anderson R. L., Rothkamm K., Restall C. M., Cann L., Ruwanpura S., Meachem S., Yagi N., Svalbe I., Lewis R. A., Williams B. R., and Rogers P. A., “Tumor cell response to synchrotron microbeam radiation therapy differs markedly from cells in normal tissues,” Int. J. Radiat. Oncol., Biol., Phys. 77, 886–894 (2010). 10.1016/j.ijrobp.2010.01.035 [DOI] [PubMed] [Google Scholar]
- 4.Bräuer-Krisch E., Bravin A., Lerch M., Rosenfeld A., Stepanek J., Di Michiel M., and Laissue J. A., “MOSFET dosimetry for microbeam radiation therapy at the European Synchrotron Radiation Facility,” Med. Phys. 30, 583–589 (2003). 10.1118/1.1562169 [DOI] [PubMed] [Google Scholar]
- 5.Siegbahn E. A., Stepanek J., Bräuer-Krisch E., and Bravin A., “Determination of dosimetrical quantities used in microbeam radiation therapy (MRT) with Monte Carlo simulations,” Med. Phys. 33, 3248–3259 (2006). 10.1118/1.2229422 [DOI] [PubMed] [Google Scholar]
- 6.Martínez-Rovira I. and Prezado Y., “Monte Carlo dose enhancement studies in microbeam radiation therapy,” Med. Phys. 38, 4430–4439 (2011). 10.1118/1.3603189 [DOI] [PubMed] [Google Scholar]
- 7.Serduc R., Bouchet A., Bräuer-Krisch E., Laissue J. A., Spiga J., Sarun S., Bravin A., Fonta C., Renaud L., Boutonnat J., Siegbahn E. A., Estève F., and Le Duc G., “Synchrotron microbeam radiation therapy for rat brain tumor palliation-influence of the microbeam width at constant valley dose,” Phys. Med. Biol. 54, 6711–6724 (2009). 10.1088/0031-9155/54/21/017 [DOI] [PubMed] [Google Scholar]
- 8.Prezado Y., Sarun S., Gil S., Deman P., Bouchet A., and Le Duc G., “Increase of lifespan for glioma-bearing rats by using minibeam radiation therapy,” J. Synchrotron Radiat. 19, 60–65 (2012). 10.1107/s0909049511047042 [DOI] [PubMed] [Google Scholar]
- 9.Dilmanian F. A., Zhong Z., Bacarian T., Benveniste H., Romanelli P., Wang R. L., Welwart J., Yuasa T., Rosen E. M., and Anschel D. J., “Interlaced x-ray microplanar beams: A radiosurgery approach with clinical potential,” Proc. Natl. Acad. Sci. U. S. A. 103, 9709–9714 (2006). 10.1073/pnas.0603567103 [DOI] [PMC free article] [PubMed] [Google Scholar]
- 10.Schreiber E. C. and Chang S. X., “Monte Carlo simulation of a compact microbeam radiotherapy system based on carbon nanotube field emission technology,” Med. Phys. 39, 4669–4678 (2012). 10.1118/1.4728220 [DOI] [PMC free article] [PubMed] [Google Scholar]
- 11.Chtcheprov P., Burk L., Yuan H., Inscoe C., Ger R., Hadsell M., Lu J., Zhang L., Chang S., and Zhou O., “Physiologically gated microbeam radiation using a field emission x-ray source array,” Med. Phys. 41, 081705 (8pp.) (2014). 10.1118/1.4886015 [DOI] [PMC free article] [PubMed] [Google Scholar]
- 12.Hadsell M., Zhang J., Laganis P., Sprenger F., Shan J., Zhang L., Burk L., Yuan H., Chang S., Lu J., and Zhou O., “A first generation compact microbeam radiation therapy system based on carbon nanotube X-ray technology,” Appl. Phys. Lett. 103, 183505 (2013). 10.1063/1.4826587 [DOI] [PMC free article] [PubMed] [Google Scholar]
- 13.Zhang L., Yuan H., Burk L. M., Inscoe C. R., Hadsell M. J., Chtcheprov P., Lee Y. Z., Lu J., Chang S., and Zhou O., “Image-guided microbeam irradiation to brain tumour bearing mice using a carbon nanotube x-ray source array,” Phys. Med. Biol. 59, 1283–1303 (2014). 10.1088/0031-9155/59/5/1283 [DOI] [PMC free article] [PubMed] [Google Scholar]
- 14.Siegbahn E. A., “Dosimetry for synchrotron x-ray microbeam radiation therapy,” Ph.D. thesis, Technical University of Munich, 2007. [Google Scholar]
- 15.Slatkin D. N., Spanne P., Dilmanian F. A., and Sandborg M., “Microbeam radiation therapy,” Med. Phys. 19, 1395–1400 (1992). 10.1118/1.596771 [DOI] [PubMed] [Google Scholar]
- 16.Zhong N., Morris G. M., Bacarian T., Rosen E. M., and Avraham Dilmanian F., “Response of rat skin to high-dose unidirectional x-ray microbeams: A histological study,” Radiat. Res. 160, 133–142 (2003). 10.1667/3033 [DOI] [PubMed] [Google Scholar]
- 17.Crosbie J. C., Svalbe I., Midgley S. M., Yagi N., Rogers P. A. W., and Lewis R. A., “A method of dosimetry for synchrotron microbeam radiation therapy using radiochromic films of different sensitivity,” Phys. Med. Biol. 53, 6861–6877 (2008). 10.1088/0031-9155/53/23/014 [DOI] [PubMed] [Google Scholar]
- 18.Prezado Y., Martínez-Rovira I., and Sánchez M., “Scatter factors assessment in microbeam radiation therapy,” Med. Phys. 39, 1234–1238 (2012). 10.1118/1.3681274 [DOI] [PubMed] [Google Scholar]
- 19.Bräuer-Krisch E., Siegbahn E. A., and Bravin A., Presented at the World Congress on Medical Physics and Biomedical Engineering, Munich, Germany, September 7-12 (2009).
- 20.Archambault L., Beddar A. S., Gingras L., Lacroix F., Roy R., and Beaulieu L., “Water-equivalent dosimeter array for small-field external beam radiotherapy,” Med. Phys. 34, 1583–1592 (2007). 10.1118/1.2719363 [DOI] [PubMed] [Google Scholar]
- 21.Beddar A. S., Mackie T. R., and Attix F. H., “Water-equivalent plastic scintillation detectors for high-energy beam dosimetry: I. Physical characteristics and theoretical considerations,” Phys. Med. Biol. 37, 1883–1900 (1992). 10.1088/0031-9155/37/10/006 [DOI] [PubMed] [Google Scholar]
- 22.Beddar A. S., “Plastic scintillation dosimetry and its application to radiotherapy,” Radiat. Meas. 41, S124–S133 (2006). 10.1016/j.radmeas.2007.01.002 [DOI] [Google Scholar]
- 23.Moon J., Jang K. W., Yoo W. J., Han K. T., Park J. Y., and Lee B., “Water-equivalent one-dimensional scintillating fiber-optic dosimeter for measuring therapeutic photon beam,” Appl. Radiat. Isot. 70, 2627–2630 (2012). 10.1016/j.apradiso.2012.07.017 [DOI] [PubMed] [Google Scholar]
- 24.Létourneau D., Pouliot J., and Roy R., “Miniature scintillating detector for small field radiation therapy,” Med. Phys. 26, 2555–2561 (1999). 10.1118/1.598793 [DOI] [PubMed] [Google Scholar]
- 25.Lee B., Jang K. W., Cho D. H., Yoo W. J., Shin S. H., Kim H. S., Yi J. H., Kim S., Cho H., Park B. G., Moon J. H., and Kim S., “Measurement of two-dimensional photon beam distributions using a fiber-optic radiation sensor for small field radiation therapy,” IEEE Trans. Nucl. Sci. 55, 2632–2636 (2008). 10.1109/tns.2008.2002579 [DOI] [Google Scholar]
- 26.Petasecca M., Cullen A., Fuduli I., Espinoza A., Porumb C., Stanton C., Aldosari A. H., Bräuer-Krisch E., Requardt H., Bravin A., Perevertaylo V., Rosenfeld A. B., and Lerch M. L. F., “X-tream: A novel dosimetry system for synchrotron microbeam radiation therapy,” J. Instrum. 7, P07022 (2012). 10.1088/1748-0221/7/07/p07022 [DOI] [Google Scholar]
- 27.Lee B. S., Cho D. H., Chung S. C., Yi J. H., Jang K. W., Kim S., Cho H. S., and Kim S. Y., “High resolution one-dimensional dose measurement using a movable miniature fiber-optic radiation sensor,” Key Eng. Mater. 321, 992–995 (2006). 10.4028/www.scientific.net/kem.321-323.992 [DOI] [Google Scholar]
- 28.Stanton I. N., Belley M. D., Nguyen G., Rodrigues A., Li Y., Kirsch D. G., Yoshizumi T. T., and Therien M. J., “Europium- and lithium-doped yttrium oxide nanocrystals that provide a linear emissive response with X-ray radiation exposure,” Nanoscale 6, 5284–5288 (2014). 10.1039/c4nr00497c [DOI] [PMC free article] [PubMed] [Google Scholar]
- 29.Kaplan G. I., Rosenfeld A. B., Allen B. J., Booth J. T., Carolan M. G., and Holmes-Siedle A., “Improved spatial resolution by MOSFET dosimetry of an x-ray microbeam,” Med. Phys. 27, 239–244 (2000). 10.1118/1.598866 [DOI] [PubMed] [Google Scholar]
- 30.Arjomandy B., Tailor R., Anand A., Sahoo N., Gillin M., Prado K., and Vicic M., “Energy dependence and dose response of Gafchromic EBT2 film over a wide range of photon, electron, and proton beam energies,” Med. Phys. 37, 1942–1947 (2010). 10.1118/1.3373523 [DOI] [PubMed] [Google Scholar]


