

Abstract
Background
Patients with venous thromboembolism (VTE) commonly have an underlying genetic predisposition. However, genetic tests nowadays in use have very low sensitivity for identifying subjects at risk of VTE. Thrombo inCode® is a new genetic tool that has demonstrated very good sensitivity, thanks to very good coverage of the genetic variants that modify the function of the coagulation pathway.
Objective
To conduct an economic analysis of risk assessment of VTE from the perspective of the Spanish National Health System with Thrombo inCode® (a clinical–genetic function for assessing the risk of VTE) versus the conventional/standard method used to date (factor V Leiden and prothrombin G20210A).
Methods
An economic model was created from the National Health System perspective, using a decision tree in patients aged 45 years with a life expectancy of 81 years. The predictive capacity of VTE, based on identification of thrombophilia using Thrombo inCode® and using the standard method, was obtained from two case–control studies conducted in two different populations (S. PAU and MARTHA; 1,451 patients in all). Although this is not always the case, patients who were identified as suffering from thrombophilia were subject to preventive treatment of VTE with warfarin, leading to a reduction in the number of VTE events and an increased risk of severe bleeding. The health state utilities (quality-adjusted life-years [QALYs]) and costs (in 2013 EUR values) were obtained from the literature and Spanish sources.
Results
On the basis of a price of EUR 180 for Thrombo inCode®, this would be the dominant option (more effective and with lower costs than the standard method) in both populations. The Monte Carlo probabilistic analyses indicate that the dominance would occur in 100 % of the simulations in both populations. The threshold price of Thrombo inCode® needed to reach the incremental cost-effectiveness ratio (ICER) generally accepted in Spain (EUR 30,000 per QALY gained) would be between EUR 3,950 (in the MARTHA population) and EUR 11,993 (in the S. PAU population).
Conclusion
According to the economic model, Thrombo inCode® is the dominant option in assessing the risk of VTE, compared with the standard method currently used.
Key Points for Decision Makers
| Thrombo inCode® is a clinical–genetic function for assessing the risk of venous thromboembolism. |
| For a Thrombo inCode® price of EUR 180 in Spain, this would be the dominant option (more effective and with lower costs than the standard method). |
| Probabilistic sensitivity analyses indicate that the dominance would occur in 100 % of the simulations. |
Introduction
Thrombophilia is a hereditary or an acquired haematological defect characterized by hypercoagulability of the blood and the patient’s predisposition to suffer thrombosis, increasing the risk of venous thromboembolism (VTE) [1]. The most well-known genetic defects related to hereditary thrombophilia are mutations of factor V Leiden (FVL) and prothrombin G20210A (PT) [2, 3]. The first is a mutation of the gene that codes for coagulation factor V (1691G–A) and the second is a mutation of the prothrombin gene (PTG20210A) associated with high plasma levels of this protein [1].
The Computerized Registry of Patients with Venous Thromboembolism (RIETE) has confirmed thrombophilia in 32 % of the patients tested, and in 25 and 17 % of these, a mutation of FVL and PT, respectively, was found [3].
Depending on the blocked vessel, VTE may lead to deep vein thrombosis (DVT) or pulmonary embolism (PE) with an important mortality rate [1]. For this reason, it is advisable to conduct diagnostic tests for thrombophilia (a) in patients with a first event of spontaneous VTE under the age of 40 years; (b) in patients with VTE who have a family history of VTE (in two relatives); (c) in patients with secondary VTE following pregnancy, contraceptives or hormone therapy; and (d) in first-degree relatives of patients with VTE [4, 5].
The annual health cost of VTE in Spain was estimated at EUR 66.5 million in the year 2005. Of this figure, PE represented EUR 45 million (67.7 %) and DVT represented EUR 21.4 million (33.3 %). Ninety percent of the cost derived from hospital care [6]. The total annual direct and indirect costs of managing VTE in the UK were estimated at GBP 640 million in 2007. The national expenditure associated with DVT in the USA was estimated to have been USD 1.5 billion in 1997 [7].
Thrombo inCode® (TiC) enables diagnosis of hereditary thrombophilia (by analysing genetic variants affecting different points of the blood coagulation cascade function, promoting the development of VTE) and is also a clinical–genetic function for assessing the risk of VTE. In the latter case, the aim is to identify whether a genetic basis exists that has contributed to the development of VTE. If this is the case, this genetic basis should be considered in the future in order to prevent a new event when predisposing clinical–environmental factors coincide. In the case of people with a family history of VTE, the aim is to confirm whether they have received a genetic load that predisposes them to developing an event. If this is the case, physicians have to establish, together with the patient, a preventive strategy to avoid development of VTE in the event of concomitant predisposing clinical–environmental factors. TiC has been validated in two case–control studies in populations known as S. PAU and MARTHA [8]. Using a saliva or blood sample, TiC enables simultaneous detection of the alleles of 12 variants located in seven genes (PT, FVL, FXII, FXIII, ABO, Serpin A10 and Serpin C1) associated with VTE [8].
This study aimed to provide an economic analysis of risk assessment of VTE with TiC in Spain, from the perspective of the Spanish National Health System, in patients suffering a first spontaneous VTE event, in comparison with the conventional/standard method (SM), which uses only FVL and PT.
Methods
Cost effectiveness is a highly relevant decision-making tool in the Spanish National Health System [9]. A cost-effectiveness analysis was conducted in order to assess the effectiveness of using TiC to evaluate the risk of suffering VTE in Spain, compared with SM.
A model was developed using an adapted decision tree based on the one recently published by Compagni et al. [10] (Fig. 1). In patients suffering VTE, the presence of thrombophilia was evaluated using TiC and SM. The initial identification of thrombophilia and the predictive capacity (positive detection in patients suffering a VTE event or negative detection in patients without VTE) of both methods were obtained from two case–control studies [11, 12] conducted in the two aforementioned populations (S. PAU, from Spain, and MARTHA, from France) [8]. The main clinical features of the patients included in these populations are given below for cases/controls in S. PAU and MARTHA, respectively: (1) mean age of the patients: 49.0/47.1 years (S. PAU) and 44.2/43.9 years (MARTHA); (2) percentage of men: 44.0/44.6 % (S. PAU) and 41.5/41.5 % (MARTHA); (3) percentage of smokers: 40.7/43.7 % (S. PAU) and 30.2/27.7 % (MARTHA); and (4) percentage of patients on oral contraceptives: 29.8/33.5 % (S. PAU) and 22.1/39.4 % (MARTHA) [8]. The main differences between the S. PAU and MARTHA populations are the proportions of carriers of the FVL and PT mutations and data collection regarding family history. The MARTHA population is artificially enriched in subjects carrying the FVL and PT mutations as an stress test situation in order to study the relevance of new biomarkers of these two mutations. S. PAU is a population representative of the general white population [8]. Clinical data regarding family history are not collected in the MARTHA population.
Fig. 1.
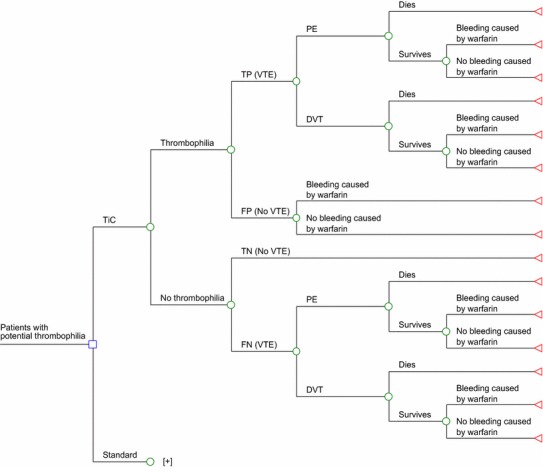
Model used for evaluating the efficiency of Thrombo inCode® (TiC), a clinical–genetic function for estimating the risk of venous thromboembolism (VTE) in patients with potential thrombophilia, versus the standard method used to date (factor V Leiden and prothrombin G20210A) [10]. Plus indicates that the standard method sub-tree has the same structure as the TiC sub-tree, but it has been hidden to simplify the figure. DVT Deep vein thrombosis, FN false negative, FP false positive, PE pulmonary embolism, TN true negative, TP true positive
The hypothetical patient follows the sequence shown in the decision tree (Fig. 1). The evolution of the patient ends when the patient dies from VTE or survives VTE with or without bleeding due to warfarin therapy. It was considered that the patients included in the model would be aged 45 years (the mean age of the patients in the S. PAU and MARTHA studies) with a life expectancy in Spain for both genders of 81 years [13]; for this reason, the patient follow-up period was 35 years for the base case in the analysis [10].
TiC or SM are applied once in life. It was assumed that positive identification of thrombophilia with one method or the other gives rise to preventive treatment, preventing coincidence of clinical–environmental factors that favour VTE. Alternatively, this preventive treatment may involve administration of anticoagulants while the clinical–environmental factor that favours VTE persists. In this economic analysis, we considered the extreme situation for TiC, consisting of administration of an anticoagulant with warfarin (for 6 months in the base case analysis [according to clinical practice] [1, 14] and lifelong [35 years] in the worst-case scenario considered in the sensitivity analysis) to all thrombophilia patients. Administration of anticoagulants would lead to a risk reduction of VTE and an increased risk of severe bleeding (including intracranial bleeding) related to the anticoagulant treatment [1]. It is assumed that the relative risk reduction of warfarin in preventing VTE is applicable throughout the duration of warfarin treatment and that this effect is instantly removed following the cessation of warfarin treatment [1]. A VTE event may be a PE or a DVT, with their specific risks of death (Fig. 1). The predictive capacities of TiC and SM are summarized in Table 1. On the basis of these capacities, the probabilities of suffering a VTE event with or without thrombophilia were calculated with TiC or SM. For instance, in MARTHA, 47.1 % of the sample were identified as thrombophilia patients with SM, 56.6 % of these were true positives (cases with VTE) (Table 1), and anticoagulant treatment led to a relative risk reduction of 95 % [1]. Therefore, in this case, the probability of a VTE event in a patient with thrombophilia identified through SM and treated with warfarin would be 0.0133 [0.471 × 0.566 × 0.05]. The rest of the probability values (relative risk reduction of VTE with warfarin, frequency of PE, mortality due to PE and VTE, and risk of severe bleeding with warfarin) are shown in Table 2 [1, 10, 15].
Table 1.
Venous thromboembolism (VTE) predictive capacity in identifying thrombophilia with Thrombo inCode® (TiC) and with the standard method (SM), assessed in two case–control studies [7]
| Population | Cases | Controls | Total | TiC (%) | FVL + PT (%) | ||
|---|---|---|---|---|---|---|---|
| S. PAU | TiC | Positive test | 79.3 | 12.3 | |||
| Positive | 212 | 182 | 394 | True positivea | 53.8 | 80.3 | |
| Negative | 36 | 67 | 103 | False positivea | 46.2 | 19.7 | |
| Total | 248 | 249 | 497 | Sensitivity | 85.5 | 19.8 | |
| FVL + PT | Negative test | 20.7 | 87.7 | ||||
| Positive | 49 | 12 | 61 | True negativea | 65.0 | 54.4 | |
| Negative | 199 | 237 | 436 | False negativea | 35.0 | 45.6 | |
| Total | 248 | 249 | 497 | Specificity | 26.9 | 95.2 | |
| MARTHA | TiC | Positive test | 79.1 | 47.1 | |||
| Positive | 404 | 351 | 755 | True positivea | 53.5 | 56.6 | |
| Negative | 73 | 126 | 199 | False positivea | 46.5 | 43.4 | |
| Total | 477 | 477 | 954 | Sensitivity | 84.7 | 53.2 | |
| FVL + PT | Negative test | 20.9 | 52.9 | ||||
| Positive | 254 | 195 | 449 | True negativea | 63.3 | 55.8 | |
| Negative | 223 | 282 | 505 | False negativea | 36.7 | 44.2 | |
| Total | 477 | 477 | 954 | Specificity | 26.4 | 59.1 |
FVL factor V Leiden, PT prothrombin G20210A
a‘True positive’ indicates a patient in whom thrombophilia was identified, who suffered a VTE event; ‘false positive’ indicates a patient in whom thrombophilia was identified, who did not suffer a VTE event; ‘true negative’ indicates a patient in whom thrombophilia was not identified, who did not suffer a VTE event; ‘false negative’ indicates a patient in whom thrombophilia was not identified, who suffered a VTE event
Table 2.
Model variables (in addition to those listed in Table 1)
| Variable | Base case | Interval | References |
|---|---|---|---|
| Probabilities | |||
| RRR of VTE with warfarin | 0.95000 | ±10 % | [1] |
| VTE is a PE | 0.47000 | ±10 % | [17] |
| Death due to PE | 0.04500 | 0.03100–0.06500a | [10] |
| Death due to DVT | 0.00700 | 0.00330–0.01280a | [10] |
| Severe bleeding due to warfarin | 0.01062 | 0.00956–0.01168a | [1, 15] |
| Severe bleeding without warfarin | 0 | 0 | [1] |
| Costs (in 2013 EUR values)b | |||
| TiC | 180.00 | 150.00–350.00 | Ferrer inCode |
| SMc | 85.76 | 68.61–102.91 | [19] |
| Positive for thrombophiliad | 165.12 | 132.10–198.14 | [20, 21] |
| PE (event) | 3,935.88 | 3,148.71–4,723.06 | [17, 18] |
| DVT (event) | 3,647.40 | 2,917.92–4,376.89 | [17, 18] |
| Severe bleeding (event)e | 3,930.47 | 3,144.38–4,716.57 | [22] |
| Utilities | |||
| No events | 0.82000 | 0.73800–0.90200 | [23] |
| VTE | 0.79167 | 0.71250–0.87084 | [17, 23] |
| Severe bleeding | 0.51000 | 0.45900–0.56100 | [23] |
| Death | 0 | 0 | [1] |
DVT deep vein thrombosis, PE pulmonary embolism, RRR relative risk reduction, TiC Thrombo inCode®, VTE venous thromboembolism
a95 % confidence interval
b±20 %
cFactor V Leiden and molecular diagnosis of the G20210A prothrombin variant
d6 months of treatment with warfarin
eIncludes intracranial bleeding
We assumed ‘real world’ treatment adherence rates derived from the literature (60 % adherence after year 1, 45 % after year 2, 40 % after year 3 and thereafter remaining stable) [16]. An average adherence rate was calculated on the basis of these data.
The estimation of severe bleeding rates in patients on warfarin was considered to be 2.24 % during the first 3 months, according to RIETE [15], and 0.33 % at 9 months and during the next 4 years, according to the systematic review by Simpson et al. [1]. The mortality rate associated with PE and VTE was obtained from the study conducted by Compagni et al. [10]. As in the study by Compagni et al. [10], we considered that the risk of complications (VTE, PE, death due to VTE or PE), costs and utilities remain constant throughout the simulation. This simplification was necessary because there are no data on the diagnostic effectiveness of TiC and SM for age ranges.
The analysis was done according to the Spanish National Health System perspective; therefore, only direct health costs were included. The SM unit costs for thrombophilia (treatment for 6 months with warfarin) and for events of PE, VTE and severe bleeding (expressed in 2013 EUR values) were obtained from Spanish sources [17–22] (Table 2). The TiC price was provided by Ferrer inCode. The health state utilities with no VTE events or bleeding, with VTE or with severe bleeding (on the basis of which quality-adjusted life-years [QALYs] were estimated), were obtained from a systematic review performed by the UK National Collaborating Centre for Acute Care [23] and other published sources [1, 17] (Table 2). The model is a decision tree. Therefore, the utilities used refer exclusively to the duration of the event. If an event does not occur, the utility is the same as that in the general population (0.82). If the patient suffers from VTE, the utility in that branch of the tree is 0.792 (Table 2). Annual discounts of 3.5 % were applied to costs and utilities.
The results are presented as an incremental cost-effectiveness ratio (ICER), i.e. the cost of gaining a QALY (and the cost of gaining one life-year without a quality adjustment) using the option with the highest predictive capacity (TiC) versus SM.
The base case included the mean values of all variables (Table 2). Deterministic analyses were done in the base case and in the univariate sensitivity analyses and threshold analysis for the price of TiC and the duration of warfarin treatment (6 months in the base case, between 1 and 35 years in the sensitivity analysis). In addition, probabilistic sensitivity analyses were conducted by Monte Carlo simulations [24]. The probabilistic analysis included the distributions of all model variables (log-normal for costs, Gamma for utilities and Beta for the transition probabilities) [25], and 1,000 simulations were done for a hypothetical cohort of 10,000 patients.
The model was created with the TreeAge Pro Healthcare Module 2009 program [26]. The economic model was validated internally and externally. The following validation methods were used: (1) double checking of input values; and (2) checking of face validity with clinicians and experts on clinical–genetic functions (J. Vila and R. Elosua).
Results
Deterministic Analysis
The results for the base case of the deterministic cost-effectiveness analysis are summarized in Table 3. Considering the cost of gaining an additional QALY or gaining one life-year (not adjusted for the quality of life), TiC was the dominant option (with fewer costs and greater effectiveness than SM) in both populations. In each patient treated with TiC, 0.3288 and 0.1087 QALY would be gained in S. PAU and MARTHA, respectively, versus SM. The difference in life-years between the compared options would be 0.1505 and 0.0468, respectively. The savings per patient treated with TiC versus SM would be between EUR 517.92 (in MARTHA patients) and EUR 1,963.03 (in S. PAU patients).
Table 3.
Results of the deterministic cost-effective analysis: base case
| Population | Method | Cost (EUR) | QALYs | QALY ICER | Life-years | Life-year ICER |
|---|---|---|---|---|---|---|
| S. PAU | TiC | 832.58 | 8.5874 | Dominanta | 10.4645 | Dominanta |
| SM | 2,795.61 | 8.2586 | 10.3140 | |||
| Difference | −1,963.03 | 0.3288 | 0.1505 | |||
| MARTHA | TiC | 848.38 | 8.5871 | Dominanta | 10.4644 | Dominanta |
| SM | 1,366.30 | 8.4784 | 10.4176 | |||
| Difference | −517.92 | 0.1087 | 0.0468 |
ICER incremental cost-effectiveness ratio (difference in costs/difference in effectiveness), SM standard method, TiC Thrombo inCode®, QALY quality-adjusted life-year
aTiC is more effective, with lower costs: it is the dominant option
In accordance with the tornado diagrams shown in Fig. 2, the deterministic sensitivity analysis indicates that, compared with SM, TiC would be a cost-effective method in all scenarios for a generally accepted cost-effectiveness threshold in Spain of EUR 30,000 for each QALY gained [27]. The threshold price of TiC for reaching that threshold would be between EUR 3,950 (in MARTHA patients) and EUR 11,993 (in S. PAU patients).
Fig. 2.
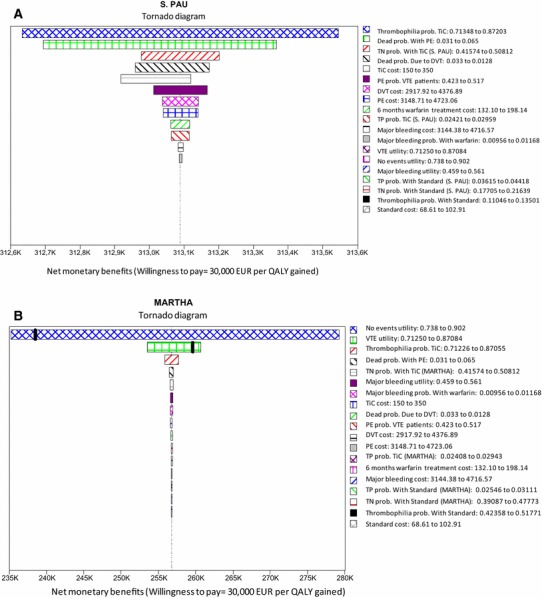
Deterministic sensitivity analysis: tornado diagrams. a S. PAU population. b MARTHA population. K indicates thousands, e.g. 240 K is EUR 240,000. DVT Deep vein thrombosis, PE pulmonary embolism, Prob probability, QALY quality-adjusted life-year, TiC Thrombo inCode®, TN true negative, TP true positive, VTE venous thromboembolism
Additionally, TiC was the dominant treatment, irrespective of the timeline chosen (between 1 and 35 years) in patients from both populations. In the event of treatment with warfarin lasting more than 1 year, TiC would continue to be the dominant treatment in both populations. If the warfarin treatment was hypothetically a lifelong treatment (35 years), the cost of gaining a QALY with TiC compared with SM would be EUR 17,271 (in S. PAU patients) or EUR 28,846 (in MARTHA patients)—in both cases, below the cost-effectiveness threshold.
Probabilistic Analysis (Monte Carlo Simulation)
The Monte Carlos probabilistic analyses indicate that the dominance would occur in 100 % of the simulations in both populations (Fig. 3).
Fig. 3.
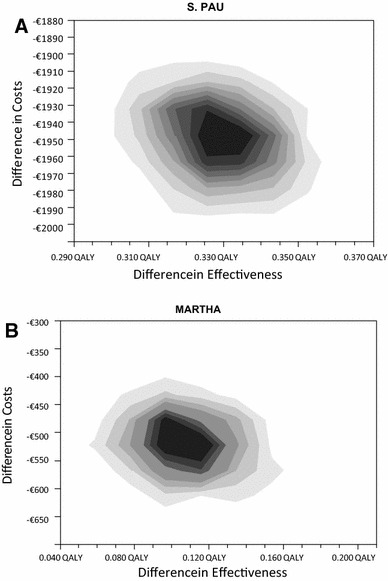
Monte Carlo probabilistic analysis. a S. PAU population. b MARTHA population. 1,000 simulations were performed in a hypothetical cohort of 10,000 patients. The cost per patient is lower with Thrombo inCode® than with the standard method in 100 % of the simulations. QALY quality-adjusted life-year
Discussion
This is the first economic analysis done with respect to the efficiency of the TiC clinical–genetic function. In accordance with the model used, TiC is a cost-effective option in evaluating thrombophilia versus SM in patients suffering a first spontaneous VTE event.
In assessing the study results, we should consider its potential limitations and consistencies. With regard to the former, it should be remembered that this is a theoretical model, which is, by definition, a simplified simulation of reality. However, the economic analysis was performed with a model based on another recently published model [10] with Monte Carlo probabilistic analyses [24], which helped to test the robustness of the model.
The predictive capacity of the compared methods was calculated on the basis of the results of two TiC case–control studies (in a Spanish population and a French population) in a total of 1,451 patients [6]. In this respect, the problems of observational studies, due to the potential problems of data quality and internal validity, must be considered. It should be noted also that not all false positives detected at the time of the study will continue to be so on a lifelong basis. This may occur because, to date, their genetic risk was not expressed by the phenotype, because of absence of the environmental factors that trigger VTE—a coexistence that could arise in the future, in which case they would no longer be false positives. The probabilities of evolution in thrombophilia patients were calculated on the basis of National Institute for Health and Care Excellence (NICE) systematic reviews [1] and Spanish studies and data when available [15, 17]. Only mortality from PE and DVT was considered in the model. The mortality related to bleeding due to warfarin was not included. Bleeding from warfarin was considered only for calculation of costs. This was a conservative approach because it goes against the most effective arm (TiC).
The utilities were obtained from a systemic review carried out in the UK [23] and from other European sources [1, 17]. Regarding the validity of these utility data in comparison with the Spanish population, it is interesting to note that in a study based on 83,000 assessments of 44 health state values with EQ-5D, conducted in six European countries, including Spain, greater variability among individuals was recorded than among countries [28]. All costs used in the model were taken from Spanish sources [17–22].
TiC is given once in a lifetime. The long-term effects of diagnosis with TiC are due to implementation of preventive treatment in cases of thrombophilia. As in the study performed by Compagni et al. [10], we consider that the annual risks of complications (VTE, PE, death due to VTE or PE), annual costs and annual utilities remain constant throughout the simulation. This simplification was necessary because there are no data on the diagnostic effectiveness of TiC and SM for age ranges. This is a weakness of the model.
It should be noted that the differences observed in favour of TiC in QALYs in a lifelong simulation were greater (0.3288 in S. PAU and 0.1087 in MARTHA) than what is normally considered a minimum clinically relevant difference in the utility value of two treatments or health interventions observed with the EQ-5D, HUI2, HUI3 and SF-6D instruments (QALYs of 0.074, 0.030, 0.030 and 0.033, respectively) [29–32].
The results of the model were very stable, with probabilities of obtaining an ICER of less than EUR 30,000 per QALY gained in 100 % of the simulations in both populations.
Of the 21,367 patients recruited into RIETE [3, 7, 12] 12,740 (60 %) fulfilled one or more criteria for thrombophilia testing. However, only 3,618 patients were tested (28 %), with 34 % of them being positive. This reveals reduced follow-up with respect to current recommendations [33].
The results are different in both populations because of the differences in the inclusion criteria. In MARTHA, the cases and controls showed abundant FVL and PT mutations. Therefore, the S. PAU participants constitute a better representation of the general Caucasian population and are the basis of our study, while the MARTHA population is a more appropriate sample for evaluating the role of the new genetic markers in subjects with overrepresented FVL and PT mutations [8].
In assessing a new predictive method for inclusion in service portfolios, health systems follow recommendations such as those published by the American Heart Association for new cardiovascular risk markers [34]. In this assessment, the discrimination (C-index), incremental value (how the new method adds predictive information to established methods), clinical utility (whether the new method changes the predicted risk sufficiently to change the recommended therapy), clinical outcomes (whether the new method improves clinical outcomes) and, finally, the cost effectiveness are key elements.
TiC [8] demonstrated clear superiority versus FVL and PT in discrimination capacity, incremental value, clinical utility and theoretical clinical outcomes, as shown in this paper, in a cost-effective manner. This superiority was demonstrated despite the fact that not all of its potential was assessed, since only the genetic component was considered and TiC is an algorithm that combines genetic information with clinical data. Unfortunately, the necessary retrospective clinical data are not available for the two populations studied (MARTHA and S. PAU). Clinical information is extremely important for correct prediction, because many subjects will have genetic variations of thrombophilia but, depending on the risk load, VTE will develop only with the necessary coexistence of some clinical–environmental–prothrombotic factors. In this respect, the inclusion of clinical data will improve the predictive capacity of TiC.
Conclusion
The better characterization of VTE risk with TiC may enable the most appropriate preventive strategy to be established (preventing risk factors or recommending anticoagulant therapy as long as the predisposing clinical–environmental factors exist) [3]. These preventive measures could potentially have a considerable impact on the morbidity and mortality rates of thousands of patients. Thanks to its better predictive capacity, TiC solves the main problem of the current evaluation method (FVL and PF determination)—namely, its lack of clinical sensitivity (the existence of one of these two markers is shown only in 20 % of VTE cases), which suggests that analysing the presence of FVL and PT is not cost effective in patients with a family history or clinical history of VTE [10, 35]. Although the cost-effectiveness findings presented in this paper are derived from an economic model, appropriate use of tools such as TiC should be promoted for reasons of high clinical sensitivity and better predictive capacity [8], which may make a very significant and cost-effective contribution to preventing thromboembolic diseases.
Acknowledgments
The authors acknowledge J. Vila and R. Elosua from Grupo de Epidemiología y Genética Cardiovascular, IMIM (Institut Hospital del Mar d’Investigacions Mèdiques), Barcelona, Spain, for fruitful discussion of the results.
Conflicts of interest
C. Rubio-Terrés and D. Rubio-Rodríguez received an honorarium from Ferrer inCode in connection with the development of this manuscript. J. Sala and A. Gracia were employees of Ferrer inCode at the time of preparing the manuscript. S. Pich and E. Salas were employees of Gendiag.exe at the time of preparing the manuscript. The remaining authors have no conflicts of interest.
Author contributions
C. Rubio-Terrés and D. Rubio-Rodríguez created the economic model. C. Rubio-Terrés, D. Rubio-Rodríguez and E. Salas wrote the first and subsequent versions of this manuscript. All authors contributed to fruitful discussion of the results and to review of the different versions of the manuscript. C. Rubio-Terrés is the guarantor of the overall content of the manuscript.
References
- 1.Simpson EL, Stevenson MD, Rawdin A, Papaioannou D. Thrombophilia testing in people with venous thromboembolism: systematic review and cost-effectiveness analysis. Health Technol Assess. 2009;13:1–91. doi: 10.3310/hta13020. [DOI] [PubMed] [Google Scholar]
- 2.Gadelha T, Roldán V, Lecumberri R, Trujillo-Santos J, del Campo R, Poggio R, RIETE Investigators Clinical characteristics of patients with factor V Leiden or prothrombin G20210A and a first event of venous thromboembolism. Findings from the RIETE Registry. Thrombosis Res. 2010;126:283–286. doi: 10.1016/j.thromres.2010.06.019. [DOI] [PubMed] [Google Scholar]
- 3.Roldán V, Lecumberri R, Sánchez JF, Vicente V, Roche E, Brenner V, RIETE Investigators Thrombophilia testing in patients with venous thromboembolism. Findings from the RIETE Registry. Thrombosis Res. 2009;124:174–177. doi: 10.1016/j.thromres.2008.11.003. [DOI] [PubMed] [Google Scholar]
- 4.Thachil J. A practical approach to thrombophilia testing. Br J Hosp Med (Lond). 2013;74:C94–C96. doi: 10.12968/hmed.2013.74.Sup6.C94. [DOI] [PubMed] [Google Scholar]
- 5.National Institute for Health and Clinical Excellence . Venous thromboembolic diseases: the management of venous thromboembolic diseases and the role of thrombophilia testing. London: National Clinical Guidelines Centre; 2012. [PubMed] [Google Scholar]
- 6.Grupo Multidisciplinar para el Estudio de la Enfermedad Tromboembólica en España . Estudio sobre la enfermedad tromboembólica venosa en España. Madrid: Sociedad Española de, Medicina Interna; 2006. [Google Scholar]
- 7.Cohen AT. Long-term benefits of preventing venous thromboembolic events. Curr Med Res Opin. 2012;28:877–889. doi: 10.1185/03007995.2012.688737. [DOI] [PubMed] [Google Scholar]
- 8.Soria JM, Morange P-E, Vila J, Souto JC, Moyano M, Trégouët D-A, Mateo J, Saut N, Salas E, Elosua R. Multilocus genetic risk scores for thromboembolism risk assessment. Archive Ferrer inCode/Gendiag. 2014. [DOI] [PMC free article] [PubMed]
- 9.Real Decreto-ley 16/2012, de 20 de abril, de medidas urgentes para garantizar la sostenibilidad del Sistema Nacional de Salud y mejorar la calidad y seguridad de sus prestaciones. B.O.E. Nº 98, 24 de abril de 2012, 31278.
- 10.Compagni A, Melegaro A, Tarricone R. Genetic screening for the predisposition to venous thromboembolism: a cost-utility analysis of clinical practice in the Italian health care system. Value Health. 2013;16:909–921. doi: 10.1016/j.jval.2013.05.003. [DOI] [PubMed] [Google Scholar]
- 11.Tirado I, Soria JM, Mateo J, Oliver A, Souto JC, Santamaria A, et al. Association after linkage analysis indicates that homozygosity for the 46C>T polymorphism in the F12 gene is a genetic risk factor for venous thrombosis. Thromb Haemost. 2004;91:899–904. doi: 10.1160/TH03-10-0620. [DOI] [PubMed] [Google Scholar]
- 12.Trégouët DA, Heath S, Saut N, et al. Common susceptibility alleles are unlikely to contribute as strongly as the FV and AB0 loci to VTE risk: results from a GWAS approach. Blood. 2009;113:5298–5303. doi: 10.1182/blood-2008-11-190389. [DOI] [PubMed] [Google Scholar]
- 13.Instituto Nacional de Estadística. Esperanza de vida, esperanza de vida en buena salud y esperanza de vida libre de discapacidad a distintas edades. INE, 2012. Available from: http://www.ine.es. Accessed 2 May 2012.
- 14.Schulman S, Rhedin AS, Lindmarker P, Carlsson A, Lärfars G, Nicol P, Duration of Anticoagulation Trial Study Group A comparison of six weeks with six months of oral anticoagulant therapy after a first episode of venous thromboembolism. N Engl J Med. 1995;332:1661–1665. doi: 10.1056/NEJM199506223322501. [DOI] [PubMed] [Google Scholar]
- 15.Nieto JA, Solano R, Ruiz-Ribó MD, Ruiz-Gimenez N, Prandoni P, Kearon C, Monreal M, RIETE Investigators Fatal bleeding in patients receiving anticoagulant therapy for venous thromboembolism: findings from the RIETE Registry. J Thromb Haemost. 2010;8:1216–1222. doi: 10.1111/j.1538-7836.2010.03852.x. [DOI] [PubMed] [Google Scholar]
- 16.Greving JP, Visseren FLJ, de Wit GA, Algra A. Statin treatment for primary prevention of vascular disease: whom to treat? Cost-effectiveness analysis. BMJ. 2011;342:d1672. doi: 10.1136/bmj.d1672. [DOI] [PubMed] [Google Scholar]
- 17.Maestre A, Sánchez R, Rosa V, Aujesky D, Lorenzo A, Barillari G, Monreal M, RIETE Investigators Clinical characteristics and outcome of inpatients versus outpatients with venous thromboembolism: findings from the RIETE Registry. Eur J Intern Med. 2010;21:377–382. doi: 10.1016/j.ejim.2010.07.004. [DOI] [PubMed] [Google Scholar]
- 18.Base de Datos de Costes Sanitarios. GRD: precios públicos de las comunidades autónomas. Versión 4.3. Madrid: Health Value; 2013.
- 19.Comunidad Valenciana. Ley 9/2011, de 26 de diciembre, de Medidas Fiscales, de Gestión Administrativa y Financiera, y de Organización de la Generalitat. Boletín Oficial del Estado 2012; Nº 23, viernes 27 de enero de 2012, 7321.
- 20.Dabigatrán etexilato (Pradaxa®) en la prevención de complicaciones tromboembólicas en pacientes con fibrilación auricular no valvular con riesgo de ictus Informe del Grupo GÉNESIS de la SEFH. 2011.
- 21.De Solà-Morales O, Elorza JM. Coagulómetros portátiles. Revisión de la evidencia científica y evaluación económica de su uso en el autocontrol del tratamiento anticoagulante oral. Barcelona: Agència d’Avaluació de Tecnologia i Recerca Mèdiques. CatSalut. Departament de Sanitat i Seguretat Social. Generalitat de Catalunya; 2003.
- 22.Monreal M, González-Rojas N, Vieta A, Wolowacz SE. Análisis económico de dabigatrán etexilato en prevención primaria del tromboembolismo venoso tras artroplastia de cadera o rodilla. PharmacoEconomics Spa Res Art. 2009;6:126–145. doi: 10.1007/BF03320860. [DOI] [Google Scholar]
- 23.Venous thromboembolism: reducing the risk of venous thromboembolism (deep vein thrombosis and pulmonary embolism) in inpatients undergoing surgery. London: National Collaborating Centre for Acute Care; 2007. [DOI] [PMC free article] [PubMed]
- 24.Rubio-Terrés C, Cobo E, Sacristán JA, Prieto L, del Llano J, Badia X, por el Grupo ECOMED Análisis de la incertidumbre en las evaluaciones económicas de intervenciones sanitarias. Med Clin (Barc) 2004;122:668–674. doi: 10.1016/S0025-7753(04)74346-8. [DOI] [PubMed] [Google Scholar]
- 25.Briggs A, Claxton K, Sculpher M. Decision modelling for health economic evaluation. Oxford: Oxford University Press; 2006. [Google Scholar]
- 26.TreeAge Pro Healthcare Module 2009. Williamstown: TreeAge Software Inc.; 2009.
- 27.Sacristán JA, Oliva J, Del Llano J, Prieto L, Pinto JL. ¿Qué es una tecnología eficiente en España? Gac Sanit. 2002;16:334–343. doi: 10.1016/S0213-9111(02)71933-X. [DOI] [PubMed] [Google Scholar]
- 28.Greiner W, Weiinen T, Nieuwenhuizen M, Oppe S, et al. A single European currency for EQ-5D health states. Results from a six-country study. Eur J Health Econ. 2003;4:222–231. doi: 10.1007/s10198-003-0182-5. [DOI] [PubMed] [Google Scholar]
- 29.Brazier J, Roberts J, Tsuchiya A, Busschbach J. A comparison of the EQ-5D and SF-6D across seven patient groups. Health Econ. 2004;13:873–884. doi: 10.1002/hec.866. [DOI] [PubMed] [Google Scholar]
- 30.Horsman J, Furlong W, Feeny D, Torrance G. The Health Utilities Index (HUI®): concepts, measurement properties and applications. Health Qual Life Outcomes. 2003;1:54. doi: 10.1186/1477-7525-1-54. [DOI] [PMC free article] [PubMed] [Google Scholar]
- 31.Walters SJ, Brazier JE. What is the relationship between the minimally important difference and health state utility values? The case of the SF-6D. Health Qual Life Outcomes. 2003;1:4. doi: 10.1186/1477-7525-1-4. [DOI] [PMC free article] [PubMed] [Google Scholar]
- 32.Wee H-L, Machin D, Loke W-C, Li S-C, Cheung Y-B, Luo N, et al. Assessing differences in utility scores: a comparison of four widely used preference-based instruments. Value Health. 2007;10:256–265. doi: 10.1111/j.1524-4733.2007.00174.x. [DOI] [PubMed] [Google Scholar]
- 33.Nicolaides AN, Breddin HK, Carpentier P, Coccheri S, Conard J, De Stefano V, et al. Thrombophilia and venous thromboembolism: international consensus statement. Guidelines according to scientific evidence. Int Angiol. 2005;24:1–26. doi: 10.1177/00033197050560i101. [DOI] [PubMed] [Google Scholar]
- 34.Hlatky MA, Greenland P, Amett DK, et al. Criteria for evaluation of novel markers of cardiovascular risk. A scientific statement from the American Heart Association. Circulation. 2009;119:2408–2416. doi: 10.1161/CIRCULATIONAHA.109.192278. [DOI] [PMC free article] [PubMed] [Google Scholar]
- 35.Segal JB, Brotman DJ, Emadi A, et al. Outcomes of genetic testing in adults with a history of venous thromboembolism. Evid Rep Technol Assess. 2009;180:1–162. [PMC free article] [PubMed] [Google Scholar]