

Abstract
Objective
The present study was designed to test for neural signs of impulsivity related to voice motor control in young adults with ADHD and healthy control young adults using EEG recordings in a voice pitch perturbation paradigm.
Methods
Two age-matched groups of young adults were presented with brief pitch shifts of auditory feedback during vocalization. Compensatory behavioral and corresponding bioelectrical brain responses were elicited by the pitch-shifted voice feedback.
Results
The analysis of bioelectrical responses showed that the ADHD group had shorter peak and onset latency of motor-related bioelectrical brain responses as compared to the controls.
Conclusions
These results were interpreted to suggest differences in executive functions between ADHD and control participants.
Significance
We hypothesize that more rapid motor-related bioelectrical responses found in the present study may be a manifestation of impulsiveness in adults with ADHD at the involuntary level of voice control.
Keywords: ADHD, voice control, ERP, executive functions, impulsiveness
Introduction
Adult Attention-Deficit/Hyperactivity Disorder (ADHD) is highly prevalent (4.4% in the USA (Kessler et al., 2006)). In children, ADHD has been found to interfere with many aspects of development including social, emotional, and academic activities, and if left untreated, it predisposes children to a greater risk of psychiatric and social pathology and criminality later in life (Mannuzza et al., 2008). In various neurobiological models, ADHD is often conceptualized as a disorder of the prefrontal cortex (Himelstein et al., 2000) and is generally diagnosed based on behavioral assessments. Event related potentials (ERPs) recorded from adults with ADHD also revealed differences in the ERP responses to auditory and visual stimuli when compared to control participants (Prox et al., 2007; Barry et al., 2009; Sable et al., 2013). The constellation of behavioral and sensory processing abnormalities suggest that more generalized sensory-motor processing deficits may underlie symptoms such as motor overactivity and inattention observed in individuals with ADHD (Himelstein, et al., 2000). ADHD is also associated with a deficiency in executive function (Barkley, 1997; Tripp and Wickens, 2009), defined by Luria (Luria, 1973) as those functions that are involved in the planning, regulation, and verification of an action. Impulsiveness that is considered a form of executive function deficiency (Brower and Price, 2001), is a key characteristic of persons with ADHD (for review see: Sagvolden and Sergeant, 1998; Rubia et al., 2009) and can play a significant role in explaining differences between ADHD subtypes (Miller et al., 2010). In this context it is reasonable to hypothesize that aberrant brain activity associated with impulsivity should be manifested in motor control-related bioelectrical brain responses.
Currently there is no single universally accepted definition of impulsivity, and the primary methods for impulsivity assessments are self-report measures and laboratory-behavioral tasks (Weiser and Reynolds, 2011). Recent studies in healthy subjects (Cools et al., 2007; Buckholtz et al., 2010) demonstrated that impulsiveness is implicated in dopamine signaling. Since it has been shown that the dopamine neuromodulatory system influences information processing in prefrontal cortex in time scales from seconds to hours (Lapish et al., 2007), it is reasonable to suggest that the same elements of dopamine metabolism might be associated with impulsiveness as a personality trait and with rapid, unplanned, impulsive reactions to stimuli. It was also shown that metabolism of dopamine is involved in control of speed and direction of motor commands (Freed and Yamamoto, 1985). Therefore, we hypothesize that in ADHD subjects, impulsiveness, as a feature of brain activity, should be manifested not only at the level of voluntary motor reactions but also at the level of basic involuntary motor reflexes.
In order to test this hypothesis, we used a voice pitch shift perturbation paradigm (Figure 1A) wherein vocal motor responses are automatically elicited to compensate for pitch-shifted voice auditory feedback (Burnett et al., 1998, Kawahara, 1994). The pitch shift paradigm and the ensuing vocal responses have also been shown to elicit well-documented patterns of ERPs (Behroozmand et al., 2009; Liu et al., 2011; Behroozmand et al., 2011a; Behroozmand and Larson, 2011b; Korzyukov et al., 2012a; Korzyukov et al., 2012b) that have been routinely recorded in numerous auditory ERP studies (Burkard et al., 2007). It is very likely that neuronal generators underlying conventionally recorded auditory ERPs are involved in the generation of the P50-N1-P2 responses elicited by pitch shift perturbations (PSPs), since the stimulus for the motor responses is a change in fundamental frequency (F0) of voice auditory feedback. However in contrast to conventional auditory ERP studies, the P50-N1-P2 components in the pitch perturbation paradigm are recorded when a participant is vocalizing, i.e. performing a complex, goal-oriented motor act in addition to hearing their own voice auditory feedback. Thus, the dynamic contribution of neuronal activity underlying vocal-related motor activity elicited by PSPs is likely to affect the ERP components. Since we hypothesize that impulsivity related aberrant brain activity should be associated with vocal-related motor activity, the removal or reduction of auditory processing-related neuronal activity in the ERP data is needed in order to reveal impulsivity-related motor activity, which would then allow for the analysis of the motor-related neural responses characterizing ADHD. This can be achieved by the subtraction of the ERP responses to PSPs that are elicited primarily by auditory processing from the ERP to PSPs that incorporate both vocal and motor-related neuronal processing activity.
Figure 1.

Voice perturbation paradigm and behavioral study results. (A) Schematic illustration of study design and perturbation stimuli. (B) Schematic representation of the logic behind the calculation of the ERP difference waveforms. As discussed in the text, 100 cent stimuli trigger both sensory and motor processing as illustrated by the top (Auditory processing brain activity) and bottom curves (Motor vocal control brain activity). Four hundred cents stimuli trigger only sensory processing mechanisms with no, or very little, motor processing. When the ERP response to the 400 cents stimulus is subtracted from that of the 100 cents stimulus, a Difference Wave results. This Difference Wave reflects motor neural processes inherent to the 100 cents stimulus but not the 400 cents stimulus.
ERPs triggered by PSPs may reflect both auditory-sensory and motor processing mechanisms. The stimulus is an acoustical change in the subject’s voice auditory feedback, which triggers a vocal motor response. It is important to note that after the onset of vocalization, a small shift in voice pitch auditory feedback (100 cents, equal to a change in frequency of 6 Hz for a voice F0 of 100 Hz) is perceived as an error in the subject’s own voice, and sensory-motor feedback circuitry generates a motor response to correct for the error in feedback (Hawco et al., 2009, Liu, et al., 2011, Scheerer et al., 2013). On the other hand, because relatively large shifts (400 cents in our study) in voice pitch feedback are not recognized as the subject’s own voice, a very small response, or no response is elicited to correct for the error from such stimuli. Along with behavioral responses, ERP studies (Behroozmand, et al., 2009, Liu, et al., 2011; Behroozmand and Larson, 2011b) also demonstrated that large pitch shifts (e.g., 400 cents) elicit ERPs primarily reflecting sensory processing with very little motor processing.
In general, during a variety of self-initiated motor acts ranging from self-vocalization to button press, auditory-motor interaction results in suppression of auditory cortex activity via projections originating from the motor cortex (Curio et al., 2000; Ford et al., 2001; Houde et al., 2002; Heinks-Maldonado et al., 2005; Aliu et al., 2009; Greenlee et al., 2011; Behroozmand and Larson, 2011b; Chang et al., 2013; Hughes et al., 2013; SanMiguel et al., 2013; Timm et al., 2013). In this regard, it is important to note that while auditory activity during active vocalization is suppressed, the motor cortex responses to PSPs should be enhanced in order to generate a corrective motor command for the muscles of larynx (Chang, et al., 2013).
In terms of the internal forward model of motor control (Wolpert and Miall, 1996; Wolpert and Flanagan, 2001; Franklin and Wolpert, 2011), suppression of auditory cortex activity was interpreted to mean that an “efference copy” (or corollary discharge) of the intended vocal output suppresses neural activity related to auditory processing of a subject’s own vocal feedback signal. This attenuation of auditory sensory activity is considered as a manifestation of the mechanism enabling discrimination between one’s own actions and those resulting from actions of others (Blakemore et al., 2000; Hawco, et al., 2009; Behroozmand and Larson, 2011b). This conjecture is supported by the study of neural recordings from the auditory cortex in monkeys showing that neurons normally suppressed during vocalization become more responsive in the presence of pitch-shifted voice feedback (Eliades and Wang, 2008).
All these studies strongly suggest that (i) while auditory processing might operate without motor-related neuronal activity during passive listening, during active self-vocalization vocal control-related motor activity always co-exists with self-vocalization-related fractions of auditory processing; (ii) self-vocalization-related fractions of auditory cortex activity are suppressed as compared to passive listening-related auditory processing; (iii) since auditory processing and motor-related neuronal activity occur simultaneously during vocalization, it is very likely that their bioelectrical indexes mask each other. To separate the auditory sensory from the motor control processes inherent in the ERPs as subjects listens to PSPs, we propose an ERP subtraction technique that results in a Difference Wave that consists primarily of the motor processing mechanisms involved in the pitch-shift reflex (see Fig 1B). The Difference Wave is calculated by subtracting the ERP triggered by a large PSP (400 cents) that does not contain a motor component (see above), from the ERP triggered by a small PSP (100 cents) that does contain a motor component. The result of this subtraction is a difference in brain activity that primarily reflects the motor processing resulting from the small PSP. In addition, at least a portion of the auditory processing of both these stimuli should be similar (see Figure 1B, label: “Non-specific”). The elimination of this portion by the subtraction procedure reduces the presence of auditory processing related neuronal activity in the Difference Wave, making the motor control neuronal activity reflected by the Difference Wave more prominent.
A recent study (Choi J.E. et al., 2014) of eye movement control provided empirical support for the notion that even in healthy people more impulsive individuals in general move faster than individuals who are less impulsive. We therefore hypothesize that impulsivity related features of brain activity might be manifested in reflexive motor control actions. Thus, the ERP Difference Wave can serve as an index of primarily motor-related fractions of brain activity and was the focus of the present study as a potential index of impulsivity-related aberrations in adults with ADHD.
Methods
All participants were recruited from advertisements posted around the Northwestern University campus. The control group consisted of native speakers of American English (6 females and 3 males; mean age: 22.3 years and SD: 4.42) with no history of hearing, speech, or neurological disorders, and no history of vocal training. The clinical sample included nine native speakers of American English (6 females and 3 males; mean age: 22.3 years and SD= 4.84) who had no history of hearing, speech, or neurological disorders or vocal training and self-reported having ADHD. All of the participants with ADHD were taking medication, five participants were taking Adderoll, two took Wellbutrin, two took Strattera, one took Guanfacine, one took Vyanse, one took Methylphenidate and one took Lamictal. Three of the participants took a combination of two or more medications. Participants were asked to refrain from taking medication for 24 hours before testing, however due to their everyday activity several subjects were able to refrain from medication for less than 24. Nevertheless all these participants refrained from medication for at least 12 hours before testing. Since the duration of action for the medications are not more than 12 hours (for example Adderall, see Sallee and Smirnoff, 2004; Weisler 2005), it was considered that this duration was sufficiently long and these participants were enrolled in to the study.
These participants were subsequently administered the Adult ADHD Self-Report Scale-v1.1 (ASRS-v1.1) before final inclusion in the study (American Psychiatric Association. Task Force on DSM-IV., 2000). The ADHD ASRS-v1.1 was developed by the World Health Organization in conjunction with the Workgroup on adult ADHD based on the criteria for ADHD from the DSM-IV-TR (Murphy and Adler, 2004, Rosler et al., 2010). The ASRS-v1.1 is an 18-item scale that measures the frequency of symptoms (0=never, 1=rarely, 2=sometimes, 3=often, 4=very often). It consists of six screener questions that were found to be the most predictive of symptoms consistent with ADHD, where a score of greater than 4 is highly consistent with an ADHD diagnosis (Kessler et al., 2005). The ASRS-v1.1 also has a two-factorial structure with an impulsivity scale and inattentive scale. If the sum score of both scales is less than 34, a participant is unlikely to have ADHD, if there is a score of 34 to 47, the participant is likely to have ADHD, and a score of 48 and above indicates the participant is highly likely to have ADHD (Stark et al., 2011). The inclusion criteria for the ADHD participants in the present study were a score of >4 on the 6 screener questions and a total score of ≥34. All nine adult ADHD participants in the present study had scores within the 34–48 range.
All study procedures, including recruitment, data acquisition, and informed consent, were approved by the Northwestern University Institutional Review Board, and participants were monetarily compensated for their participation. Written informed consent was received from all participants. All participants passed a bilateral, pure-tone, hearing screening at 20 dB SPL (octave frequencies between 250–8000 Hz).
During the test, participants were seated in a sound-attenuated booth. They were instructed to vocalize and sustain the vowel /a/ for approximately 3–4 seconds at their conversational pitch and loudness levels at their own pace, i.e., without a cue. Participants were informed that their voice would be played back to them during their vocalizations, and they were asked to ignore any shifts in pitch in the feedback of their voice. Testing was performed in one block of trials, which resulted in between 100 and 150 vocalizations. During each vocalization, one PSP (+100 or +400 cents, 200 ms duration) was presented. The PSP magnitude was randomized between trials. PSPs were presented at a variable time (1000 – 1500 ms) after the onset of vocalization. Participants typically paused for 2–3 sec between vocalizations to take a breath. While they were vocalizing, participants watched several static pictures that changed every 30 sec.
Participants’ voices were recorded with an AKG boomset microphone (model C420), amplified with a Mackie mixer (model 1202-VLZ3), and pitch-shifted through an Eventide Eclipse Harmonizer. The time delay from vocal onset, the duration, direction, and magnitude of pitch shifts were controlled by MIDI software (Max/MSP v.5.0 Cycling 74). Voice and auditory feedback were sampled at 10 kHz using PowerLab A/D Converter (Model ML880, AD Instruments) and recorded onto a laboratory computer with Chart software (AD Instruments). Participants maintained their conversational F0 levels and voice loudness at approximately 70–75 dB SPL. The feedback signal (i.e., the participant’s pitch-shifted voice) was delivered through Etymotic earphones (model ER1-14A) at about 80–85 dB. The 10 dB gain in the feedback channel relative to vocal output (controlled by a Crown amplifier D75) was used to partially mask air-born and bone-conducted voice feedback.
The EEG signals were recorded from 64 sites on the participant’s scalp using an Ag-AgCl electrode cap (EasyCap GmbH, Germany) in accordance with the extended international 10–20 system (Oostenveld and Praamstra, 2001) including left and right mastoids. Recordings were made using the average reference montage, in which outputs of all of the amplifiers are averaged and used as the common reference for each channel. Scalp-recorded brain potentials were low-pass filtered with a 400-Hz cut-off frequency (anti-aliasing filter), digitized at 2 kHz, and recorded using a BrainVision QuickAmp amplifier (Brain Products GmbH, Germany). Electrode impedances were kept below 5 kΩ for all channels. The electro-oculogram (EOG) signals were recorded using two pairs of bipolar electrodes placed above and below the right eye to monitor vertical eye movements and at the canthus of each eye to monitor horizontal eye movements.
The voice and feedback signals were first processed in a software package for the analysis of speech in phonetics, Pratt (Boersma, 2001), to obtain the F0 contours. After that the F0 contours along with TTL pulses corresponding to the stimulus onset and magnitude were processed in IGOR PRO (Wavemetrics, Lake Oswego, OR) data analysis software for numerical computation of time series analysis. The vocal F0 responses to 100 cents and 400 cents shifts were averaged separately across a 600 ms window from 100 ms before the shift to 500 ms after the shift, for each individual participant and then grand-averaged across participants (Figure 2).
Figure 2.
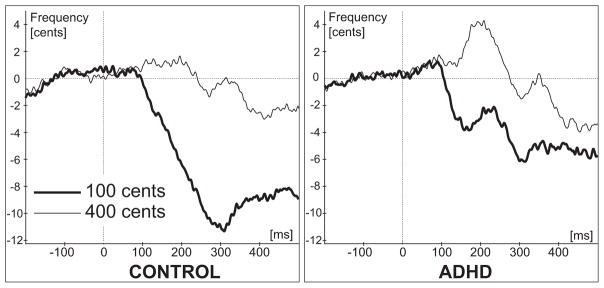
Behavioral (voice) results. Grand-averaged F0 traces across all participants separately for “100 cents” and “400 cents” stimuli. Vertical dashed lines represent pitch shift stimuli onset.
The recorded EEG signals were filtered offline using a band-pass filter with cut-off frequencies set to 1 Hz and 50 Hz (48 dB/oct) and then segmented into epochs ranging from 100 ms before and 400 ms after the onset of the pitch shift. Epochs with EEG or EOG amplitudes exceeding 75 μV were removed from data analysis. At least 80 epochs were averaged for ERP calculation for all participants. Separate ERP averages were made for 100 and 400 cents stimuli. Since we hypothesized that bioelectrical responses associated with impulsivity should be more rapid and related to impulsive motor reactions to stimuli, the latency of the N1 ERP components (as the earliest of the most prominent components) were extracted by finding the negative peak within the selected window based upon time-alignment with the grand-averaged responses in order to accommodate the entire range of N1 latency variation.
Since, as explained above, the N1 ERP component recorded from the scalp is a result of overlapping activity of auditory and motor functions, the Difference Wave was calculated for each participant and electrode site by subtracting the ERP to the 400 cents stimuli from the ERP to the 100 cents stimuli for better isolation of impulsivity-related motor activity. A grand average of the Difference Waves was then calculated for each electrode across the two participant groups, resulting in one set of Difference Waves for the ADHD group and one set for the control group. Based on visual inspection of the Difference Waves, the most prominent peaks and their scalp distribution were identified. The peak latencies and amplitudes were measured for each individual participant’s data within the window centered over the peak identified from the grand average data. The length of this window was also determined based on the duration of the grand average response in order to accommodate the entire range of the Difference Wave peak latencies across all subjects. The automated peak detection procedure within this time window was applied for each individual participant’s data measurements. The N1 and Difference Wave measurements were analyzed with a three-way Analysis of Variance (ANOVA; General-Linear model, Repeated Measures) with the following factors: Group (ADHD, Control), Frontality (rows of electrodes from anterior to posterior), and Laterality (rows of electrodes from left to right).
Results
Visual inspection of the grand-averaged F0 contours revealed that compensatory F0 responses to 100 cents pitch-shifts were larger than the responses to 400 cents shifts for both the ADHD and control group. For the control group the F0 contour maximum reached a peak around 310 ms (Figure 2). In the ADHD group the F0 contour of the responses to 100 cents had two peaks: first at latency around 165 ms and the second around 307 ms (Figure 2). The reduction in response magnitudes to the 400 cent stimuli reflect the fact that brain activity related to motor control of the voice is minimally affected by the 400 cents stimuli for both subject groups and hence the vocal responses are very small or non-existent in this condition.
As can be seen from the grand-averaged ERP data in Figure 3, the patterns of the P50-N1-P2 ERP responses for the 100 cents and 400 cents shifts in each group are similar to the waveforms reported in conventional auditory ERP studies (Burkard, et al., 2007). We studied the N1 response because we were interested in early neural indicators of rapid, impulsive reactions to stimuli. The amplitudes of N1 responses to 100 cents (15 electrodes; latency window: 128–178ms) and to 400 cents (20 electrodes; latency: 98–148ms) were measured in each individual subject. In order to assess between group differences we ran separate 3-way ANOVAs for 100 and 400 cents data with the following factors: Group (ADHD vs. Control); Frontality and Laterality. For mean amplitude of N1 to 100 cents stimuli, the results from ANOVA yielded a significant (F(1,16)=5.49, p=0.03) main effect of Group confirming that the mean amplitude of N1 to 100 cents stimuli is significantly larger in the ADHD group (mean: −1.84μV) as compared to the Control group (mean: −0.93μV). For the mean amplitude of N1 to 400 cents stimuli, the results from ANOVA did not yield any significant effect or interaction involving Group factor (main Group effect: F(1,16)=1.54, p=0.23) confirming that there is no significant difference in N1 amplitude between the ADHD group (mean: −1.36μV) and control group (mean: −1.83μV).
Figure 3.

Grand-averaged ERP waveforms from 3 representative electrodes and ERP scalp distribution of N1 response elicited by the 100 and 400 cents shift of the F0. All scalp distribution maps were calculated for the peak latency that is marked for the each map.
Since the N1 response to 100 and 400 cents stimuli was maximal over frontal-central electrodes for both groups of subjects (Figure 3) the peak amplitude and latency measures of N1 ERP responses were obtained from 15 electrodes in each subject and submitted for a between group statistical evaluation that was performed with a three-way ANOVA (factors: Group (ADHD vs Control); Frontality (Frontal electrodes: F3, F1, Fz, F2, F4, versus Fronto-central: FC3, FC1, FCz, FC2, FC4, versus Central: C3, C1, Cz, C2, C4), and Laterality (5 rows of electrodes from left to right)). The latency windows (95–205ms for 100 cents and 85–160ms for 400 cents stimuli) for automatic peak detection were chosen based on the duration of the N1 component in the grand-averaged ERP waveforms at midline frontal and central electrodes (Figure 3).
The N1 latency results from the ANOVA did not yield a significant (F(1,16)=0.23, p=0.63) main effect for the 100 cents (mean in ADHD group: 145ms, in Control: 149ms) or for 400 cents (main effect: F(1,16)=0.001, p=0.97; mean in ADHD group: 115ms, in Control: 115ms). The interaction effects involving Group factor were also not significant for the 100 cents (Frontality x Group: F(2,32)=2.99, p=0.06; Laterality x Group: F(4,64)=0.41, p=0.79 Frontality x Laterality x Group; F(8,128)=1.48, p=0.17) or for 400 cents (Frontality x Group: F(2,32)=0.08, p=0.92; Laterality x Group: F(4,64)=1.04, p=0.39; Frontality x Laterality x Group; F(8,128)=0.90, p=0.51). The ANOVA results for the N1 peak amplitude did not yield a significant (F(1,16)=3.02, p=0.1) main effect for the 100 cents (mean in ADHD group: −2.9μV, in Control: −2.1 μV) or for 400 cents (main effect: F(1,16)=2.34, p=0.15; mean in ADHD group: −3.66 μV, in Control: −2.76 μV). The interaction effects involving Group factor were also not significant for the 100 cents (Frontality x Group: F(2,32)=1.76, p=0.19; Laterality x Group: F(4,64)=1.53, p=0.2; Frontality x Laterality x Group; F(8,128)=0.58, p=0.79) or for 400 cents (Frontality x Group: F(2,32)=1.02, p=0.37; Laterality x Group: F(4,64)=0.93, p=0.45; Frontality x Laterality x Group; F(8,128)=0.95, p=0.48).
In order to evaluate the latency of motor-related bioelectrical activity, the Difference Waves between 100 cents and 400 cents stimuli were calculated by subtracting the ERP waveform to 400 cents stimuli from the ERP to the 100 cents stimuli (see Figures 4, 5). The measure of global field power (GFP) that quantifies the amount of bioelectrical activity at each time point in the data from all recording electrodes simultaneously was made. GFP constitutes a single, reference-independent global measure of response strength and latency. Mathematically, GFP equals the root mean square of ERP voltage across the average-referenced electrode values at a given instant in time (Lehmann and Skrandies, 1980; Murray et al., 2008). GFP was plotted (Figure 4B) as a function of time, and the times of GFP maxima were used to assess the latencies of bioelectrical activity (for review see: Skrandies, 1990). As can be seen in Figure 4B, the GFP of the Difference Waves reaches its maximum within the time range of 70–150 ms after stimulus onset (Figure 4B). The GFP estimate also indicates that global onset of brain activity reflected in the Difference Wave occurred earlier in the ADHD group as compared to Controls (marked by grey color at Figure 4B). Visual inspection of the Difference Wave scalp distribution suggests that the peak amplitudes of the Difference Wave were maximal at the frontal electrodes (Figure 4C). In order to avoid false positives in our evaluation of GFP, we statistically compared the Difference Wave amplitudes between groups using a Permutation Test (Greenblatt R.E. Pflieger M.E. 2004) that can detect significant signal strength differences between ADHD and healthy Control groups at each time slice. The Permutation Test used a latency window from 0 to 200 ms, and the obtained p-values were corrected for multiple comparisons across space (i.e., corrections were made across all EEG channels, but separately for each time slice). Using one hundred random permutations, p-values were obtained for each time slice (every 0.5 ms) for the case when the amplitude of the Difference Wave is greater for the ADHD group than for the Control group. As can be seen in Figure 5A, the p-values reach significance at p<0.05 during the 55–59 ms latency window (at electrode C3). The scalp distribution of these p-values (Figure 5A, see map) indicates that significant differences between groups were most prominent at the left fronto-central electrodes. This result provides statistical support for the GFP estimate that suggested earlier onset of global brain activity in the ADHD group as compared to Controls (see the gray region in Figure 4B). In summary, the Permutation Test confirmed that the Difference Wave amplitude is significantly greater (p<0.5) in the ADHD group versus the Control group for latencies around 55–59 ms (the time of GFP response onset) over the left fronto-central electrodes (Figure 5A).
Figure 4.

(A) Grand-averaged ERP waveforms from 3 representative electrodes elicited by the 100 and 400 cents shift of the F0. Left panel represents ERPs elicited in the group of control participants, right panel represents data in the ADHD group. (B) Global Field Power estimate of the Difference Wave calculated by subtracting the ERP waveform to the 400 cents stimuli from the ERP waveform to the 100 cents stimuli. Grey area represents difference in timing of global bioelectrical brain activity between ADHD and Control groups. (C) Scalp distribution maps of the Difference Wave calculated for the peak latency of the Global Field Power estimate.
Figure 5.

(A) p-values obtained from a Permutation Test of Difference Wave amplitude differences for the ADHD group versus the healthy Control group (ADHD > Control) for each 0.5 ms time slice. The Permutation Test generated one hundred random reassignments of individuals between the ADHD and the Control groups. The p-values obtained across latencies from 0 to 200 ms have been corrected for multiple comparisons across space (i.e., the corrections were made across all EEG channels, but separately for each time slice).
(B)Grand-averaged difference in ERP waveforms calculated by subtracting the ERP waveform to the 400 cents stimuli from the ERP waveform to the 100 cents stimuli in 9 representative electrodes for the ADHD and healthy controls. Timing of the onset of first Difference Wave deflection (latency window: 50–150ms) represented by 5 ms steps of the p-value indicating significant difference of the Difference Wave amplitude from zero. Red color represents data from the adults with ADHD, black – healthy controls. Vertical bars represent two categories of p-values: p<0.01 or p<0.05.
In order to statistically validate the possible differences between group timing in the GFP measures of the responses, the peak amplitude and latency of the Difference Waves within the 70–150 ms time window were measured from the individual participant’s data from 21 electrodes centered over the fronto-central scalp areas. Results from a three-way ANOVA (factors: Group (ADHD vs Control); Frontality (Frontal electrodes: F5, F3, F1, Fz, F2, F4, F6 versus Fronto-central: FC5, FC3, FC1, FCz, FC2, FC4, FC6 versus Central: C5, C3, C1, Cz, C2, C4, C6) and Laterality (7 levels from left to right)) of the latency data yielded a significant main effect of group (F(1,16)=5.89, p=0.03), confirming the observation that the peak latency of the Difference Wave in the ADHD group (mean: 100 ms) was significantly shorter than in the Control group (mean: 114 ms). There were no significant group differences in the ANOVA of peak amplitudes.
Since GFP measures of the Difference Wave suggested between group differences in timing of the onset of bioelectrical activity, we analyzed the onset time of the Difference Wave response across 15 electrodes. The mean amplitudes of the Difference Wave waveforms were measured sequentially in 5 ms steps across a 50–150 ms latency window in each subject from 15 electrodes that were used for the N1 analysis. Each measure was statistically compared against zero with the most conservative (nonparametric; very few assumptions) Sign Test. The obtained results represent step-by-step dynamic changes of the p-value (only two categorical values were used: p<0.01 or p<0.05) that indicate the time when the amplitude of the Difference Wave significantly differs from zero. As can be clearly seen from Figure 5 in electrodes F3, F1, FC3, FC1, C3, C1 the timing of the of the onset of the Difference Wave is at least 10–15 ms earlier (Figure 5, see latency window: 50–100ms) in adults with ADHD as compared to healthy controls. Data from electrodes Fz and Fcz exhibit the same tendency, but less prominently.
In order to statistically validate results of the onset time revealed by the Sign Test (Figure 6, see latency window: 50–100ms) the sequential measurements of the mean amplitude at each of 9 electrodes (F3, F1, Fz, FC3, FC1, FCz C3, C1, Cz) were subjected to 1-way ANOVA with factor: Time (10 levels, one per 5 ms time interval across 50–100ms latency window). Since GFP estimates (Figure 4B, latency window: 50–100ms) suggested the onset of bioelectrical activity occurred after 65 ms, the mean amplitudes across 50–60 ms were used as a baseline measure of bioelectrical activity against which a statistically significant increase of mean amplitude values was interpreted as the onset of bioelectrical activity. The Bonferroni Test was used to perform post-hoc comparisons between all 10 of these mean amplitude measures. ANOVA results confirmed that there was a significant (p<0.05) effect of Time in 7 of 8 electrodes subjected to analyses.
Figure 6.

Results of statistical evaluation of the onset of the first Difference Wave deflection (latency window: 50–100ms). Results of 1-way ANOVA for each electrode are presented on 18 corresponding sections of the illustration. Vertical columns represent mean amplitudes of the Difference Wave measured for each of 5 ms consecutive time intervals within the time range of the onset of the Difference Wave (latency window: 50–100ms). Mean amplitudes across 50–60 ms (marked with green color) were chosen as a baseline measures of the bioelectrical activity against which statistically significant differences of mean amplitude values were tested with the Bonferroni post-hoc Test in order to statistically determine time of the Difference Wave onset. Red color indicates time intervals at which the mean amplitude of the Difference Wave was significantly (p<0.05) different from both baseline (green) time intervals (50–55ms and 55–60ms). In three cases when significance was found only for the 50–55ms interval, the exact p-values for non-significant differences are presented for the corresponding cases. If baseline time interval(s) was (were) not significantly different from any other time intervals they were not labeled with green color. Whisker plots represent standard error of mean.
The timing of the Permutation Test of Difference Wave differences, the timing of the Sign Test of the Difference Wave difference from zero, and the Bonferroni post-hoc test of the Difference Wave onset timing all strongly support ANOVA results confirming that the peak latency of the Difference Wave in the ADHD group (mean: 100.2 ms) was significantly shorter than in the Control group (mean: 114.1 ms).
The effect sizes for the peak latencies for the 9 electrodes on which the between group timing difference was most prominent were the following: F3, Cohen’s d = 1.24 (large), Confidence Interval for Effect Size (CI): lower = −2.18, upper = −0.18; F1, Cohen’s d = 0.8 (medium), CI: lower = −1.72, upper = 0.2; Fz, Cohen’s d = 0.43 (small), CI: lower = −1.34, upper = 0.52; FC3, Cohen’s d = 1.72 (very large), CI: lower = −2.71, upper = −0.57; FC1, Cohen’s d = 0.77 (medium), CI: lower = −1.69, upper = 0.22; FCz, Cohen’s d = 0.54 (medium), CI: lower = −1.46, upper = 0.42; C3, Cohen’s d = 1.05 (large), CI: lower = −1.99, upper = −0.02; C1, Cohen’s d = 0.51 (medium), CI: lower = −1.42, upper = 0.45; Cz, Cohen’s d = 0.23 (small), CI: lower = −1.14, upper = 0.71.
Discussion
The present study tested the hypothesis that impulsivity, as a characteristic of ADHD, can be measured by bioelectrical neural responses to changes in pitch of voice auditory feedback during vocalization. In the present study the bioelectric responses of primary interest were defined as the ERP difference between responses to 100-cents and 400-cents perturbations in voice pitch auditory feedback. ERPs elicited by auditory feedback pitch shifts of 100 cents, which are known (Behroozmand, et al., 2009, Behroozmand and Larson, 2011b, Liu, et al., 2011) to reflect voice error detection and correction (sensory and motor components), were subtracted from ERPs elicited by PSPs of 400 cents, which are not perceived as self-voice and therefore do not trigger motor responses (Figure 2). This subtraction yielded a Difference Wave that was composed primarily of motor neural activity related to error detection and correction. GFP measures of the Difference Wave suggested an earlier onset of global bioelectrical voice motor control related brain activity in adults with ADHD as compared to healthy controls. Comparison made across 21 electrodes, between a group of healthy controls and young adults with ADHD supports results suggested by GFP estimates (Figure 4B) revealing a significantly earlier peak latency of the Difference Wave (within the time range of the N1 ERP component) in the ADHD group than in the controls. This earlier Difference Wave peak latency indicates that the neural processing associated with reflexive motor actions in the ADHD group occurred more rapidly than in the control group. The Effect Size of this between group difference was most prominent (Cohen’s d estimate: large and very large) over the left fronto-central electrodes. Results of the present study showed that this latency difference could not be explained by faster auditory processing time in the ADHD group because the N1 response latencies for the 400 cent stimulus, which reflects primarily auditory sensory neural processing (i.e., no motor processing), did not differ between the subject groups (Figure 3).
We further demonstrated that not only peak latency but also onset of the first Difference Wave deflection occurred earlier in adults with ADHD as compared to healthy controls (Figure 5 and 6 see latency window: 50–100ms). Our results also show that these early onsets of neural activity in ADHD subjects is most prominent in an electrode array located over left fronto-central scalp areas, while in healthy subjects it occurred later (Figure 5, see latency window: 100–150ms) and in central and fronto-central scalp areas. These results suggest that rapid impulsivity-related neural activity associated with reflexive motor actions in the ADHD group is initiated earlier than in healthy subjects and might have distinctive brain localization.
Our results demonstrated that adults with ADHD had earlier peak latencies and onset of bioelectric responses to pitch-shifted voice auditory feedback as compared to the control subjects (Figure 5 and 6). Similarly, more rapid motor responses were previously documented in 9–12 year old children with ADHD (as compared to healthy controls) who performed a neuropsychological test battery for attentional functions (Koschack et al., 2003). The rapid responses in that study were voluntary and therefore were performed under the control of higher-level cognitive functions such as attention, planning and decision-making and are therefore unlike the results in the present study, which were more involuntary in nature. Despite these differences, faster motor reactions in adults and children with ADHD may be interpreted as a manifestation of impulsivity, which is one of the core symptoms of ADHD (Sagvolden and Sergeant, 1998; Rubia, et al., 2009) and can be attributed to ADHD-related deficiencies at the level of neuronal populations responsible for very elementary, reflexive motor control actions. These deficiencies might underlie motor related ADHD symptoms such as impulsivity. Apparently, in order to adequately respond to everyday life demands these deficiencies should to some extent be compensated by certain changes in brain activity. This notion is supported by a neuro-anatomical review of compensatory mechanisms in ADHD, suggesting that in tasks requiring higher cognitive functioning, individuals with ADHD may be less able to engage higher order executive systems to flexibly recruit brain regions to match given task demands (Fassbender and Schweitzer, 2006). This lack of flexibility may lead to the appearance of compensatory mechanisms, which at the neuronal level are manifested in hyperactivity of brain regions associated with primary sensory and motor processing and result in more effortful processing of stimuli (Fassbender and Schweitzer, 2006). It is very likely that developmental changes in these compensatory mechanisms might explain the contrast of our results (Figure 3; no N1 ERP latency difference was found) in adults, with findings in children with ADHD who demonstrate shorter auditory N1 peak latencies (Oades et al., 1996). ERP manifestations of the compensatory mechanisms in ADHD have been demonstrated in previous studies (Prox, et al., 2007; Barry, et al., 2009; Sable, et al., 2013) as an increase in ERP amplitudes in adults with ADHD and suggest that compensatory mechanisms are based more on effortful processing of stimuli than on faster voluntary reactions. Our analyses of the mean N1 amplitude to the 100 cents stimuli that elicit auditory-motor brain activity also showed an increase in ERP amplitude in adults with ADHD, however mean amplitude of the N1 response to 400 cents (that is primarily auditory processing related) was not significantly different between ADHD and healthy controls. Apparently any contrasts between our results and those of previous studies can be explained by the suppressive influence of the motor cortex on the auditory cortex that was specific to our experimental conditions. The lack of an increase in the Difference Wave peak amplitudes in adults with ADHD in the present study may relate to the fact that the motor-related fraction of brain activity in our study was elicited as part of an involuntary response, not a voluntary response (involving higher order processing) such as those attributed to other compensatory mechanisms (Prox, et al., 2007; Barry, et al., 2009; Sable, et al., 2013).
Unlike core symptoms of impulsivity or inattention that may persist in any individual with ADHD at any age, compensatory mechanisms might change in the course of maturation. For example, a meta-analysis (Lijffijt et al., 2005) of “stopping” performance in children and adults with ADHD suggests that adults with ADHD are often unable to inhibit responses, whereas inhibitory problems experienced by ADHD children are largely accounted for by additional attentional problems that are clinically characterized as “transient but frequent lapses of inattention and attention” (Castellanos and Tannock, 2002). This meta-analysis supports the notion that despite maturation related modification of the compensatory mechanisms in ADHD, resulting in modification of higher cognitive control functions (such as attention), inhibitory motor control deficits may persist into adulthood (Lijffijt, et al., 2005).
In general, aberrations of voluntary motor functions in ADHD have been reported in a number of studies (Steger et al., 2001; Lijffijt, et al., 2005; Fliers et al., 2009; Macneil et al., 2011; Bruckmann et al., 2012) and apparently are associated with an age-inappropriate overflow of movements that may predict impairment in behavioral inhibition (Mostofsky et al., 2003). Behavioral inhibition was conceptualized as being one of the problems for individuals with ADHD (Barkley, 1997), and it involves inhibiting a prepotent response from occurring or by interrupting an ongoing response pattern that is proving ineffective (Barkley and Murphy, 2006). Although motor responses in the present study were reflexive, and therefore cannot be directly associated with voluntary behavioral inhibition, they occurred when the pattern of ongoing motor vocal control activity was ineffective because of the PSP delivery. The change in motor vocal control activity elicited by the PSP should inhibit ongoing motor vocal control activity and then initiate new motor commands that will result in a change in F0 production. Our results suggest that at the behavioral level these processes might take approximately hundred milliseconds to occur and at the neuronal level the individuals with ADHD clearly show earlier neural activations (approx. 50 – 70 ms; Figure 5 and 6) than the healthy control subjects. These data suggest that ADHD-related impairments in inhibition of ongoing motor activity result in rapid reactions to stimuli before completion of information processing. Since behavioral inhibition and processing of the PSP stimulation might utilize the same neuronal mechanisms, we can hypothesize that impulsiveness, as a clinical characteristic of ADHD, might be associated with deficiency in brain mechanisms of inhibition of motor activity in individuals with ADHD at the involuntary level of voice control.
The shorter latency bioelectrical responses observed in the ADHD group might be considered as analogous to voluntary motor actions characterized as impulsivity, which in general refers to one’s tendency to act without forethought (Sagvolden et al., 2005). Impulsive behavior has been suggested to be a result of executive dysfunction caused by behavioral disinhibition (Barkley, 1997). Although impulsivity can be advantageous for healthy individuals under certain circumstances (Burnett Heyes et al., 2012), it can be an indicator of several psychiatric diseases (Moeller et al., 2001). Despite its prominent, negative role affecting a wide variety of everyday activities, the literature reflects numerous inconsistencies in the conceptualization of impulsivity (Depue and Collins, 1999, Moeller, et al., 2001). The conceptualization of impulsivity is complex, because the meaning of the currently existing measures of impulsivity is heterogeneous, ranging from purely motor and cognitive impulsivity to novelty and sensation seeking, boldness, thrill and adventure seeking, and risk-taking. Among other elements included in the definition of impulsivity, most relevant to our results is that individuals with impulsivity have a predisposition toward rapid, unplanned reactions to stimuli before complete processing of information (Moeller, et al., 2001).
In conclusion, our results suggest that impulsivity-related deficiencies in ADHD are associated with aberrant neuronal network activity in the time range of the N1 ERP response that is related to reflexive vocal motor control. Our results also might suggest that impulsivity-related deficiencies in ADHD can be measured at the level of neuronal populations responsible for very elementary, reflexive motor control actions and are associated with ADHD-related impairment of more general inhibitory brain mechanisms. There are several limitations in our study that need to be considered with respect to the conclusions. In order to validate our conclusions, future studies need to establish correspondence between bioelectrical markers of impulsive motor reflexive actions and currently existing self-report measures (scores from the Impulsive Behavior Scale (UPPS) and Barratt Impulsiveness scale-11) as well as behavioral (Continuous Performance Test) measures of impulsivity in both clinical and non-clinical populations.
Highlights.
Impulsiveness is considered as a key characteristic of persons with ADHD.
Aberrant brain activity associated with impulsivity is manifested in motor control-related bioelectrical brain responses.
Bioelectrical responses primarily reflecting involuntary motor vocal control reflexes have shorter latencies in adults with ADHD.
Acknowledgments
This research was supported by a grant from NIH, Grant No. 1R01DC006243.
Footnotes
Conflict of Interest
There is no conflict of interest associated with our study.
Publisher's Disclaimer: This is a PDF file of an unedited manuscript that has been accepted for publication. As a service to our customers we are providing this early version of the manuscript. The manuscript will undergo copyediting, typesetting, and review of the resulting proof before it is published in its final citable form. Please note that during the production process errors may be discovered which could affect the content, and all legal disclaimers that apply to the journal pertain.
References
- Aliu SO, Houde JF, Nagarajan SS. Motor-induced suppression of the auditory cortex. J Cogn Neurosci. 2009;21:791–802. doi: 10.1162/jocn.2009.21055. [DOI] [PMC free article] [PubMed] [Google Scholar]
- American Psychiatric Association. Task Force on DSM-IV. Diagnostic and statistical manual of mental disorders: DSM-IV-TR. 4. Washington, DC: American Psychiatric Association; 2000. [Google Scholar]
- Barkley RA. Behavioral inhibition, sustained attention, and executive functions: constructing a unifying theory of ADHD. Psychol Bull. 1997;121:65–94. doi: 10.1037/0033-2909.121.1.65. [DOI] [PubMed] [Google Scholar]
- Barkley RA, Murphy KR. Attention-deficit hyperactivity disorder: a clinical workbook. 3. New York: Guilford Press; 2006. [Google Scholar]
- Barry RJ, Clarke AR, McCarthy R, Selikowitz M, Brown CR, Heaven PC. Event-related potentials in adults with Attention-Deficit/Hyperactivity Disorder: an investigation using an inter-modal auditory/visual oddball task. Int J Psychophysiol. 2009;71:124–31. doi: 10.1016/j.ijpsycho.2008.09.009. [DOI] [PubMed] [Google Scholar]
- Behroozmand R, Karvelis L, Liu H, Larson CR. Vocalization-induced enhancement of the auditory cortex responsiveness during voice F0 feedback perturbation. Clin Neurophysiol. 2009;120:1303–12. doi: 10.1016/j.clinph.2009.04.022. [DOI] [PMC free article] [PubMed] [Google Scholar]
- Behroozmand R, Korzyukov O, Larson CR. Effects of voice harmonic complexity on ERP responses to pitch-shifted auditory feedback. Clin Neurophysiol. 2011a;122:2408–17. doi: 10.1016/j.clinph.2011.04.019. [DOI] [PMC free article] [PubMed] [Google Scholar]
- Behroozmand R, Larson CR. Error-dependent modulation of speech-induced auditory suppression for pitch-shifted voice feedback. BMC neuroscience. 2011b;12:54. doi: 10.1186/1471-2202-12-54. [DOI] [PMC free article] [PubMed] [Google Scholar]
- Blakemore SJ, Wolpert D, Frith C. Why can’t you tickle yourself? Neuroreport. 2000;11:R11–6. doi: 10.1097/00001756-200008030-00002. [DOI] [PubMed] [Google Scholar]
- Boersma P. Praat, a system for doing phonetics by computer. GLOT International. 2001;5:341–5. [Google Scholar]
- Brower MC, Price BH. Neuropsychiatry of frontal lobe dysfunction in violent and criminal behaviour: a critical review. J Neurol Neurosurg Psychiatry. 2001;71:720–6. doi: 10.1136/jnnp.71.6.720. [DOI] [PMC free article] [PubMed] [Google Scholar]
- Bruckmann S, Hauk D, Roessner V, Resch F, Freitag CM, Kammer T, et al. Cortical inhibition in attention deficit hyperactivity disorder: new insights from the electroencephalographic response to transcranial magnetic stimulation. Brain. 2012;135:2215–30. doi: 10.1093/brain/aws071. [DOI] [PubMed] [Google Scholar]
- Buckholtz JW, Treadway MT, Cowan RL, Woodward ND, Li R, Ansari MS, et al. Dopaminergic network differences in human impulsivity. Science. 2010;329:532. doi: 10.1126/science.1185778. [DOI] [PMC free article] [PubMed] [Google Scholar]
- Burkard RF, Eggermont JJ, Don M. Auditory evoked potentials: basic principles and clinical application. Philadelphia: Lippincott Williams & Wilkins; 2007. [Google Scholar]
- Burnett Heyes S, Adam RJ, Urner M, van der Leer L, Bahrami B, Bays PM, et al. Impulsivity and rapid decision-making for reward. Front Psychol. 2012;3:153. doi: 10.3389/fpsyg.2012.00153. [DOI] [PMC free article] [PubMed] [Google Scholar]
- Burnett TA, Freedland MB, Larson CR, Hain TC. Voice F0 responses to manipulations in pitch feedback. J Acoust Soc Am. 1998;103:3153–61. doi: 10.1121/1.423073. [DOI] [PubMed] [Google Scholar]
- Castellanos FX, Tannock R. Neuroscience of attention-deficit/hyperactivity disorder: the search for endophenotypes. Nat Rev Neurosci. 2002;3:617–28. doi: 10.1038/nrn896. [DOI] [PubMed] [Google Scholar]
- Chang EF, Niziolek CA, Knight RT, Nagarajan SS, Houde JF. Human cortical sensorimotor network underlying feedback control of vocal pitch. Proc Natl Acad Sci USA. 2013;110:2653–8. doi: 10.1073/pnas.1216827110. [DOI] [PMC free article] [PubMed] [Google Scholar]
- Choi JE, Vaswani PA, Shadmehr R. Vigor of movements and the cost of time in decision making. J Neurosci. 2014;34:1212–23. doi: 10.1523/JNEUROSCI.2798-13.2014. [DOI] [PMC free article] [PubMed] [Google Scholar]
- Cools R, Sheridan M, Jacobs E, D’Esposito M. Impulsive personality predicts dopamine-dependent changes in frontostriatal activity during component processes of working memory. J Neurosci. 2007;27:5506–14. doi: 10.1523/JNEUROSCI.0601-07.2007. [DOI] [PMC free article] [PubMed] [Google Scholar]
- Curio G, Neuloh G, Numminen J, Jousmaki V, Hari R. Speaking modifies voice-evoked activity in the human auditory cortex. Hum Brain Mapp. 2000;9:183–91. doi: 10.1002/(SICI)1097-0193(200004)9:4<183::AID-HBM1>3.0.CO;2-Z. [DOI] [PMC free article] [PubMed] [Google Scholar]
- Depue RA, Collins PF. Neurobiology of the structure of personality: dopamine, facilitation of incentive motivation, and extraversion. Behav Brain Sci. 1999;22:491–517. doi: 10.1017/s0140525x99002046. [DOI] [PubMed] [Google Scholar]
- Eliades SJ, Wang X. Neural substrates of vocalization feedback monitoring in primate auditory cortex. Nature. 2008;453:1102–6. doi: 10.1038/nature06910. [DOI] [PubMed] [Google Scholar]
- Fassbender C, Schweitzer JB. Is there evidence for neural compensation in attention deficit hyperactivity disorder? A review of the functional neuroimaging literature. Clin Psychol Rev. 2006;26:445–65. doi: 10.1016/j.cpr.2006.01.003. [DOI] [PMC free article] [PubMed] [Google Scholar]
- Fliers EA, Franke B, Lambregts-Rommelse NN, Altink ME, Buschgens CJ, Nijhuis-van der Sanden MW, et al. Undertreatment of Motor Problems in Children with ADHD. Child Adolesc Ment Health. 2009;15:85–90. doi: 10.1111/j.1475-3588.2009.00538.x. [DOI] [PMC free article] [PubMed] [Google Scholar]
- Ford JM, Mathalon DH, Kalba S, Whitfield S, Faustman WO, Roth WT. Cortical responsiveness during talking and listening in schizophrenia: an event-related brain potential study. Biol psychiatry. 2001;50:540–9. doi: 10.1016/s0006-3223(01)01166-0. [DOI] [PubMed] [Google Scholar]
- Franklin DW, Wolpert DM. Computational mechanisms of sensorimotor control. Neuron. 2011;72:425–42. doi: 10.1016/j.neuron.2011.10.006. [DOI] [PubMed] [Google Scholar]
- Freed CR, Yamamoto BK. Regional brain dopamine metabolism: a marker for the speed, direction, and posture of moving animals. Science. 1985;229:62–5. doi: 10.1126/science.4012312. [DOI] [PubMed] [Google Scholar]
- Greenblatt RE, Pflieger ME. Randomization-based hypothesis testing from event-related data. Brain Topogr. 2004;16:225–32. doi: 10.1023/b:brat.0000032856.48286.18. [DOI] [PubMed] [Google Scholar]
- Greenlee JD, Jackson AW, Chen F, Larson CR, Oya H, Kawasaki H, et al. Human auditory cortical activation during self-vocalization. PLoS One. 2011;6:e14744. doi: 10.1371/journal.pone.0014744. [DOI] [PMC free article] [PubMed] [Google Scholar]
- Hawco CS, Jones JA, Ferretti TR, Keough D. ERP correlates of online monitoring of auditory feedback during vocalization. Psychophysiology. 2009;46:1216–25. doi: 10.1111/j.1469-8986.2009.00875.x. [DOI] [PubMed] [Google Scholar]
- Heinks-Maldonado TH, Mathalon DH, Gray M, Ford JM. Fine-tuning of auditory cortex during speech production. Psychophysiology. 2005;42:180–90. doi: 10.1111/j.1469-8986.2005.00272.x. [DOI] [PubMed] [Google Scholar]
- Himelstein J, Newcorn JH, Halperin JM. The neurobiology of attention-deficit hyperactivity disorder. Front Biosci. 2000;5:D461–78. doi: 10.2741/himelste. [DOI] [PubMed] [Google Scholar]
- Houde JF, Nagarajan SS, Sekihara K, Merzenich MM. Modulation of the auditory cortex during speech: an MEG study. J Cog Neurosci. 2002;14:1125–38. doi: 10.1162/089892902760807140. [DOI] [PubMed] [Google Scholar]
- Hughes G, Desantis A, Waszak F. Attenuation of auditory N1 results from identity-specific action-effect prediction. Eur J Neurosci. 2013;37:1152–8. doi: 10.1111/ejn.12120. [DOI] [PubMed] [Google Scholar]
- Kawahara H. Interactions between speech production and perception under auditory feedback perturbations on fundamental frequencies. J Acoust Soc Jpn. 1994;15:201–2. [Google Scholar]
- Kessler RC, Adler L, Ames M, Demler O, Faraone S, Hiripi E, et al. The World Health Organization Adult ADHD Self-Report Scale (ASRS): a short screening scale for use in the general population. Psychol Med. 2005;35:245–56. doi: 10.1017/s0033291704002892. [DOI] [PubMed] [Google Scholar]
- Kessler RC, Adler L, Barkley R, Biederman J, Conners CK, Demler O, et al. The prevalence and correlates of adult ADHD in the United States: results from the National Comorbidity Survey Replication. Am J Psychiatry. 2006;163:716–23. doi: 10.1176/appi.ajp.163.4.716. [DOI] [PMC free article] [PubMed] [Google Scholar]
- Korzyukov O, Karvelis L, Behroozmand R, Larson CR. ERP correlates of auditory processing during automatic correction of unexpected perturbations in voice auditory feedback. Int J Psychophysiol. 2012a;83:71–8. doi: 10.1016/j.ijpsycho.2011.10.006. [DOI] [PMC free article] [PubMed] [Google Scholar]
- Korzyukov O, Sattler L, Behroozmand R, Larson CR. Neuronal mechanisms of voice control are affected by implicit expectancy of externally triggered perturbations in auditory feedback. PLoS One. 2012b;7:e41216. doi: 10.1371/journal.pone.0041216. [DOI] [PMC free article] [PubMed] [Google Scholar]
- Koschack J, Kunert HJ, Derichs G, Weniger G, Irle E. Impaired and enhanced attentional function in children with attention deficit/hyperactivity disorder. Psychol Med. 2003;33:481–9. doi: 10.1017/s0033291702007067. [DOI] [PubMed] [Google Scholar]
- Lapish CC, Kroener S, Durstewitz D, Lavin A, Seamans JK. The ability of the mesocortical dopamine system to operate in distinct temporal modes. Psychopharmacology (Berl) 2007;191:609–25. doi: 10.1007/s00213-006-0527-8. [DOI] [PMC free article] [PubMed] [Google Scholar]
- Lehmann D, Skrandies W. Reference-free identification of components of checkerboard-evoked multichannel potential fields. Electroencephalogr Clin Neurophysiol. 1980;48:609–21. doi: 10.1016/0013-4694(80)90419-8. [DOI] [PubMed] [Google Scholar]
- Lijffijt M, Kenemans JL, Verbaten MN, van Engeland H. A meta-analytic review of stopping performance in attention-deficit/hyperactivity disorder: deficient inhibitory motor control? J Abnorm Psychol. 2005;114:216–22. doi: 10.1037/0021-843X.114.2.216. [DOI] [PubMed] [Google Scholar]
- Liu H, Meshman M, Behroozmand R, Larson CR. Differential effects of perturbation direction and magnitude on the neural processing of voice pitch feedback. Clin Neurophysiol. 2011;122:951–7. doi: 10.1016/j.clinph.2010.08.010. [DOI] [PMC free article] [PubMed] [Google Scholar]
- Luria AR. The working brain: an introduction to neuropsychology. London: Allen Lane; 1973. [Google Scholar]
- Macneil LK, Xavier P, Garvey MA, Gilbert DL, Ranta ME, Denckla MB, et al. Quantifying excessive mirror overflow in children with attention-deficit/hyperactivity disorder. Neurology. 2011;76:622–8. doi: 10.1212/WNL.0b013e31820c3052. [DOI] [PMC free article] [PubMed] [Google Scholar]
- Mannuzza S, Klein RG, Moulton JL., 3rd Lifetime criminality among boys with attention deficit hyperactivity disorder: a prospective follow-up study into adulthood using official arrest records. Psychiatry Res. 2008;160:237–46. doi: 10.1016/j.psychres.2007.11.003. [DOI] [PMC free article] [PubMed] [Google Scholar]
- Miller DJ, Derefinko KJ, Lynam DR, Milich R, Fillmore MT. Impulsivity and Attention Deficit-Hyperactivity Disorder: Subtype Classification Using the UPPS Impulsive Behavior Scale. J Psychopathol Behav Assess. 2010;32:323–32. doi: 10.1007/s10862-009-9155-z. [DOI] [PMC free article] [PubMed] [Google Scholar]
- Moeller FG, Barratt ES, Dougherty DM, Schmitz JM, Swann AC. Psychiatric aspects of impulsivity. Am J Psychiatry. 2001;158:1783–93. doi: 10.1176/appi.ajp.158.11.1783. [DOI] [PubMed] [Google Scholar]
- Mostofsky SH, Newschaffer CJ, Denckla MB. Overflow movements predict impaired response inhibition in children with ADHD. Percept Mot Skills. 2003;97:1315–31. doi: 10.2466/pms.2003.97.3f.1315. [DOI] [PubMed] [Google Scholar]
- Murphy KR, Adler LA. Assessing attention-deficit/hyperactivity disorder in adults: focus on rating scales. J Clin Psychiatry. 2004;65 (Suppl 3):12–7. [PubMed] [Google Scholar]
- Murray MM, Brunet D, Michel CM. Topographic ERP analyses: a step-by-step tutorial review. Brain Topogr. 2008;20:249–64. doi: 10.1007/s10548-008-0054-5. [DOI] [PubMed] [Google Scholar]
- Oades RD, Dittmann-Balcar A, Schepker R, Eggers C, Zerbin D. Auditory event-related potentials (ERPs) and mismatch negativity (MMN) in healthy children and those with attention-deficit or tourette/tic symptoms. Biol Psychol. 1996;43:163–85. doi: 10.1016/0301-0511(96)05189-7. [DOI] [PubMed] [Google Scholar]
- Oostenveld R, Praamstra P. The five percent electrode system for high-resolution EEG and ERP measurements. Clin Neurophysiol. 2001;112:713–9. doi: 10.1016/s1388-2457(00)00527-7. [DOI] [PubMed] [Google Scholar]
- Prox V, Dietrich DE, Zhang Y, Emrich HM, Ohlmeier MD. Attentional processing in adults with ADHD as reflected by event-related potentials. Neurosci Lett. 2007;419:236–41. doi: 10.1016/j.neulet.2007.04.011. [DOI] [PubMed] [Google Scholar]
- Rosler M, Retz W, Stieglitz RD. Psychopathological rating scales as efficacy parameters in adult ADHD treatment investigations - benchmarking instruments for international multicentre trials. Pharmacopsychiatry. 2010;43:92–8. doi: 10.1055/s-0029-1242819. [DOI] [PubMed] [Google Scholar]
- Rubia K, Halari R, Christakou A, Taylor E. Impulsiveness as a timing disturbance: neurocognitive abnormalities in attention-deficit hyperactivity disorder during temporal processes and normalization with methylphenidate. Philos Trans R Soc Lond B Biol Sci. 2009;364:1919–31. doi: 10.1098/rstb.2009.0014. [DOI] [PMC free article] [PubMed] [Google Scholar]
- Sable JJ, Knopf KL, Kyle MR, Schully LT, Brooks MM, Parry KH, et al. Attention-deficit hyperactivity disorder reduces automatic attention in young adults. Psychophysiology. 2013;50:308–13. doi: 10.1111/psyp.12012. [DOI] [PubMed] [Google Scholar]
- Sagvolden T, Johansen EB, Aase H, Russell VA. A dynamic developmental theory of attention-deficit/hyperactivity disorder (ADHD) predominantly hyperactive/impulsive and combined subtypes. Behav Brain Sci. 2005;28:397–419. doi: 10.1017/S0140525X05000075. [DOI] [PubMed] [Google Scholar]
- Sagvolden T, Sergeant JA. Attention deficit/hyperactivity disorder-from brain dysfunctions to behaviour. Behav Brain Res. 1998;94:1–10. [PubMed] [Google Scholar]
- Sallee FR, Smirnoff AV. Adderall XR: long acting stimulant for single daily dosing. Expert Rev Neurother. 2004;4:927–34. doi: 10.1586/14737175.4.6.927. [DOI] [PubMed] [Google Scholar]
- SanMiguel I, Todd J, Schroger E. Sensory suppression effects to self-initiated sounds reflect the attenuation of the unspecific N1 component of the auditory ERP. Psychophysiology. 2013;50:334–43. doi: 10.1111/psyp.12024. [DOI] [PubMed] [Google Scholar]
- Scheerer NE, Behich J, Liu H, Jones JA. ERP correlates of the magnitude of pitch errors detected in the human voice. Neuroscience. 2013;240:176–85. doi: 10.1016/j.neuroscience.2013.02.054. [DOI] [PubMed] [Google Scholar]
- Skrandies W. Global field power and topographic similarity. Brain topography. 1990;3:137–41. doi: 10.1007/BF01128870. [DOI] [PubMed] [Google Scholar]
- Stark R, Bauer E, Merz CJ, Zimmermann M, Reuter M, Plichta MM, et al. ADHD related behaviors are associated with brain activation in the reward system. Neuropsychologia. 2011;49:426–34. doi: 10.1016/j.neuropsychologia.2010.12.012. [DOI] [PubMed] [Google Scholar]
- Steger J, Imhof K, Coutts E, Gundelfinger R, Steinhausen HC, Brandeis D. Attentional and neuromotor deficits in ADHD. Dev Med Child Neurol. 2001;43:172–9. [PubMed] [Google Scholar]
- Timm J, SanMiguel I, Saupe K, Schroger E. The N1-suppression effect for self-initiated sounds is independent of attention. BMC neuroscience. 2013;14:2. doi: 10.1186/1471-2202-14-2. [DOI] [PMC free article] [PubMed] [Google Scholar]
- Tripp G, Wickens JR. Neurobiology of ADHD. Neuropharmacology. 2009;57:579–89. doi: 10.1016/j.neuropharm.2009.07.026. [DOI] [PubMed] [Google Scholar]
- Weiser J, Reynolds B. Impulsivity and adolescence. In: Brown BB, Prinstein MJ, editors. Encyclopedia of adolescence. Amsterdam, Boston: Elsevier/Academic Press; 2011. pp. 187–92. [Google Scholar]
- Weisler RH. Safety, efficacy and extended duration of action of mixed amphetamine salts extended-release capsules for the treatment of ADHD. Expert Opin Pharmacother. 2005;6:1003–18. doi: 10.1517/14656566.6.6.1003. [DOI] [PubMed] [Google Scholar]
- Wolpert DM, Flanagan JR. Motor prediction. Curr Biol. 2001;11:R729–32. doi: 10.1016/s0960-9822(01)00432-8. [DOI] [PubMed] [Google Scholar]
- Wolpert DM, Miall RC. Forward Models for Physiological Motor Control. Neural Netw. 1996;9:1265–79. doi: 10.1016/s0893-6080(96)00035-4. [DOI] [PubMed] [Google Scholar]