

Abstract
Chemoresistance is a poor prognostic factor in breast cancer and is a major obstacle to the successful treatment of patients receiving chemotherapy. However, the precise mechanism of resistance remains unclear. In this study, a pair of breast cancer cell lines, MCF-7 and its adriamycin-resistant counterpart MCF-7/ADR was used to examine resistance-dependent cellular responses and to identify potential therapeutic targets. We applied nanoflow liquid chromatography (nLC) and tandem mass tags (TmT) quantitative mass spectrometry to distinguish the differentially expressed proteins (DEPs) between the two cell lines. Bioinformatics analyses were used to identify functionally active proteins and networks. 80 DEPs were identified with either up- or down-regulation. Basing on the human protein-protein interactions (PPI), we have retrieved the associated functional interaction networks for the DEPs and analyzed the biological functions. Six different signaling pathways and most of the DEPs strongly linked to chemoresistance, invasion, metastasis development, proliferation, and apoptosis. The identified proteins in biological networks served to resistant drug and to select critical candidates for validation analyses by western blot. The glucose-6-phosphate dehydrogenase (G6PD), gamma-glutamyl cyclotransferase (GGCT), isocitrate dehydrogenase 1 (NADP+,soluble)(IDH1), isocitrate dehydrogenase 2 (NADP+,mitochondrial) (IDH2) and glutathione S-transferase pi 1(GSTP1), five of the critical components of GSH pathway, contribute to chemoresistance.
Chemoresistance is a poor prognostic factor in breast cancer, presenting a significant clinical challenge. The resistance to anticancer drugs, such as anthracycline, is still a major cause of chemotherapy failure in cancer patients1,2.
The anthracycline drug, adriamycin, is one of the most important anti-cancer chemotherapeutic drugs, and is generally used to treat solid tumors and acute leukemias3,4,5,6. However, adriamycin resistance has been widely reported in the analysis of cancer research on breast cancer, leukemia, osteosarcoma, lung cancer, etc7,8,9,10. A range of factors contributing to this chemoresistance have been proposed, including increased efflux through the P-glycoprotein (P-gp) and multidrug resistance-associated protein (MRP) drug pumps, increased GSH transferases, alterations in topoisomerase activity, and increases in antiapoptotic molecules such as Bcl-211,12,13,14. Potent nuclear DNA repair systems also contribute substantially to the ability of tumor cells to withstand the cytotoxic effects of adriamycin. Despite being occasionally mentioned, to date there have been no studies which fully unravel the expressional signatures of adriamycin resistant breast cancer on the proteomic level. Understanding the mechanisms behind the perspective of proteomic profiling will ultimately facilitate treatments with enhanced tumor responses in the clinic.
To date, proteomic technology has been applied to a wide range of cancer studies including analysis of drug resistance15. Mass spectrometry (MS)-based proteomics often involves analyzing complex mixtures of proteins derived from cell or tissue lysates or from body fluids on a global scale16,17,18. In recent years MS-based proteomics has greatly benefitted from enormous advances in high resolution instrumentation. In particular, a novel mass spectrometer, the Q Exactive, couples a mass selective quadrupole to the Orbitrap analyzer, which has been proven to be a popular instrument configuration19. In this bench-top instrument, precursor ions are selected by the quadrupole, fragmented by Higher Energy Collisional Dissociation (HCD), and measured at high-resolution and accurate-mass (HR/AM) in the Orbitrap analyzer20. Consequently, the Q Exactive offers the potential to analyze many more peptides in a given time, with very high MS/MS data quality21. We wanted to combine these benefits with a compact Ultra High Pressure Liquid Chromatography (UHPLC) system, known as the EASY-nLC 1000, which was not available to us in previous single-run analysis. To quantify protein expression changes, we applied TmT labeled samples together with tandem MS to determine differences between the drug sensitive and drug resistant cells. Protein intensities resulted from the average of the single TmT reporter ion intensities22.
The aim of this study is to conduct an in vitro investigation into adriamycin-resistance mechanisms in breast cancer cells using proteomic strategies, to increase our understanding of the molecular processes involved, and to identify potentially valuable diagnostic or therapeutic resistance biomarkers. To meet these aims, we have run a minimalistic proteomic workflow and presented the quantitative proteomic profiles of two breast cancer cells: MCF-7 and MCF-7/ADR, which are of the same breast cancer origin, but are characterized by different reactions to adriamycin, and therefore, could possibly represent differences in the active molecular networks. The core of this work lies in the identification of cancer up/down regulated proteins externalized by cells, based on the combined exploitation of MS and bioinformatics tools.
Results
The present study was based on three major sets of experiments. First, the nanoflow liquid chromatography (nLC) and tandem mass tags (TmT) quantitative mass spectrometry were applied to distinguish the DEPs between the MCF-7 and its adriamycin-resistant counterpart, MCF-7/ADR cell lines. Subsequently, western blot analyses of DEPs of GSH metabolism pathway served to validate the results by the new proteomic method. Last, DEPs served to evaluate the potential significance of drug resistance using bioinformatic analysis. These analyses served to assess the potential resistance proteins and novel related proteins in adriamycin-resistant breast cancer.
Protein profiling
We were able to identify proteins having a wide range of MW, which spanned mainly from 10,000 to 200,000 Da (Supplementary Fig. S1). Most proteins had a pI between 4 and 10 (Supplementary Fig. S1). In this case, to improve analytical precision, all quantitative data associated with a certain peptide that was identified in multiple fractions were used for deriving protein quantitation tables. With this criteria, more than 63,900 MS/MS spectra were matched to peptide sequences and used for protein quantitation in cell proteomics analysis, excluding spectra deriving from contaminants and reversed protein sequences. We obtained more than 9448 peptides, corresponding to 719 proteins which were identified and quantified in the mixed cell sample. Quantitation data were retrieved from MS/MS reporter ions quantifier from PD. More than two unique peptides were considered for each protein quantitation.
Bioinformatic analysis: identification and functional enrichment of DEPs
Using the DAVID network analysis tool, we analyzed the molecular functions/localizations of the protein data sets according to GO functional annotations and categories. We performed GO analysis on cellular components (CC), molecular functions (MF), and biological processes (BP) of the 719 proteins. A Venn diagram shows the GO analysis of the identified proteins by PD software (Fig. 1). The GO analysis showed that most of the modulated proteins have cytoplasmic origin (23.76%), followed by the membrane region (13.16%), and then nuclear proteins (12.23%) (Fig. 1a). A functional classification of these proteins revealed that most were involved in protein binding, catalytic activity, as well as nucleotide binding and biosynthesis. The remaining molecular functions showed enzyme regulation, signal transduction, etc (Fig. 1b). In Fig. 1c, our BP analysis indicated that the greatest changes occurred in metabolic processes, regulation of biological processes, responses to stimulus, cell organization, and biogenesis. Most of those BP feed into transport, communication, apoptosis, differentiation, and proliferation, suggesting that alterations in these might be involved in adriamycin resistance.
Figure 1. These Venn diagrams demonstrate the GO analyses of all the identified proteins by Proteome Discoverer software.

(a) Cellular component analyses of the identified proteins. (b) Molecular functions analyses of the identified proteins. (c) Biological processes analyses of the identified proteins.
Next, as found with KEGG pathway enrichment, the most active pathways are those of endocytosis, spliceosomes, oxidative phosphorylation, GSH metabolism, and the pentose phosphate pathway (PPP) (Supplementary Table S1). Most of the above-mentioned pathways are strictly connected to growth factor response, invasion, motility, and resistance. For instance, 14 proteins were significantly enriched within the GSH metabolism pathway, which is closely related to the chemoresistance (Fig. 2 and Table 1). At 46.5%, coverage of the proteins in the KEGG database it was lower in the cell proteome than the coverage of the three GO categories (CC 83.5%, MF 87.8%, BP 85.7%).
Figure 2. GSH metabolism pathway.

Proteins indicated in red were significantly enriched within the GSH metabolism pathway. Red stars represent DEPs. 2.3.2.4.: GGCT; 1.1.1.42: IDH1 and IDH2; 1.1.1.49: G6PD; 2.5.1.18: GSTP1.
Table 1. Fourteen proteins were significantly enriched within the GSH metabolism pathway.
| Uniprot accession no. | Gene IDs | Gene symbol | Protein description | CoverageA | 127/126B |
|---|---|---|---|---|---|
| P15144 | 290 | ANPEP | Aminopeptidase | 3.62 | 1.257 |
| Q9Y2Q3-3 | 373156 | GSTK1 | Glutathione S-transferase kappa 1 | 15.89 | 0.885 |
| P11413 | 2539 | G6PD | Glucose-6-phosphate 1-dehydrogenase | 31.46 | 0.498 |
| P21266 | 2947 | GSTM3 | Glutathione S-transferase Mu 3 | 51.56 | 0.723 |
| P78417 | 9446 | GSTO1 | Glutathione S-transferase omega-1 | 36.10 | 1.268 |
| P00390-5 | 2936 | GSR | Glutathione reductase | 8.18 | 0.851 |
| O75223 | 79017 | GGCT | Gamma-glutamylcyclotransferase | 21.28 | 0.631 |
| P48637 | 2937 | GSS | Glutathione synthetase | 5.27 | 0.932 |
| O75874 | 3417 | IDH1 | isocitrate dehydrogenase 1 (NADP+), soluble | 28.50 | 0.568 |
| P48735 | 3418 | IDH2 | isocitrate dehydrogenase 2 (NADP+), mitochondrial | 40.49 | 0.643 |
| P28838-2 | 51056 | LAP3 | Cytosol aminopeptidase | 33.20 | 0.777 |
| P09211 | 2950 | GSTP1 | Glutathione S-transferase P | 52.86 | 1.612 |
| P10620-2 | 4257 | MGST1 | microsomal glutathione S-transferase 1 | 28.74 | 0.932 |
| P52209 | 5226 | PGD | 6-phosphogluconate dehydrogenase | 28.99 | 0.703 |
AData associated with the particular peptide from our proteomics analysis were matched to the peptide database.
BMCF-7 peptide samples of were labeled with TMT2-126 isobaric tags; MCF-7/ADR peptide samples of were labeled with TMT2-127 isobaric tags. The values of 127/126 represent the relative quantitation ratio of the DEPs in two cells.
Finally, we focused on the results concerning DEPs exhibiting significant modulation. With a threshold of 1.5 fold-change (≥1.5 or ≤0.67), we found 80 DEPs showing 49 up-regulated and 31 down-regulated proteins between MCF-7 and MCF-7/ADR cells (Supplementary Table S2). When the same analytical method was used, the coverage of the DEPs in the KEGG database was 43% (Supplementary Table S3). KEGG pathway analysis showed that the DEPs were significantly enriched with those related to GSH metabolism, the PPP, glycolysis/gluconeogenesis, the PPAR signaling pathway, etc. (Fig. 3 and Supplementary Table S3). The coverage of the three GO categories was as follows: 89.9% (CC), 86.1% (MF), and 84.8% (BP). In order to better investigate the chemoresistant relevance of the network and to evaluate the property of a single protein, we conducted a further analysis with total protein KEGG as the background and combined the pathways of the DEPs. Those that share the same pathways were shown below: GSH metabolism (Fig. 2), PPP, glycolysis/gluconeogenesis, fructose, and mannose metabolism and the lysosome pathway.
Figure 3. DEPs were enriched within KEGG pathway.

Focusing on the rich degree, the network showed that the main modulated signaling pathways were the GSH metabolism pathway and the PPP. In the GSH metabolism pathway we had found the following 5 DEPs (G6PD, GGCT, IDH1, IDH2, and GSTP1) significantly difference. (Fig. 2 and Table 1). Other proteins were found either increased or decreased in MCF-7/ADR relative to MCF-7 (Table 2). Of note, ABCB1 (also known as MDR1 or P-gp) was found highly up-regulated in our study (Table 2), which is known to be a key player in mediating multidrug resistance (MDR) in cancer. As expected, our analysis also identified up-regulated Annexin A2(ANXA2) and Annexin A5(ANXA5) in the mixed cell sample, which were known to adriamycin resistance (Table 2).
Table 2. Some DEPs were identified in MCF-7/ADR compared to MCF-7.
| Uniprot accession no. | Gene IDs | Gene symbol | Protein description | Coverage A | 127/126B | Molecular Function | Biological Processes |
|---|---|---|---|---|---|---|---|
| P08727 | 3880 | KRT19 | Keratin, type I cytoskeletal 19 | 51.75 | 0.414 | protein coding | response to stimuli; cell differentiation; |
| P13473 | 3920 | LAMP2 | lysosome-associated membrane glycoprotein 2 | 4.88 | 0.431 | protein coding | transport; coagulation; response to stimuli |
| P11413 | 2539 | G6PD | Glucose-6-phosphate 1-dehydrogenase | 31.46 | 0.498 | catalytic activity; protein coding | metabolic processes; regulation of biological processes; |
| P05787 | 3856 | KRT8 | Keratin, type II cytoskeletal 8 | 56.52 | 0.520 | catalytic activity; protein coding | cell death; cell organization and biogenesis; |
| P04792 | 3315 | HSPB1 | Heat shock protein beta-1 | 43.90 | 0.551 | enzyme regulator activity; protein coding | development; metabolic processes; |
| O75874 | 3417 | IDH1 | Isocitrate dehydrogenase [NADP] cytoplasmic | 28.50 | 0.568 | catalytic activity; protein binding | metabolic processes; response to stimuli; |
| O75223 | 79017 | GGCT | Gamma-glutamylcyclotransferase | 21.28 | 0.631 | catalytic activity; protein binding | regulation of biological processes; metabolic processes |
| P48735 | 3418 | IDH2 | Isocitrate dehydrogenase [NADP], mitochondrial | 40.49 | 0.643 | catalytic activity; nucleotide binding | metabolic processes |
| P08133-2 | 309 | ANXA6 | Isoform 2 of Annexin A6 | 33.39 | 1.501 | metal ion binding; protein binding | transport; regulation of biological processes |
| P04083 | 301 | ANXA1 | Annexin A1 | 60.69 | 1.501 | DNA binding; enzyme regulator activity; | defense response; regulation of biological processes; |
| P08758 | 308 | ANXA5 | Annexin A5 | 71.25 | 1.554 | enzyme regulator activity; metal ion binding; | cell communication; regulation of biological processes; |
| P09211 | 2950 | GSTP1 | Glutathione S-transferase P | 52.86 | 1.612 | catalytic activity; protein binding; | response to stimuli; defense response; |
| P07355 | 302 | ANXA2 | Annexin A2 | 56.05 | 1.907 | enzyme regulator activity; metal ion binding; | development; metabolic processes; |
| P08183 | 5243 | ABCB1 | Multidrug resistance protein 1 | 26.33 | 1.915 | transporter activity; protein binding; | metabolic processes; transport; |
| Q01469 | 2171 | FABP5 | Fatty acid-binding protein | 64.44 | 2.122 | transporter activity; protein binding | metabolic processes; transport; |
| P07195 | 3945 | LDHB | L-lactate dehydrogenase B chain | 40.12 | 2.311 | catalytic activity; protein coding | metabolic processes |
| P17096-2 | 3159 | HMGA1 | Isoform HMG-Y of High mobility group protein HMG-I/HMG-Y | 17.71 | 3.484 | DNA binding; catalytic activity; protein coding | metabolic processes; response to stimuli; |
AData associated with the particular peptides from our proteomics analysis were matched to the peptide database.
BMCF-7 peptide samples were labeled with TMT2-126 isobaric tags; MCF-7/ADR peptide samples were labeled with TMT2-127 isobaric tags. The values of 127/126 represent the relative quantitation ratio of the DEPs in two cells.
Bioinformatic analysis: DEPs-one step interacting proteins network in PPI
Human protein interacting data sets were downloaded from HPRD, which including 9617 proteins and 39240 interacting relations. In the HPRD database, we found 66 DEPs and used as seed proteins for further network research (Table 3). One-step interacting proteins which were considered to correlate with DEPs tightly were mined and the network was built (Fig. 4). In this network, DEPs and one-step interacting proteins are represented as nodes, and the biological relationship between two nodes is represented as an edge. There are 559 nodes and 1899 edges, including 66 DEPs and 493 one-step interacting proteins. Fig. 4 shows a global view of the DEPs-one step interacting proteins network with the following color-coded nodes and edges: DEPs (yellow), one-step proteins (green). Then, we analyzed the function of DEPs-DEPs and DEPs-one step interacting proteins respectively.
Table 3. DEPs information obtained from HPRD.
| DEPs identified by Proteomic method | number | Gene symbol |
|---|---|---|
| seed proteins in HPRD | 9 | HBB, HP, ANXA6, HBA2, KRT8, A2M, CBX3, CBX5, ANXA1 |
| 57 | GSTP1, FHL1, APOA2, ANXA2, CLIC4, DNPEP, LGALS3, G6PD, ALB, BCAP31, SERPINA1, ABCB1, ASNS, ANP32B, HSPB1, C3, IGF2BP2, AKAP12, AKR1B1, IGHG1, LAMP2, IDH1, AGR3, GPI, FLNC, CTSD, ALDOA, ANXA5, ENSA, CA2, HMGA1, CD44, GDA, CAPN2, CALD1, FKBP10, CLU, CD63, DBN1, APOA1, HMGN1, ANLN, FABP5, LDHB, EPCAM, FBP1, KRT7, KRT19, AHSG, GFRA1, IDE, CDA, IDH2, CNN3, LIMA1, DES, ETHE1 | |
| non-seed proteins in HPRD | 14 | HIST1H1D, IGLC2, ISOC1, IGHA1, GGCT, APOC3, LXN, KIAA1324, AKR1C4, FSTL1, L1RE1, CMBL, CTSZ, LY6K |
Figure 4. Biological interaction network of DEPs and their one-step interacting proteins.

In this network, proteins are represented as nodes, and the biological relationship between two nodes is represented as an edge. The yellow node indicates DEPs and the green node indicates one-step interacting protein. There are 559 nodes and 1899 edges, including 66 DEPs and 493 one-step interacting proteins.
Bioinformatic analysis: DEPs-DEPs relations
In the network, there are nine proteins which not only DEPs but also one-step interacting proteins (Table 3). They form five pairs of interacting proteins. According to literature, direct relation means that one protein has been reported to be relevant to drug resistance, indirect indicates that one protein has no evidence as resistance, but its one-step protein has drug resistant function, we can regard this protein as the resemble function. Three-pair DEPs (HBB-HBA2, HP-HBB, KRT8-ANXA1) had been reported directly to have association with resistance to drug23,24,25,26,27,28. Another pair ANXA6-A2M, ANXA6 had been proved as a drug resistance protein29, so we thought A2M might confer resistance indirectly according to the tightly interaction with ANXA6. Although CBX5-CBX3 had no direct evidence with resistance, they were indirectly verified by their other one-step proteins which had resistant function in the network.
Bioinformatic analysis: DEPs-one step interacting protein relations
In the network, there are some certain proteins correlated with more than one DEPs, which we thought had closer relation with DEPs and drug resistance. If the one-step protein has been proved having drug resistance function, we can deduce the DEPs have the similar resistant function. An independent analysis of DEPs-one step interacting proteins relations was performed. The result showed that the number of DEPs interacting with one-step protein ranged from 5 to 1 (Supplementary Fig. S3). Biological interactions were shown previously for these proteins (Fig. 4). These one-step proteins which correlated with more than one DEPs should be focused on, for they might be highly correlate with adriamycin resistance and could be further study.
Literature validation
From literature, we collected scientific publications of DEPs and one-step interacting proteins that have been experimentally discovered and verified. We made further correction by two professors about the text mining results on the DEPs (Table 4). 64(97%) DEPs had been reported to have correlation with drug resistance. Among them, 49(76.6%) DEPs had been proved as drug resistance proteins directly, 15(23.4%) DEPs were verified indirectly. Only 2(3%) DEPs had no evidence to demonstrate the correlation with resistance (Table 4). These results were highly in accordance with the proteomics data, which further validate the accuracy of our proteomic experimental method.
Table 4. The relation of DEPs-one step interacting proteins were identified by HPRD.
| Correlation with drug resistance | No correlation with drug resistance | |
|---|---|---|
| DEPs | 64 (97%) | 2(3%) |
| Direct correlation | 49 (76.6%) | - |
| Indirect correlation | 15 (23.4%) | - |
Bioinformatic analysis: Modules Identification in Networks
To further discover the relationship of the DEPs, we dig out 32 modules in the network (Supplementary Table S4). Such potentially biological relevant associations are inferred from either direct or indirect (including intra- and inter-module) interactions. Among these modules, we randomly took one module which contained 20 proteins for further research (Supplementary Fig. S2). The 20 proteins were enriched within 11 pathways, among them, there were six pathways associated with resistance, especially MAPK signal pathway30. There were five proteins in MAPK signal pathway, including one pair of DEPs-one step interacting protein (HSPB1-DAXX).
Validation by western blot on DEPs in GSH pathway
The expression of G6PD, GGCT, IDH1, IDH2 and GSTP1 were further validated by western blot. Consistent with the observations in proteomics analysis, G6PD, GGCT, IDH1 and IDH2 were found down-regulated in MCF-7/ADR cells compared with MCF-7 cells, and GSTP1 was found up-regulated in MCF-7/ADR cells compared with MCF-7 cells (Fig. 5).
Figure 5. Western blot analysis confirmed changes in protein expression initially identified by quantitative proteomics method.
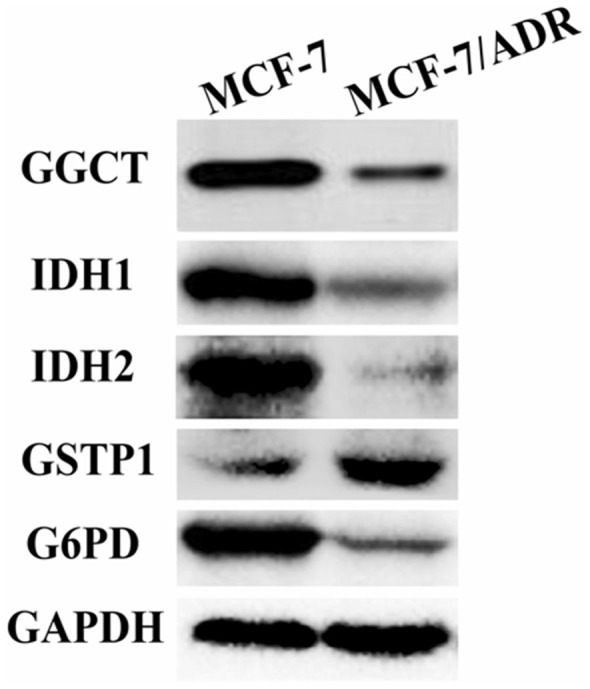
The expression of DEPs was focused on GSH metabolism pathway. G6PD, GGCT, IDH1 and IDH2 were found down–regulated in MCF-7/ADR cells compared with MCF-7 cells. Up-regulated expression was observed for GSTP1. GAPDH was used as the loading control.
Discussion
Quantitative proteomics is driving the discovery of disease-specific targets and biomarkers31. UHPLC, mass spectrometry-based proteomics (Q-Exactive), combined with TmT labeled samples were applied to quantify protein expression changes due to its faster separation, greater sensitivity and resolution.
The novelty of our study deals with the application of this proposed quantitative proteomic approach to dissect the DEPs association with adriamycin-resistance mechanisms in breast cancer cells. This proteomics technique is a powerful method to reach very large coverage of the cell proteome and allow systems wide analysis, and to discovery of DEPs aiming to address potentially valuable diagnostic or therapeutic resistance biomarkers, which may led to a better characterization of the MCF-7/ADR cell line and to a better understanding of its adriamycin resistant phenotype. 80 DEPs were found to be differentially expressed in MCF-7/ADR cells compared with MCF-7 cells, five DEPs (G6PD, GGCT, IDH1, IDH2 and GSTP1) belonging to the GSH pathway were identified significantly different. To validate results of the proteins identified in the proteomics experiments, western blot analyses were performed on these 5 DEPs in MCF7 and MCF-7/ADR cells (Fig. 5).
The GSH metabolism pathway contributes to the detoxification and elimination of a wide range of xenobiotic compounds, underscoring the role of redox regulation of MDR mediated by drug efflux pumps32,33,34. In several previous studies GGCT, a critical component of the GSH pathway, has been implicated as a cancer marker with a potential role in cell proliferation. Despite the differential expression of GGCT in tumor tissues35,36,37, little is known about the function of GGCT in cancer resistant cells. The γ-glutamyl cycle is a pathway that encompasses the synthesis and degradation of GSH and is thought to contribute to the uptake of amino acids across cellular membranes38. GGCT is a pivotal enzyme that contributes to the γ-glutamyl cycle regulating GSH metabolism through catalyzing the formation of 5-oxoproline (pyroglutamic acid) from γ-glutamyl dipeptides34,39. Aaron J Oakley et al. reported39 that the inhibition of GGCT in cases of GSH synthetase deficiency blocks the degradation of γ-glutamylcysteine and allows it to accumulate to a level where it may partially substitute for GSH in redox and detoxification reactions (Fig. 6). There is a significant turnover of GSH and γ-glutamyl-amino acid dipeptides via GGCT and the γ-glutamyl cycle under normal metabolic conditions (Fig. 2 and Fig. 6). The position of GGCT in the γ-glutamyl cycle suggests that it could play a significant role in regulating the synthesis of GSH by limiting the availability of γ-glutamylcysteine. Aaron J Oakley et al.39 also discuss the feedback inhibition of γ-glutamyl cysteine synthetase by GSH. Based on this process, we further hypothesize that GSH expression is modulated by GGCT dependent negative feedback. In our analysis GGCT was found down-regulated in MCF-7/ADR cells (Table 2), while GSH synthetase was not found statistically regulated in the mixed samples. Moreover, the expression of GGCT was also independently shown by observations from western blot analyses, the expression of GGCT was down-regulated in MCF-7/ADR cells compared with MCF-7 cells which supporting proteomic results (Fig. 5). These results suggest that the decreased activity of GGCT is necessary for MCF-7/ADR cells to maintain a high level of GSH, which in turn exports adriamycin out of the cell. Our data provide a novel mechanism for the acquisition of adriamycin resistance.
Figure 6. Enzyme-catalyzed reactions in the γ-glutamyl cycle.
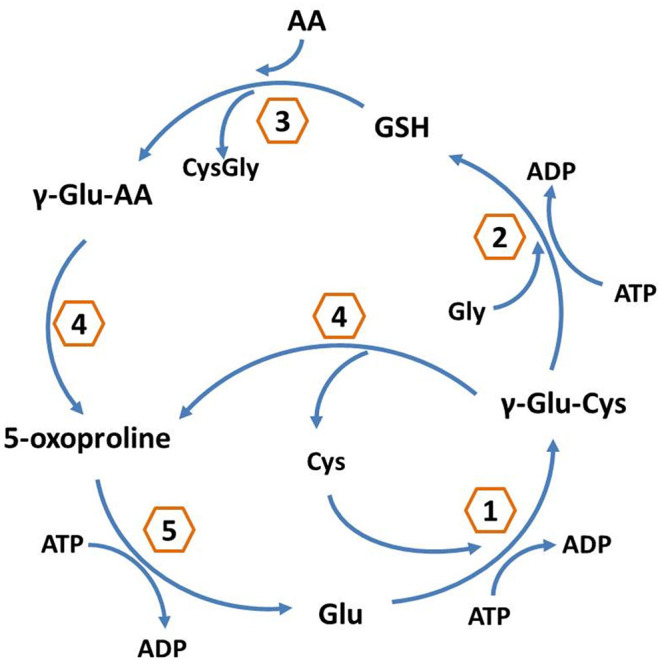
1: γ-glutamyl cysteine synthetase; 2: glutathione synthetase; 3: γ-glutamyl transpeptidase; 4: GGCT; 5: 5-oxoprolinase.
An alternative and less investigated way to increase the level of GSH is to activate the PPP flux via the activation of G6PD33. As the earlier workers have pointed out, G6PD catalyses the first and rate-limiting step of the PPP and a major source of NADPH. NADPH is used by GSH reductase to reduce glutathione disulfide (GSSG) to GSH33. P. Manuela et al.33 showed the increase expression of G6PD in the adriamycin-resistant human colon cancer cellline HT29-DX when compared with normal HT29 cells. Although evidence has been provided that oxidative stress plays a role in resistant cells, many controversial data persist. As demonstrated in another study40 as well as in our study(Table 1), the decrease in the expression of G6PD in MCF-7/ADR was surprisingly found, probably due to the different cell types investigated. Western blot were performed for G6PD to further validate the accuracy, the expression of G6PD was down-regulated in MCF-7/ADR cells compared with MCF-7 cells. This discrepancy suggests a further mechanism study for GSH increase and its effects on MDR, i.e. the hyperactivity of the PPP and of its rate-limiting enzyme G6PD. IDH1 and IDH2 are NADP+ dependent enzymes that catalyze the oxidative decarboxylation of isocitrate to α-ketoglutarate (α-KG), generating NADPH from NADP+41. Somatic heterozygous mutations in IDH1 and IDH2 have been identified in a number of cancers42,43,44. There is increasing evidence that the prognostic impact of IDH1and IDH2 mutations varies according to the specific mutation and also depends on the context of concurrent mutations of other genes41. In our study, we found the expression of IDH1 and IDH2 was down-regulated in MCF-7/ADR cells (Table 2), we do found that the expression of IDH1 and IDH2 down-regulated by western bolt in MCF-7/ADR cells compared with MCF-7 cells (Fig. 5), which is in good agreement with the proteomic data. Our data suggested G6PD, IDH1 and IDH2 may carry out a novel mechanism with adriamycin resistance in breast cancer.
In addition to the differentially expressed proteins discussed above, several other proteins were found to have remarkably altered expression. A number of drugs including adriamycin are known to be substrates of Glutathione S-transferase (GST) and it has been clearly shown that the overexpression of GST and high levels of GSH in tumors are linked to the development of MDR45,46,47. One member of the GST family, GSTP1 up-regulation was identified to be associated with adriamycin resistance in our proteomic experiments (Table 2). Western blot analysis showed the up-regulated expression of GSTP1 in MCF-7/ADR cells compared with MCF-7 cells (Fig. 5), which in accordance with the proteomic result. In addition to the GST family, the most striking up-regulated proteins were HMGA1 in DEPs (Table 2). HMGA1 belongs to the high mobility group A (HMGA) family,which has been previously implicated in breast carcinogenesis48. D Angelo D49 reported that the blockage of HMGA1 expression was a promising approach to enhance cancer cell chemosensitivity, which supported HMGA1 could increase the sensitivity of cancer cells to antineoplastic drugs. To the best of our knowledge, no previous reports have revealed that HMGA1 is increased in adriamycin-resistant breast cancer. MCF-7/ADR cells also have markedly increased expression of the L-lactate dehydrogenase B chain (LDHB) relative to MCF-7 cells (Table 2), which support the hypothesis that LDHB is a predictive marker for the response for patients with breast cancer receiving neoadjuvant chemotherapy50. Furthermore, our proteomic analysis revealed a large number of proteins that may cause cells to adopt an apoptosis-resistant state. For example, the small stress HSP beta-1 (HSPB1 or Hsp27) is well described to counteract apoptosis and its elevated expression is associated with increased aggressiveness of several primary tumors51. R. Kanagasabai52 reported that the expression of HSPB1 sensitizes MCF-7/ADR cells to adriamycin. But recent reports show that HSPB1 up-regulation can worsen the prognosis of breast cancer and the sensitivity of tumors to chemotherapy and radiotherapy53,54. HSPB1 implications in cancer cell resistance to adriamycin has been debatable. In our study HSPB1 was found down-regulated (Table 2), which requires further experiments to confirm this result. Several studies have suggested that the acquisition of the MDR phenotype is associated with elevated invasion and metastasis of tumors55,56.
Overall, western blot experiments were served to provide confidence in the proteomics methodology applied. The expression of G6PD, GGCT, IDH1, IDH2 were down-regulated in MCF-7/ADR cells compared with MCF-7 cells, and GSTP1 was found up-regulated in MCF-7/ADR cells compared with MCF-7 cells. The results obtained are in good agreement with the proteomic method, which strengthen the evidence that proteomic method used in our study is powerful in identification of pathways of drug resistance proteins.
It is important to point out that in our experimental design bioinformatic analysis was carried out to further validate the results obtained from this proposed proteomic method. We use the 66 DEPs called seed proteins and proteins which have direct interactions with DEPs in one step called one-step proteins to build the network map (Fig. 4). If the one-step protein was proved to have drug resistance function, we could deduce the DEPs–one step proteins had the similar resistant function. In the network, the relation of DEPs-DEPs was investigated at high priority. Nine DEPs formed five paires of DEPs-DEPs, among them, six DEPs had been proved directly as drug resistance-associated protein, three DEPs were also deduced to relate with resistance indirectly. An independent analysis of DEPs-one step interacting proteins relations was performed. SUMO4 as a one-step interacting protein was reported to resistant with Type 1 diabetes mellitus57, which was referred to five DEPs (GSTP1, G6PD, IDH1, ALDOA, LDHB) simultaneously. These five proteins had been proved to be correlated with resistant drug directly or indirectly by HPRD. We also obtained that there were four one-step proteins correlate with four DEPs respectively, nine one-step proteins correlate with three DEPs respectively, 63 one-step proteins correlate with two DEPs respectively and 425 one-step proteins correlate with one DEPs in the network (Supplementary Table S5,Fig. S3). From literature, we collected scientific publications of DEPs and one-step interacting proteins that have been experimentally discovered and verified. We aimed at these high credible proteins and make further manual correction. 97% DEPs in the HPRD database had been reported to have correlation with resistant drug. To further discover the relationship of the DEPs, we dig out 32 modules in the network. The 2nd module was focused on further research, which including 20 proteins enriched within 11 pathways, among them, MAPK signal pathway was involved in resistance30, which enriched five proteins in network, including one pair of DEPs-one step interacting protein (HSPB1-DAXX). These results were highly in accordance with the proteomics data, which further validate the accuracy and feasibility of our proteomic experimental method, and support the results from proteomics.
In order to guarantee the data source of built network accuracy, we chose HPRD, a strictly protein interacting database which had been experimentally discovered and verified, rather than predicting proteins interacting database. 66 DEPs involved in HPRD, which led to experimental data couldn't be totally validated. For example, GGCT aforementioned validation by western blot was not existed in HPRD, so the bioinformatic result didn't cover GGCT. One reason is that HPRD may be not a whole protein interacting data and need to be updated timely. Another cause is GGCT may be a new resistant drug protein. It is the first time to find the new resistant function of GGCT by our study. Moreover, experimental testing of these hypotheses will be required to support further assessments for potential clinical application.
Despite the pilot study presented here, two further questions require in depth studies. Firstly, are any of the elements in this proteomic profile predictive of clinical responses to adriamycin? On-going research to correlate in vivo protein expression signatures and clinical responses will address this issue. Secondly, are the aberrant proteins identified central to the mechanism of cellular adriamycin resistance? Functional assays that relate differential expression of these novel proteins to the generation or maintenance of the drug-resistant phenotype will improve our understanding of the roles of these proteins in cancer drug resistance.
Conclusions
Although still in its infancy, the use of proteomics is an excellent approach for the discovery of predictors that can be used for individualization of treatment for breast cancer patients. Our proteomic studies in breast cancer cells have revealed a number of promising proteins that might serve as candidate biomarkers of prognosis and chemotherapy. Hopefully, these findings can be exploited in the future as a useful source of information to guide targeted experiments aiming at discovering yet unknown chemoresistant mechanisms and therapeutic strategies.
Methods
Chemicals and reagents
TmT duplex isobaric tags reagent set (TMT2) and trypsin for MS were purchased from Thermo Scientific (San Jose, CA, USA). EDTA-free protease inhibitor cocktail was purchased from Roche Diagnostics (Indianapolis, IN, USA). Phosphatase inhibitors were purchased from Pierce (Idaho, ID, USA). RIPA Lysis Buffer was purchased from Thermo Scientific (San Jose, CA, USA). The Bradford assay was purchased from Applygen (Beijing, China). C18 ZipTip micropipette tips were purchased from Millipore (Bedford, MA, USA). Generic chemicals were purchased from Sigma-Aldrich (St. Louis, USA). All of the chemicals and reagents used in this study were of analytical chromatography grade.
Cell culture
The breast cancer cell line MCF-7 and its adriamycin resistant counterpart MCF-7/ADR were purchased from the Cancer Institute & Hospital (CIH), Chinese Academy of Medical Sciences (CAMS). Cells were cultured in RPMI 1640 (Gibco, Invitrogen, Carlsbad, CA, USA) containing 10% fetal bovine serum (Hyclone), 2 mM L-glutamine, streptomycin, 100 IU/mL penicillin (all from Gibco-Invitrogen Corp., UK) and maintained without/with 0.2 μg/ml ~ 0.5 μg/ml adriamycin, respectively. All cells were incubated at 37°C in a humidified atmosphere containing 5% CO2. The cells were passaged every 2 ~ 3 days.
Sample preparation
Cells were cultured to harvest 100 μg of protein per sample according to the TmT manufacturer's instructions. 45 ul of 200 mM triethyl ammonium bicarbonate (TEAB) was added to the each protein sample and followed with 5 ul of 2% SDS and 5 ul of 200 mM tris (2-chloroethyl) phosphate (TCEP). The reaction was incubated for 1 hour at 55°C. According to the manufacturer's instructions, 5 ul of 375 mM iodoacetamide (IAA) was added for 30 min at room temperature in the dark.
The protein was then precipitated overnight in six volumes of pre-chilled (−20°C) acetone. In order to improve protein identification and characterization, 4 μL (1 μg/μL) of trypsin was added per sample, and the digestion was performed at 37°C for 12 hours. Finally, enzymatic digestion was performed by adding 2 μL (1 μg/μL) of trypsin to the sample and incubating it at 37°C for 6 hours.
The reporter ions are characteristic of each tag form and detected at distinct m/z (i.e., 126–127 Da for TMT2). These reporter ions are in the low mass region of the MS/MS spectrum and are used to report relative protein expression levels during peptide fragmentation. Peptide samples from MCF-7 were labeled with TMT2-126 isobaric tag according to the manufacturer's protocol, and peptide samples from MCF-7/ADR were labeled by adding the same amount of TMT2-127 isobaric tag. Two pools of labeled peptide samples were combined at equal amount. The dried peptides in the mixed cell sample were cleaned and desalted using C18 ZipTip micropipette tips following the manufacturer's user guide.
Chromatographic and mass spectrometric analysis
All separations were performed on a 150 × 0.050 mm capillary reversed-phase column packed with C18 packing material at room temperature using a Thermo Scientific EASY-nLC1000™ system and a binary solvent system composed of water containing buffer A (0.1% formic acid and 2% acetonitrile) and buffer B (acetonitrile containing 0.1% formic acid). The peptides were separated by a linear gradient of buffer B up to 40% in 200 minutes for a 4 hours gradient run with a flow rate of 300 nl/min in the EASY-nLC 1000 system.
The samples were analyzed with a Thermo Scientific Q Exactive™ hybrid quadrupole-Orbitrap mass spectrometer. The UHPLC was coupled to a Q Exactive mass spectrometer via the nanoelectrospray source (Thermo Fisher Scientific). The Q Exactive was operated in data dependent (dd) mode with full scans acquired at a resolution of 70,000 at 350 m/z and with dd-MS/MS scans acquired at a resolution of 17,500. The mass spectrometer was operated in positive mode in the scan range of 350 ~ 2,000 m/z. Fixed first m/z is 100 in dd-MS/MS scans. Up to the top 15 most abundant isotope patterns with a charge ≥2 from the survey scan were selected with an isolation window of 2.0 m/z. The maximum ion injection times for the full scan and the dd-MS/MS scans were 20 ms and 100 ms respectively, and the automatic gain control (AGC) for the full scan and the dd-MS/MS scans were 3E6 and 1E5 respectively. Repeat sequencing of peptides was kept to a minimum by dynamic exclusion of the sequenced peptides for 30 s.
Protein identification
We used Proteome Discoverer™ (PD) software version 1.3 (Thermo Scientific) to perform the quantitative proteomic analysis. The MS/MS spectra search was performed by SEQUEST® engines to search against the Uniprot Homo sapiens database (http://www.uniprot.org), coupled to the appropriate statistical and quantitative validation methods. Starting with the raw data, PD calculated the relative intensities of reporter ions from a specific identified tandem mass spectrum. A threshold intensity rate of 10,000 for the sum of the reporter ion intensities of HCD spectra was applied. A first statistical evaluation of these large data sets was performed by computing the distribution of m/z measurements. We evaluated analysis performance in terms of molecular weight (MW) and isoelectric point (pI) range of detected proteins. Data derived from MS analysis were examined using percolator for false discovery rate (FDR) < 0.01, which was calculated on the basis of the number of peptide matches against a decoy database. We then performed MS analysis of the TmT labeled samples on Q Exactive. Protein intensities resulted from the average of the single TmT reporter ion intensities obtained for each peptide associated with a specific protein. The average ratio of differential TmT 127/126 expression (1.5 fold increase or decrease) represents the ratio of two samples. In other words, we identified DEPs in our TmT experiment using 1.5 and 0.67 as the up-regulation and down-regulation cutoff points.
Bioinformatic analysis of the detected proteome
The data sets have been analyzed using bioinformatic methods, extracting information about activated pathways and biomarkers linked to chemoresistance. Specific bioinformatics tools like Database for Annotation,Visualization, and Integrated Discovery (DAVID 6.7) have been used to identify protein and molecular pathway modifications. Gene IDs and gene symbol, corresponding to each protein, were obtained by PD. We imported the list of modulated genes, corresponding to total protein, integrated with the list of singleton proteins into DAVID. To understand high-level functions and utilization of the biological systems from molecular-level information, especially large-scale molecular datasets generated by MS, we utilized the Kyoto Encyclopedia of Genes and Genomes (KEGG) pathway representing our knowledge about molecular interactions and reaction networks. Distributions in subcellular locations and molecular functions were assigned to each protein based on Gene Ontology (GO) categories. The significantly (p < 0.05 and FDR < 0.05) enriched categories are presented here.
Human protein interacting Data were downloaded from HPRD database (http://www.hprd.org/). We use the DEPs and proteins which have direct interactions with DEPs in PPI to build the network map. We then analyzed the topological characteristics, mined modules using MINE58, a plugin of Cytoscape59, and identified associations between modules and KEGG biological processes using DAVID. We examined the Web of Knowledge and NCBI PubMed databases with the keywords “resistant” and gene symbol from the abstracts. From these articles, we manually extracted DEPs, which have been screened by HPRD for drug resistance. Although the number of DEPs collected by the literature search is limited, they are highly trustworthy and thus they lay the foundation for our results.
Western blot analysis
In order to validate data obtained from proteomics analysis, the expression of DEPs which focused on GSH metabolism pathway have been determined by western blot analysis, including G6PD, GGCT, IDH1, IDH2 and GSTP1. MCF-7 and MCF-7/ADR cell proteins were extracted in RIPA lysis buffer and quantified by the Bradford assay. Samples were separated on 12% SDS–PAGE and transferred to a PVDF membrane. The membranes were blocked with 5% nonfat dry milk for 2 h at room temperature and subsequently probed with the primary antibodies: rabbit-anti-G6PD polyclonal antibody (diluted 1:500 ABclonal, China), rabbit- anti-GGCT polyclonal antibody (diluted 1:400 Proteintech, China), rabbit-anti-IDH1 polyclonal antibody (diluted 1:500 ABclonal, China), rabbit-anti-IDH2 polyclonal antibody (diluted 1:500 ABclonal, China), rabbit-anti-GSTP1polyclonal antibody (diluted 1:500 ABclonal, China). Membranes were then probed by incubation with a anti-rabbit secondary antibody (diluted 1:5000) for 1 h at room temperature, conjugated to fluorophores from Rockland Immunochemicals (Gilbertsville, PA). The fluorescent signals were visualized using the Odyssey imaging system (Li-COR, Lincoln, NE). All western blot analyses were repeated at least three times.
Author Contributions
Z.W., S.L. and Q.Z. conceived the idea and designed the experiments. Performed the experiments: Z.W., S.L., X.L., S.Z., Q.X., L.G. and Y.L. Participated in discussing the results: H.L., Y.Y. and T.D. Analyzed the data: Z.W., S.L. and L.L. Wrote the paper: Z.W. and S.L. Proofread the manuscript: Z.L. and Q.Z. All authors reviewed the manuscript.
Supplementary Material
Identification of proteins responsible for adriamycin resistance in breast cancer cells using proteomics analysis
Acknowledgments
This experiment was finished in the oncology key lab of Heilongjiang Province Institution of Higher Education. We thank all colleagues for their support and participation.
References
- Simon S. M. & Schindler M. Cell biological mechanisms of multidrug resistance in tumors. P NATL ACAD SCI 91, 3497–3504 (1994). [DOI] [PMC free article] [PubMed] [Google Scholar]
- Gottesman M. M., Fojo T. & Bates S. E. Multidrug resistance in cancer: role of ATP–dependent transporters. NAT REV CANCER 2, 48–58; 10.1038/nrc706 (2002). [DOI] [PubMed] [Google Scholar]
- Yang F., Teves S. S., Kemp C. J. & Henikoff S. Doxorubicin, DNA torsion, and chromatin dynamics. BBA-REV CANCER 1845, 84–89; 10.1016/j.bbcan.2013.12.002 (2014). [DOI] [PMC free article] [PubMed] [Google Scholar]
- Verma S., Dent S., Chow B. J., Rayson D. & Safra T. Metastatic breast cancer: the role of pegylated liposomal doxorubicin after conventional anthracyclines. Cancer Treat Rev 34, 391–406; 10.1016/j.ctrv.2008.01.008 (2008). [DOI] [PubMed] [Google Scholar]
- Vatsyayan R. et al. Role of RLIP76 in doxorubicin resistance in lung cancer (Review). Int J Oncol 34, 1505 (2009). [DOI] [PMC free article] [PubMed] [Google Scholar]
- Green A. E. & Rose P. G. Pegylated liposomal doxorubicin in ovarian cancer. INT J NANOMED 1, 229 (2006). [PMC free article] [PubMed] [Google Scholar]
- Hui R. C. et al. Doxorubicin activates FOXO3a to induce the expression of multidrug resistance gene ABCB1 (MDR1) in K562 leukemic cells. Mol. Cancer Ther 7, 670–678; 10.1158/1535-7163 (2008). [DOI] [PubMed] [Google Scholar]
- Harisi R. et al. Extracellular matrix induces doxorubicin-resistance in human osteosarcoma cells by suppression of p53 function. Cancer biol & ther 6, 1251–1257 (2007). [DOI] [PubMed] [Google Scholar]
- Ferreira M.-J. U. et al. Interaction between doxorubicin and the resistance modifier stilbene on multidrug resistant mouse lymphoma and human breast cancer cells. Anticancer Res 26, 3541–3546 (2006). [PubMed] [Google Scholar]
- Song X. et al. Hypoxia-induced resistance to cisplatin and doxorubicin in non-small cell lung cancer is inhibited by silencing of HIF-1α gene. Cancer Chemoth. Pharm 58, 776–784 (2006). [DOI] [PubMed] [Google Scholar]
- Clynes M. et al. Recent developments in drug resistance and apoptosis research. Crit Rev Oncol Hematol 28, 181–205 (1998). [DOI] [PubMed] [Google Scholar]
- van der Kolk D. M. et al. Activity and expression of the multidrug resistance proteins MRP1 and MRP2 in acute myeloid leukemia cells, tumor cell lines, and normal hematopoietic CD34+ peripheral blood cells. Clin Cancer Res 4, 1727–1736 (1998). [PubMed] [Google Scholar]
- Skovsgaard T., Nielsen D., Maare C. & Wassermann K. Cellular resistance to cancer chemotherapy. Int Rev Cytol 156, 77–157 (1994). [DOI] [PubMed] [Google Scholar]
- Noguchi M. et al. Endogenously produced ganglioside GM3 endows etoposide and doxorubicin resistance by up-regulating Bcl-2 expression in 3LL Lewis lung carcinoma cells. Glycobiology 16, 641–650; 10.1093/glycob/cwj103 (2006). [DOI] [PubMed] [Google Scholar]
- Chuthapisith S., Layfield R., Kerr I. D., Hughes C. & Eremin O. Proteomic profiling of MCF-7 breast cancer cells with chemoresistance to different types of anti-cancer drugs. Int J Oncol 30, 1545–1551 (2007). [PubMed] [Google Scholar]
- Aebersold R. & Mann M. Mass spectrometry-based proteomics. Nature 422, 198–207; 10.1038/nature01511 (2003). [DOI] [PubMed] [Google Scholar]
- Yates Iii J. R., Gilchrist A., Howell K. E. & Bergeron J. J. Proteomics of organelles and large cellular structures. Nat Rev Mol Cell Bio 6, 702–714; 10.1038/nrm1711 (2005). [DOI] [PubMed] [Google Scholar]
- Walther T. C. & Mann M. Mass spectrometry–based proteomics in cell biology. J cell biol 190, 491–500; 10.1083/jcb.201004052 (2010). [DOI] [PMC free article] [PubMed] [Google Scholar]
- Michalski A. et al. Mass spectrometry-based proteomics using Q Exactive, a high-performance benchtop quadrupole Orbitrap mass spectrometer. Mol Cell Proteomics 10, M111. 011015; 10.1074/mcp.M111.011015 (2011). [DOI] [PMC free article] [PubMed] [Google Scholar]
- Olsen J. V. et al. Higher-energy C-trap dissociation for peptide modification analysis. Nat. Methods 4, 709–712; 10.1038/nmeth1060 (2007). [DOI] [PubMed] [Google Scholar]
- Nagarajuna N. et al. Systems-wide perturbation analysis with near complete coverage of the yeast proteome by single-shot UHPLC runs on a bench-top Orbitrap. Mol. Cell. Proteomics 11, M111; 10.1074/mcp.M111.013722 (2011). [DOI] [PMC free article] [PubMed] [Google Scholar]
- Raso C. et al. Characterization of breast cancer interstitial fluids by TmT labeling, LTQ-Orbitrap Velos mass spectrometry, and pathway analysis. J proteome res 11, 3199–3210; 10.1021/pr2012347 (2012). [DOI] [PMC free article] [PubMed] [Google Scholar]
- Weinkauf M. et al. 2-D PAGE-based comparison of proteasome inhibitor bortezomib in sensitive and resistant mantle cell lymphoma. Electrophoresis 30, 974–986; 10.1002/elps.200800508 (2009). [DOI] [PubMed] [Google Scholar]
- Di Iorio B., Guastaferro P. & Bellizzi V. Relationship between resistance to erythropoietin and high anomalous hemoglobin levels in hemodialysis patients with beta-thalassemia minor. Blood Purif 21, 376–380 (2003). [DOI] [PubMed] [Google Scholar]
- Di Iorio B. R., Guastaferro P., Cillo N., Cucciniello E. & Bellizzi V. Long-term L-carnitine administration reduces erythropoietin resistance in chronic hemodialysis patients with thalassemia minor. Drug Target Insights 2, 1–7 (2007). [PMC free article] [PubMed] [Google Scholar]
- Wen Q. et al. Proteomic profiling identifies haptoglobin as a potential serum biomarker for steroid-resistant nephrotic syndrome. AM J NEPHROL 36, 105–13; 10.1159/000339755 (2012). [DOI] [PubMed] [Google Scholar]
- Zhou C. et al. Proteomic analysis of tumor necrosis factor-alpha resistant human breast cancer cells reveals a MEK5/Erk5-mediated epithelial-mesenchymal transition phenotype. Breast Cancer Res 10, R105; 10.1186/bcr2210 (2008). [DOI] [PMC free article] [PubMed] [Google Scholar]
- Yu S., Meng Q., Hu H. & Zhang M. Correlation of ANXA1 expression with drug resistance and relapse in bladder cancer. Int J Clin Exp Pathol 7, 5538–5548 (2014). [PMC free article] [PubMed] [Google Scholar]
- Koumangoye R. B. et al. Reduced annexin A6 expression promotes the degradation of activated epidermal growth factor receptor and sensitizes invasive breast cancer cells to EGFR-targeted tyrosine kinase inhibitors. Mol Cancer 12, 167; 10.1186/1476-4598-12-167 (2013). [DOI] [PMC free article] [PubMed] [Google Scholar]
- Tortora G. et al. Overcoming resistance to molecularly targeted anticancer therapies: Rational drug combinations based on EGFR and MAPK inhibition for solid tumours and haematologic malignancies. Drug Resist Updat 10, 81–100; 10.1016/j.drup.2007.03.003 (2007). [DOI] [PMC free article] [PubMed] [Google Scholar]
- Ruppen I. et al. Differential protein expression profiling by iTRAQ-two-dimensional LC-MS/MS of human bladder cancer EJ138 cells transfected with the metastasis suppressor KiSS-1 gene. Mol Cell Proteomics 9, 2276–2291; 10.1074/mcp.M900255-MCP200 (2010). [DOI] [PMC free article] [PubMed] [Google Scholar]
- Kuo M. T. Redox regulation of multidrug resistance in cancer chemotherapy: molecular mechanisms and therapeutic opportunities. ANTIOXID REDOX SIGN 11, 99–133; 10.1089/ars.2008.2095 (2009). [DOI] [PMC free article] [PubMed] [Google Scholar]
- Manuela P. et al. Modulation of doxorubicin resistance by the glucose-6-phosphate dehydrogenase activity. Biochem J 439, 141–149; 10.1042/BJ20102016 (2011). [DOI] [PubMed] [Google Scholar]
- Amano T. et al. Widespread Expression of γ-Glutamyl Cyclotransferase Suggests It Is Not a General Tumor Marker. J Histochem Cytochem 60, 76–86; 10.1369/0022155411428468 (2012). [DOI] [PMC free article] [PubMed] [Google Scholar]
- Kageyama S. et al. A novel tumor-related protein, C7orf24, identified by proteome differential display of bladder urothelial carcinoma. PROTEOMICS-Clinical Applications 1, 192–199; 10.1002/prca.200600468 (2007). [DOI] [PubMed] [Google Scholar]
- Gromov P. et al. Proteomic profiling of mammary carcinomas identifies C7orf24, a γ-glutamyl cyclotransferase, as a potential cancer biomarker. J proteome res 9, 3941–3953; 10.1021/pr100160u (2010). [DOI] [PubMed] [Google Scholar]
- Uejima D. et al. Involvement of cancer biomarker C7orf24 in the growth of human osteosarcoma. Anticancer Res 31, 1297–1305 (2011). [PubMed] [Google Scholar]
- Meister A. & Anderson M. E. Glutathione. Annu Rev Biochem 52, 711–760; 10.1146/annurev.bi.52.070183.003431 (1983). [DOI] [PubMed] [Google Scholar]
- Oakley A. J. et al. The Identification and Structural Characterization of C7orf24 as γ-Glutamyl Cyclotransferase AN ESSENTIAL ENZYME IN THE γ-GLUTAMYL CYCLE. J Biol Chem 283, 22031–22042; 10.1074/jbc.M803623200 (2008). [DOI] [PubMed] [Google Scholar]
- Gehrmann M. L., Fenselau C. & Hathout Y. Highly altered protein expression profile in the adriamycin resistant MCF-7 cell line. J proteome res 3, 403–409 (2004). [DOI] [PubMed] [Google Scholar]
- Rakheja D., Konoplev S., Medeiros L. J. & Chen W. IDH mutations in acute myeloid leukemia. Hum Pathol 43, 1541–1551; 10.1016/j.humpath.2012.05.003 (2012). [DOI] [PubMed] [Google Scholar]
- Sjoblom T. et al. The consensus coding sequences of human breast and colorectal cancers. Science 314, 268–274; 10.1126/science.1133427 (2006). [DOI] [PubMed] [Google Scholar]
- Parsons D. W. et al. An integrated genomic analysis of human glioblastoma multiforme. Science 321, 1807–1812; 10.1126/science.1164382 (2008). [DOI] [PMC free article] [PubMed] [Google Scholar]
- Mardis E. R. et al. Recurring mutations found by sequencing an acute myeloid leukemia genome. N Engl J Med 361, 1058–1066; 10.1056/NEJMoa0903840 (2009). [DOI] [PMC free article] [PubMed] [Google Scholar]
- Sau A., Pellizzari Tregno F., Valentino F., Federici G. & Caccuri A. M. Glutathione transferases and development of new principles to overcome drug resistance. Arch Biochem Biophys 500, 116–122; 10.1016/j.abb.2010.05.012 (2010). [DOI] [PubMed] [Google Scholar]
- Dirven H. A., van Ommen B. & van Bladeren P. J. Glutathione conjugation of alkylating cytostatic drugs with a nitrogen mustard group and the role of glutathione S-transferases. Chem Res Toxicol 9, 351–360; 10.1021/tx950066l (1996). [DOI] [PubMed] [Google Scholar]
- Townsend D. M. & Tew K. D. The role of glutathione-S-transferase in anti-cancer drug resistance. Oncogene 22, 7369–7375; 10.1038/sj.onc.1206940 (2003). [DOI] [PMC free article] [PubMed] [Google Scholar]
- Peluso S. & Chiappetta G. High-mobility group A (HMGA) proteins and breast cancer. Breast Care 5, 81–85; 10.1159/000297717 (2010). [DOI] [PMC free article] [PubMed] [Google Scholar]
- D'Angelo D. et al. High mobility group A1 protein expression reduces the sensitivity of colon and thyroid cancer cells to antineoplastic drugs. BMC Cancer 14, 851; 10.1186/1471-2407-14-851 (2014). [DOI] [PMC free article] [PubMed] [Google Scholar]
- Dennison J. B. et al. Lactate Dehydrogenase B: a metabolic marker of response to neoadjuvant chemotherapy in breast cancer. Clin Cancer Res 19, 3703–3713; 10.1158/1078-0432.CCR-13-0623 (2013). [DOI] [PMC free article] [PubMed] [Google Scholar]
- Paul C. et al. Dynamic processes that reflect anti-apoptotic strategies set up by HspB1 (Hsp27). Exp Cell Res 316, 1535–1552; 10.1016/j.yexcr.2010.03.006 (2010). [DOI] [PubMed] [Google Scholar]
- Kanagasabai R., Krishnamurthy K., Druhan L. J. & Ilangovan G. Forced expression of heat shock protein 27 (Hsp27) reverses P-glycoprotein (ABCB1)-mediated drug efflux and MDR1 gene expression in Adriamycin-resistant human breast cancer cells. J Biol Chem 286, 33289–33300; 10.1074/jbc.M111.249102 (2011). [DOI] [PMC free article] [PubMed] [Google Scholar]
- Cayado-Gutiérrez N. et al. Downregulation of Hsp27 (HSPB1) in MCF-7 human breast cancer cells induces upregulation of PTEN. Cell Stress Chaperones 18, 243–249; 10.1007/s12192-012-0367-x (2013). [DOI] [PMC free article] [PubMed] [Google Scholar]
- Musiani D. et al. Heat-shock protein 27 (HSP27, HSPB1) is up-regulated by MET kinase inhibitors and confers resistance to MET-targeted therapy. FASEB J 28, 4055–4067 (2014). [DOI] [PMC free article] [PubMed] [Google Scholar]
- Vander Borght S. et al. Expression of multidrug resistance-associated protein 1 in hepatocellular carcinoma is associated with a more aggressive tumour phenotype and may reflect a progenitor cell origin. Liver Int 28, 1370–1380; 10.1111/j.1478-3231.2008.01889.x (2008). [DOI] [PubMed] [Google Scholar]
- Chen H., Hao J., Wang L. & Li Y. Coexpression of invasive markers (uPA, CD44) and multiple drug-resistance proteins (MDR1, MRP2) is correlated with epithelial ovarian cancer progression. Br J Cancer 101, 432–440; 10.1038/sj.bjc.6605185 (2009). [DOI] [PMC free article] [PubMed] [Google Scholar]
- Coppola A. et al. In vitro phenotypic, genomic and proteomic characterization of a cytokine-resistant murine beta-TC3 cell line. PLoS One 7, e32109; 10.1371/journal.pone.0032109 (2012). [DOI] [PMC free article] [PubMed] [Google Scholar]
- Rhrissorrakrai K. & Gunsalus K. C. MINE: Module Identification in Networks. BMC Bioinformatics 12, 192; 10.1186/1471-2105-12-192 (2011). [DOI] [PMC free article] [PubMed] [Google Scholar]
- Shannon P. et al. Cytoscape: a software environment for integrated models of biomolecular interaction networks. Genome Res 13, 2498–2504; 10.1101/gr.1239303 (2003). [DOI] [PMC free article] [PubMed] [Google Scholar]
Associated Data
This section collects any data citations, data availability statements, or supplementary materials included in this article.
Supplementary Materials
Identification of proteins responsible for adriamycin resistance in breast cancer cells using proteomics analysis