

Abstract
Blood-oxygenation-level-dependent (BOLD) MRI is widely used for inferring neuronal activation and is becoming increasingly popular for assessing cerebrovascular reactivity (CVR) when combined with a vasoactive stimulus. The BOLD signal contains changes in cerebral blood flow (CBF) and thus information regarding neurovascular coupling and CVR. The BOLD signal, however, is also modulated by changes in cerebral blood volume (CBV) and cerebral metabolic rate of oxygen (CMRO2), as well as changes in the physiological baseline state. Here, we measured BOLD and CBF responses upon neuronal (visual) activation, before and after a vasodilatory challenge (acetazolamide, ACZ) in patients with vertebrobasilar steno-occlusive disease. After ACZ, the neuronal activation induced BOLD response was reduced or even negative (3 out of 8 subjects), whereas the CBF response remained similar. We show that BOLD alone cannot correctly assess the neuronal activation and underlying neurovascular coupling. The generally assumed positive relationship between BOLD and CBF responses may be severely compromised under changes in the physiological baseline state. Accompanying CBF measurements contain crucial information, and simulations suggest an altered flow–metabolism coupling in these patients.
Keywords: Cerebrovascular disease, BOLD contrast, Arterial spin labeling, Functional MRI (fMRI), Neurovascular coupling, Cerebral hemodynamics, Cerebral blood flow, Physiology
Introduction
In patients with ischemic stroke and steno-occlusive disease of the vertebral and basilar arteries (VBAs) it is difficult to assess which patients are at risk for future stroke and should be treated with an endovascular or surgical procedure. This is crucial as the risk of early recurrent stroke is high in these patients (Gulli et al., 2013; Markus et al., 2013). An important parameter that could predict the risk of recurrent stroke is the cerebrovascular reactivity (CVR), the vasodilatory response of the cerebral resistance vessels. By measuring cerebral blood flow (CBF) before and after a vasodilatory challenge the CVR is measured and the cerebral autoregulative status can be assessed (Detre et al., 1999). As a vasodilatory challenge acetazolamide (ACZ) can be used which acts as a carbonic anhydrase inhibitor that increases the baseline CBF due to vasodilation — the degree of which gives information regarding the CVR (Russell et al., 1990; Vorstrup et al., 1984). In addition, hemodynamic compromise caused by diseased arteries can be assessed by applying a neuronal stimulus (Amemiya et al., 2012). Besides vasodilatation this will also increase the cerebral metabolic rate of oxygen (CMRO2) which may impede interpretation of the results.
For inferring neuronal activation, the most widely used imaging technique is blood-oxygenation-level-dependent (BOLD) MRI and is also becoming increasingly popular for assessing CVR (Donahue et al., 2012; Lythgoe et al., 1999; Mandell et al., 2008; Yezhuvath et al., 2009; Van Der Zande et al., 2005). The rationale for using the BOLD signal is that it reflects underlying changes in CBF that carry information regarding neurovascular coupling and CVR. Furthermore, BOLD MRI has a high image SNR allowing rich spatial and temporal information compared to other modalities for measuring CVR and activation. However, CVR measurements using BOLD MRI are only useful in an experimental design where the BOLD signal returns to baseline (and thereby can be corrected for signal drift). Therefore, BOLD CVR measurements upon ACZ administration is not a suitable option due to the long return to baseline.
The BOLD signal does not only reflect purely CBF changes, but is also modulated by changes in cerebral blood volume (CBV) and CMRO2. An increase in CBF leads to removal of deoxyhemoglobin from the local vasculature, resulting in an increase of the BOLD signal. Dilation of blood vessels (CBV increase) and increases in CMRO2 lead to more deoxyhemoglobin resulting in a BOLD signal decrease. Ultimately, the dynamic interplay of changes in CBF, CBV and CMRO2 will produce the resultant BOLD response. In healthy conditions, increased excitatory neuronal activation evokes a positive BOLD response as the relative increase in CBF is larger than the increase in CMRO2 and CBV.
Several studies have investigated BOLD responses in the human brain using vasoactive challenges such as neuronal stimuli, hypercapnia or ACZ administration in healthy subjects (Brown et al., 2003) and patients with hemodynamic impairment (Amemiya et al., 2012; Blicher et al., 2012; Hamzei et al., 2003; Murata et al., 2006; Rossini et al., 2004). In patients with cerebrovascular disease it has been demonstrated that uncoupling between changes in CBF, CBV and CMRO2 can lead to discrepant BOLD responses compared to healthy subjects (Blicher et al., 2012). This can complicate correct interpretation of neuronal activation when solely using BOLD MRI. On the other hand, discrepant BOLD responses can yield clinically relevant hemodynamic and metabolic information. In the above study by Blicher et al. only neuronal activation was evaluated in patients with cerebrovascular disease (Blicher et al., 2012). It remains unclear whether vascular stimuli, either in isolation or in conjunction with neuronal stimuli, may yield important information concerning the vascular and metabolic status of cortical tissue in these patients.
Here, we investigated BOLD and CBF responses in patients with VBA steno-occlusive disease. Specifically, we evoked neuronal BOLD and CBF responses in the visual cortex before and after a vasodilatory challenge using ACZ. We observe that combined measurements of CBF and BOLD contain crucial information in this population, and that solely BOLD or CBF cannot correctly assess the activation and condition of the vasculature and surrounding tissue.
Materials and methods
Subjects and procedure
All patients (n = 8, age = 62 ± 6 years (mean ± standard deviation)) with recent (1–10 months) ischemic stroke or transient ischemic attack (TIA) in the perfusion territory of the VBAs provided written informed consent in accordance with the Declaration of Helsinki 2008 to participate in the study which was approved by the Institutional Review Board of the Utrecht University Medical Center. Diagnosis and grading of the VBA stenosis or occlusion were performed with either computed tomography or magnetic resonance (MR) angiography as measured according to the North American Symptomatic Carotid Endarterectomy Trial (NASCET) criteria (Barnett et al., 1998). Patients with diabetes mellitus, severe renal or liver dysfunction, which are a contraindication for the use of ACZ, or disabling stroke (modified Rankin scale score of 3–5) (Van Swieten et al., 1988) were excluded from this study. All patients participated in a functional MRI scan-session undergoing visual stimulation before and 15 min after a vasodilatory challenge: intravenous administration of a bolus of 16 mg/kg ACZ (Goldshield Pharmaceuticals, Croydon Surrey, UK) with a maximum dose of 1200 mg.
Magnetic resonance imaging
All patients were scanned on a whole-body 3.0T MR-system (Achieva, Philips Healthcare, Best, The Netherlands) equipped with an 8-channel SENSE head coil (Nova Medical, MA, USA). ASL fMRI: multi-slice single-shot gradient-echo echo-planar imaging (EPI) acquisition with background suppression and repetition time (TR)/echo time = 4000/20 ms, flip angle = 90°, SENSE factor = 2.5, in-plane voxel size = 3 mm, field-of-view = 240 × 240 × 105 mm3, 15 slices in ascending order with slice thickness = 7 mm, averages = 45 control/label pairs, and scan time = 6.2 min. ASL perfusion-weighted images were acquired using a pseudo-continuous labeling technique (Bokkers et al., 2010). The labeled images were acquired by employing a train of RF pulses for a duration of 1650 ms using a balanced gradient scheme (Dai et al., 2008). The control images were acquired by adding 180° to the phase of all even RF pulses. After a delay of 1525 ms, the 17 slices were acquired. Background suppression consisted of a saturation pulse immediately before labeling and inversion pulses at 1680 and 2830 ms after the saturation pulse (Garcia et al., 2005). Quantification of the cerebral blood flow measurements was performed by acquiring an inversion recovery scan prior to the fMRI data acquisition (Chalela et al., 2000). The inversion recovery scan was acquired with an EPI readout with the same geometry and resolution as the ASL images.
Functional paradigm
Each functional run consisted of a 40 s period where the subject was presented with a uniform gray screen together with a red fixation dot in the middle, i.e. the ‘off’-condition. This was followed by a 40 s period showing an 8 Hz reversing checkerboard pattern with the same red fixation dot, i.e. the ‘on’-condition. For each run, an ‘off–on’-condition pair was repeated 4 times plus an additional ‘off’-condition period at the end.
Perfusion and BOLD images
All data were analyzed using Matlab (version 8.1, The MathWorks Inc., Natick, Massachusetts, USA). First, the functional ASL scans were corrected for intra-scan motion (applying rigid-body transformations) and linear drift using FEAT (Jenkinson et al., 2012). Next, perfusion images were generated by local subtraction of a control image by an adjacent label image using a sliding window approach (control1 – label1, control2 – label1, control2 – label2 etc.) to obtain perfusion time course information and reduce sensitivity to motion and signal drift. The perfusion images were converted to CBF units, i.e. mL·100 g−1·min−1, using a model that corrects for the T1 decay, T2* decay and the different delay times of the imaging slices (Alsop and Detre, 1996). The values at 3T for the T2* and T1 relaxation ratesof arterial blood were assumed to be 50 ms and 1680 ms, respectively (Golay et al., 2005; St Lawrence and Wang, 2005). The blood magnetization at thermal equilibrium (M0) for all subjects was calculated by selecting a region of interest (ROI) in the cerebral spinal fluid and iteratively fitting the inversion recovery data using a non-linear least-square method (Chalela et al., 2000). The water content of blood was assumed to be 0.76 mL per mL of arterial blood (Chalela et al., 2000).
BOLD images were generated by adding a control image to an adjacent label image using a sliding window approach (control1 + label1, label1 + control2, control2 + label2 etc.). Both CBF and BOLD images were spatially smoothed (Gaussian kernel, 9 mm full-width-at-half-maximum) and corrected for slice timing. Post-acetazolamide (post-ACZ) CBF and BOLD images were subsequently co-registered with the pre-acetazolamide (pre-ACZ) images using a rigid-body registration in FLIRT (Jenkinson et al., 2012).
Hemodynamic variables included for analysis
For the CBF response, we obtained CBF baseline measures for the pre-ACZ and post-ACZ conditions, CBF0,pre and CBF0,post, respectively, by taking the average CBF signal during the ‘off’-condition periods. Neuronally evoked (functional) CBF increases were also obtained for pre-ACZ and post-ACZ conditions, ΔCBFpre and ΔCBFpost, respectively, by taking the average CBF signal during the ‘on’-condition periods and subtracting the CBF baseline signals (CBF0,pre and CBF0,post). The two scan volumes before and after an ‘off’ to ‘on’ condition transition, and vice versa, were omitted from these calculations to reduce potential transient CBF and BOLD effects caused by the visual stimulus.
For the functional BOLD response, we obtained the percentage BOLD increases during the ‘on’-condition for both the pre-ACZ and post-ACZ conditions, ΔBOLDpre and ΔBOLDpost respectively, using a general-linear-model approach together with a canonical hemodynamic response function in FEAT.
As a measure for the patient’s vasodilatory capacity, we defined the cerebrovascular reactivity (CVR) as the percent increase in CBF baseline post-ACZ administration:
To assess significant differences between the pre-ACZ and post-ACZ conditions for the CBF0, ΔCBF and ΔBOLD a paired one-sided Student’s t-test was applied (P < 0.05 was taken as significant).
Region of interest selection
First, an anatomical mask containing the occipital lobe (visual cortex mask) was made for each subject which included the most posterior 3 cm of brain tissue (a brain mask was created using FSL (Jenkinson et al., 2012)), i.e. 10 coronal slices. Next, BOLD activation masks were created using the absolute z-statistic map from the general-linear-model fit (∣z-value∣ ≥ 1.65, P < 0.05) of the pre-ACZ and post-ACZ BOLD data. The BOLD-activation ROI then contained the overlapping voxels of the visual cortex mask and the BOLD-based (z-statistic) masks. A CBF activation ROI was produced similarly as for the BOLD data, i.e. using a general-linear-model fit (FEAT) of the pre-ACZ and post-ACZ CBF data, and using a ∣z-value∣ ≥ 1.65 (P < 0.05). The final activation-based ROI was then generated by the union of the BOLD-and CBF-activation ROIs. To investigate whether a different ROI would bias the results, we also ran the analysis solely on the visual cortex mask, and the BOLD- and CBF-activation ROIs separately.
Simulation of CBF and BOLD responses
Simulations were performed using a revised Balloon Model (Buxton et al., 2004; Obata et al., 2004) to investigate the observed CBF and BOLD changes caused by the ACZ administration and visual stimulus. Of interest was under what conditions (i.e. different combinations of CBV, CBF and CMRO2 changes upon neuronal activation) a positive CBF response could result in a reduced or even negative BOLD response upon visual stimulation. Of specific interest was under what conditions this solely occurs after increases in baseline CBF thus upon ACZ administration. Here two cases were considered for the increases in baseline CBF post-ACZ; a high CVR case (CBF0,post / CBF0,pre = 50%) and a low CVR case (CBF0,post / CBF0,pre = 20%). The output of the Balloon Model, i.e. changes in CBV and deoxyhemoglobin, is converted to BOLD signal changes using a recent BOLD signal model described by Uludag et al. (2009) that incorporates both intra- and extravascular signal contributions. The parameters for the Balloon and BOLD signal model were (parameter symbols similar as in Buxton et al. (2004)): field-strength = 3T, echo-time = 20 ms, visual stimulation duration = 40 s, microvascular blood fraction (V0,micro) = 0.03 (of which 50% capillaries and 50% venules (Uludag et al., 2009)), macrovascular blood fraction (V0,macro) = 0.05, full-width-at-half-maximum CBF impulse response (gamma-variate function) = 4 s (τf), k parameter CBF impulse response (gamma-variate function) = 3, viscoelastic time constant (τ+ and τ−) = 1 s; delay of CBF relative to CMRO2 responses = 0 s (δt), resting extraction fraction of oxygen (E0) = 0.4, hematocrit (Hct) = 0.4, Grubb’s steady-state flow–volume relationship (α) = 0.38, and steady-state flow–metabolism relation . Note that as two cases were considered for the increases in baseline CBF post-ACZ (a high CVR case and a low CVR case) this also affects E0, where E0 decreases when the baseline CBF increases and CMRO2,0 remains constant pre- and post-ACZ. The corresponding increases in baseline CBV were computed using the Grubb’s steady-state flow–volume relationship α. Further, we considered either a coupled fractional CBF increase (f1) of 0.3 (ΔCBFpre = 0.3 × CBF0,pre and ΔCBFpost = 0.3 ×CBF0,post) or a fixed ΔCBF (ΔCBF = 0.3 × CBF0,pre for both pre- and post-ACZ) upon visual stimulation pre- and post-ACZ administration.
Results
An overview of the demographic and clinical characteristics of the patients with steno-occlusive disease is shown in Table 1.
Table 1.
Demographic and clinical data of patients with steno-occlusive disease in posterior circulation.
| Case no. |
Age (years) |
Sex | Stroke type and location | Time since onset symptoms (months) |
MRA/CTA | Angiographic findings (state of vision) |
|---|---|---|---|---|---|---|
| 1 | 59 | F | Small infarct left occipital lobe, infarct left medulla oblongata | 2 | MRA/CTA | Right side: proximal 50% VA stenosis Left side: proximal VA occlusion 3rd degree nystagmus to the righta |
| 2 | 66 | M | Recurrent vertebrobasilar TIAs | 2 | MRA | Right side: proximal 50% VA stenosis Left side: proximal 50% BA stenosis Slight hazy visiona |
| 3 | 59 | M | Lacunar infarct left thalamus | 1 | MRA | Right side: distal 50% VA stenosis Unimpaired visiona |
| 4 | 71 | F | Infarct left occipital lobe, multiple older infarcts cerebellum | 3 | MRA | Right side: proximal 50% VA stenosis; distal 90% VA stenosis Left side: distal VA occlusion Diplopia, left eye cannot be openeda |
| 5 | 59 | M | Vertebrobasilar TIAs | 5 | CTA | Right side: proximal 70% VA stenosis Unimpaired visiona |
| 6 | 58 | M | Recurrent vertebrobasilar TIAs, small infarct left cerebellum, small infarct brainstem |
2 | MRA | Left side: distal and proximal VA occlusion Unimpaired visiona |
| 7 | 69 | M | Recurrent vertebrobasilar TIAs | 10 | MRA | Right side: distal 50% VA stenosis Left side: distal 30% VA stenosis Blurred vision, no diplopiaa Left eye cannot be fully closeda |
| 8 | 57 | M | Vertebrobasilar TIA, infarcts both sides cerebellum and left lateral medulla oblongata |
2 | CTA | Right side: proximal VA occlusion Left side: proximal 90% VA stenosis Hazy vision, no diplopiaa |
VA = vertebral artery, BA = basilar artery, and TIA = transient ischemic attack.
State of vision was examined during standard neurological examination prior to the MRI examination.
Fig. 1 shows the results of the CBF and BOLD responses from the activation-based ROI for the pre-ACZ and post-ACZ situation. Reported are the baseline CBF (CBF0), the functional CBF (ΔCBF) and BOLD response (ΔBOLD) for the group average (Figs. 1A–C) and per subject (Figs. 1D–F). Post-ACZ an overall increase in baseline CBF of approximately 50% (P < 0.005 Fig. 2A) and a reduced ΔBOLD upon visual stimulation of approximately 0.3 percentage points were observed (P < 0.005, Fig. 2C). The ΔCBF values, however, showed no significant differences upon ACZ administration (P = 0.10, Fig. 2B). Results for different ROIs can be found in Supplemental Table 1.
Fig. 1.

A) Baseline CBF, B) visual activation induced CBF changes (ΔCBF), and C) BOLD changes (ΔBOLD) for pre-ACZ and post-ACZ across all patient cases. Baseline CBF was increased approximately 50% post-ACZ due to the vasodilatory challenge, causing ΔBOLD to reduce upon visual activation (P < 0.005). ΔCBF did not change significantly (P = 0.22). Panels D–E show the results for the individual subjects. ** denotes significant differences (P < 0.005) for a paired Student’s t-test.
Fig. 2.

For all cases (A–H) a single slice covering the visual cortex is shown for the CVR maps, the baseline CBF maps (pre- and post-ACZ) and the ΔCBF and ΔBOLD visual activation maps (preand post-ACZ). For three cases (row D, G and H) large regions with negative ΔBOLD changes (depicted in blue colors) were observed post-ACZ whereas the ΔCBF changes remained similar.
Fig. 2 shows for all subjects the pre- and post-ACZ baseline CBF maps, the CVR maps and the ΔCBF and ΔBOLD activation maps. The ΔCBF activation and ΔBOLD activation were found to be well localized to the visual cortex both pre- and post-ACZ. In 3 out of 8 cases substantial negative ΔBOLD areas were found for the post-ACZ condition (case nos. 5, 7, 8, see Figs. 2E,G,H). The area of negative ΔBOLD ranged between 30% and 70% of the ROI area for these subjects.
Fig. 3 shows the CVR results for all subjects (activation-based ROI) (Fig. 3A), and a plot of the difference in the BOLD response amplitude (ΔBOLD post-ACZ minus ΔBOLD pre-ACZ) versus the CVR (Fig. 3B) and the absolute increase in baseline CBF post-ACZ (Fig. 3C). The absolute increase in baseline CBF can be regarded as an un-normalized measure for the CVR. Voxel-wise analysis showed a significant correlation (Spearman) of the reduction in ΔBOLD post-ACZ with both the CVR (R = −0.24, P < 0.0001) and the absolute increase in baseline CBF (R = −0.41, P < 0.0001). The strongest correlation was found for the absolute baseline CBF increase. Patient cases showing negative ΔBOLD areas (blue circles, Figs. 3B,C) were associated with relatively large reductions in ΔBOLD and large CVR values and absolute increases in baseline CBF. Results for different ROIs can be found in Supplemental Fig. 1 and Supplemental Table 2.
Fig. 3.
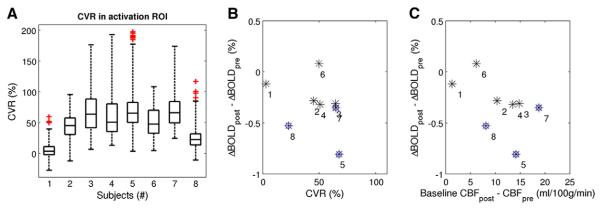
A) Boxplot showing the CVR results for all subjects for the activation-based ROI. The number of voxels in the ROI was: 736, 1140, 1943, 2360, 3005, 3472, 3914, and 4751 respectively for the subjects 1–8. B)Difference in the ΔBOLD amplitude (post-ACZ minus pre-ACZ) versus CVR and C) the absolute increase in baseline CBF upon ACZ administration (un-normalized measure of CVR). Numbers correspond to the patient case numbers in Table 1 and Figs. 1 and 2, and the blue circles indicate the patient cases with areas of negative BOLD responses post-ACZ.
Fig. 4 shows the pre- and post-ACZ hemodynamic BOLD and CBF responses from the negative ΔBOLD area for a single subject (case no. 5). The pre-ACZ CBF and BOLD responses show normal positive signal changes upon visual activation (Fig. 4A). However, post-ACZ a negative BOLD response was observed whereas the CBF response remained positive (Fig. 4B). When comparing the CVR in the negative ΔBOLD area with the surrounding area that contains positive ΔBOLD changes (post-ACZ) no significant differences were found (Fig. 4C). A plot of the ΔBOLD versus ΔCBF results (all voxels from the activation-based ROI) for all subjects for the pre and post-ACZ condition is shown in Figs. 4D,E. The pre-ACZ ΔBOLD changes show a positive relationship with ΔCBF changes (Spearman R = 0.32, P < 0.0001,Fig. 4D). In the post-ACZ condition, however, this apparent relationship is absent and shows an even negative correlation (R = −0.1, P < 0.0001, Fig. 4E), owing to occurrence of large regions with negative ΔBOLD (blue shaded area). Results for different ROIs can be found in Supplemental Table 3.
Fig. 4.

A) and B) For the negative ΔBOLD area, the hemodynamic BOLD and CBF responses respectively for the pre-ACZ and post-ACZ condition, for a single subject (case no. 5, Fig. 2D). In the post-ACZ condition, a negative BOLD response amplitude is observed, whereas the CBF response appears unchanged. The black bar indicates the visual stimulus duration. C) CVR results for respectively the negative (blue) and positive BOLD (red) areas for the same patient — no clear CVR differences were observed. Error bars denote the s.e.m. ΔBOLD versus ΔCBF for D) pre-ACZ and E) post-ACZ showing data from all subjects (all voxels from the activation ROI). A positive relationship between ΔBOLD and ΔCBF is found pre-ACZ, whereas post-ACZ this relationship is severely diminished and shows even a negative correlation due to large regions of negative ΔBOLD (blue shaded area).
Simulation results
Simulations using the Balloon and BOLD signal model revealed four different situations that showed negative BOLD responses accompanied with positive CBF responses with activation: i) increased ΔCMRO2 (or decreased CBF and CBV responses relative to CMRO2 changes), ii) increased ΔCBV (excessive compliant vasculature) relative to CBF and CMRO2 changes, iii) increased ΔCBF and ΔCBV (strong autoregulation) relative to CMRO2 changes, and iv) combinations of all of the above (see Supplemental Fig. 2).
Fig. 5 shows the simulation results on the BOLD response for varying baseline CBF due to ACZ administration. Two cases were considered: a high baseline CBF increase (CVR = 50%) and a low increase (CVR = 20%) upon ACZ administration. We also considered cases where absolute ΔCBF was either coupled via n, the flow–metabolism coupling constant (ΔCBFpost = n × CBFpost,0 × ΔCMRO2 / CMRO2,0 where n and ΔCMRO2 / CMRO2,0were kept constant) or remained the same with activation (ΔCBFpost = ΔCBFpre). Negative BOLD responses post-ACZ are observed only when the CVR is high and ΔCBF remains the same with activation (Fig. 5C). This would correspond to an altered flow–metabolism coupling (n decreases) compared to the pre-ACZ condition as the ΔCBF/CBF0 is reduced post-ACZ. Here, ΔCBF/CBF0 decreased from 1.3 to 1.2 for pre-ACZ and post-ACZ respectively. Reduced positive BOLD responses are observed for the other cases, low CVR and fixed ΔCBF with activation (Fig. 5C), and when ΔCBF is coupled (n is constant) for both the high and low CVR cases (Figs. 5A,B). The largest reductions in ΔBOLD were always associated with high CVR which was also observed in our measured data (Figs. 3B,C).
Fig. 5.

Simulation results of the Balloon and BOLD signal model investigating reduced and negative BOLD responses post-ACZ administration for cases of high CVR (50%) and low CVR (20%). A) High CVR case; reduced BOLD responses (black lines) are expected when baseline CBF and CBV (red and blue lines respectively) is increased post-ACZ and flow-metabolism coupling remains constant, i.e. a coupled ΔCBF. B) Low CVR case; similar effects can be expected as in the high CVR case however the reduction in the BOLD response amplitude is less due to smaller increases in baseline CBF and CBV post-ACZ. C) High CVR case; negative BOLD responses are observed when ΔCBF remains unchanged with activation post-ACZ. D) Reduced, but no negative, BOLD responses can be expected in the case of low CVR and when ΔCBF is unchanged with activation post-ACZ. ΔCMRO2/CMRO2 (green lines) was kept constant in the above cases. Solid and dotted lines denote the pre- and post-ACZ conditions respectively.
Fig. 6 shows the percentage ΔBOLD versus percentage ΔCBF (post-ACZ) for a range of ΔCMRO2 values for high and low CVR simulations. Only for relatively small ΔCBF (≲25%) negative BOLD responses can be expected, where the tipping point depends on the ΔCMRO2 with activation. The simulation data shown in Figs. 5C,D is indicated by the red dots in Figs. 6A,B for the low and high CVR cases respectively. Note that the absolute ΔCBF post-ACZ was the same for both the high and low CVR cases, resulting in lower ΔCBF/CBF for the high CVR case relative to the low CVR case (red dots Figs. 6A,B). Note that in all simulations the Grubb’s steady-state flow–volume relationship was kept constant.
Fig. 6.

Simulation results showing percentage ΔBOLD versus percentage ΔCBF (post-ACZ) for a range of fractional ΔCMRO2 values for the high and low CVR cases (panels A and B, respectively). Note that the ΔCBF was not coupled to the ΔCMRO2 in these simulations. A) Plots of percentage ΔBOLD versus percentage ΔCBF (post-ACZ) for the high CVR case (50%) for a range of fractional ΔCMRO2. The dotted line and red dot indicate the simulation data shown in Fig. 5C. For the dotted line (ΔCMRO2 = 17%) percentage ΔCBF smaller than 23% produces negative BOLD responses with activation. B) Plots of percentage ΔBOLD versus percentage ΔCBF (post-ACZ) for the low CVR case (20%) for a range of fractional ΔCMRO2. The dotted line and red dot indicate the simulation data shown in Fig. 5D. The absolute ΔCBF was the same as for high CVR case, however due to the reduced increase in baseline CBF (low CVR) the percentage ΔCBF is higher and produces for ΔCMRO2 = 17% a positive BOLD responses with activation. In both cases, for a certain ΔCMRO2, negative BOLD responses can be expected for relatively low percentage ΔCBF with activation. Note that the plot of percentage ΔBOLD versus ΔCBF differs between the high and low CVR cases which is caused by the differences in baseline CBV upon ACZ.
Discussion
The present study shows a reduced functional BOLD response after acetazolamide in the visual cortex of patients with steno-occlusive disease of the vertebral and basilar arteries, whereas the CBF response remained relatively similar. In 3 of 8 cases this effect was even more prominent as visual activation revealed cortical areas with substantial negative BOLD changes with concurrent positive CBF changes. These phenomena will have implications when assessing neuronal activation and neurovascular coupling using solely BOLD fMRI in patients with hemodynamic impairment.
The finding of a reduced functional BOLD response with a relatively unchanged functional CBF response upon ACZ administration is largely in accordance with previous findings using BOLD fMRI in healthy subjects (Brown et al., 2003; Bruhn et al., 1994). The observations can be explained by the Davis model for the BOLD signal (Davis et al., 1998). Increased basal CBF due to the vasodilatory effect of ACZ leads to a reduction in the resting venous deoxyhemoglobin content, which results in decreased permissible BOLD responses upon neuronal activation. In healthy subjects it is unlikely that the cerebrovascular reserve capacity becomes exhausted upon ACZ administration, thus leaving room for relatively unaffected functional CBV and CBF changes upon neuronal activation (Brown et al., 2003).
In patients with ischemic motor cortex, Amemiya et al. showed that the functional CBF change and BOLD response shape upon a motor task arerelated to the severity of hemodynamic impairment which was assessed by the basal CBF state and collateral flow patterns (Amemiya et al., 2012). However, no comparison with the local CVR was performed. It was suggested that the functional BOLD response could be potentially used as an indicator of hemodynamic impairment severity. This would require a suitable reference tissue, such as at the cerebellum for a motor task, which is not available for all cortices and functional tasks. In this study we find that the degree of BOLD response reduction can be related to the local CVR. In patients with small increases in basal CBF (low CVR) upon ACZ administration the functional BOLD response remains relatively constant, whereas in patients with larger increases in basal CBF (high CVR) the BOLD response is significantly reduced.
Negative BOLD response with activation
At first glance, this (inverse) relationship between the functional BOLD response and local CVR may seem promising for assessing hemodynamic impairment using a functional task, discarding the usage of an exogenous vasodilatory agent. However, considering our findings of negative BOLD responses, the notion of relating the functional BOLD response to hemodynamic impairment seems more complex. The occurrence of negative functional BOLD responses appears to be unrelated to the underlying functional CBF response with activation (Figs. 4A,B). The CBF response is positive for these regions and has a similar temporal evolution pre- and post-ACZ, indicating that the negative BOLD findings are not associated with large response delays or vascular steal (i.e., CBF reduction below baseline). Moreover, we found no strong indications for a correlation between the occurrence of negative BOLD responses and local CVR. Areas with negative and positive BOLD responses post-ACZ show no significant differences in local CVR (case no. 8, Fig. 4C). This is also apparent when comparing case nos. 5 and 8, which both exhibit negative BOLD responses, but case no. 8 has much lower CVR than case no. 5 (see Figs. 2G,H and 3A). These findings are largely consistent with a recent study in patients with symptomatic intracranial arterial stenosis in which BOLD and CBF-weighted ASL changes in response to a mild hypercapnic challenge were recorded sequentially (Arteaga et al., 2014). Here the majority of observed negative BOLD responses were not associated with reductions in ASL signal (a surrogate marker of vascular steal), and also did not reveal a strong correlation with local CVR. The negative BOLD areas showed either positive CBF or no CBF changes during hypercapnia, thus encompassing a range of possible explanations for negative BOLD responses. Arteaga et al. suggest that additional contributions from autoregulation, metabolism, or partial volume influences should therefore be considered. Importantly, it should be noted that these findings do not mitigate the possible clinical prognostic value of negative BOLD responses, but theydo show that the origins may be heterogeneous. The negative BOLD results could have been influenced by factors related to potential vision impairments. In this study vision impairments were assessed prior to the fMRI examination. For the patients that showed negative BOLD responses post-ACZ we found heterogeneous vision impairments: patient #5 had unimpaired vision, patient 8 had hazy vision, andpatient #7 showed an asymmetric negative BOLD activation. Interestingly, this patient also had an asymmetric vision impairment, not completely able to close the left eye. Unfortunately, we do not have accurate information of the patient’s vision impairments during the fMRI session. This combined with the sample size of the study makes it unfeasible to thoroughly address this issue in the current study.
Non-linear flow–metabolism relationship
The simulations were performed to investigate under which conditions a negative BOLD response (and a positive CBF response) upon visual activation can occur not before but only after an increase in basal CBF (post-ACZ). As various factors, such as differences in ΔCBF, ΔCBV and ΔCMRO2 together with differences in baseline CBF, will impact the BOLD response in different ways it is difficult to quantitatively interpret the negative BOLD results. Our simulations indicate that negative functional BOLD responses occur when functional hyperemia is relatively small (ΔCBF < 23%) and does not change after increasing basal CBF. Also, negative functional BOLD is more expected for high CVR but can also occur for low CVR when ΔCBF is even further reduced (see Fig. 6B). Negative BOLD can be caused by an ‘uncoupling’ of CBF with metabolism and could indicate a non-linear flow–metabolism relationship during functional activation. This notion is in line with recent MRI (Lin et al., 2010) and earlier PET studies (Fox et al., 1988; Vafaee and Gjedde, 2000). The relatively small ΔCBF with activation may explain why negative BOLD responses are only observed in this study for patients with cerebrovascular disease post-ACZ and not normally in healthy subjects who have high CVR (Brown et al., 2003). A previous PET study in patients with cerebrovascular disease (carotid artery occlusive disease) also reported relatively small fractional ΔCBF values upon visual stimulation (~15% (Yamauchi et al., 2005)) as compared to a PET study in healthy subjects (fractional ΔCBF of~39% upon visual stimulation (Feng et al., 2004)). According to our simulations a fractional ΔCBF of around 39% would always produce positive BOLD responses post-ACZ with activation, regardless of the underlying CVR (see Figs. 6A,B). An interesting recent concept proposed by Østergaard et al. predicts reduced ΔCBF responses with activation caused by capillary and neurovascular dysfunction during the course of cerebrovascular disease (Østergaard et al., 2013). In this model, cerebrovascular disease causes disturbed capillary blood flow patterns leading to inefficient tissue oxygen extraction during increases in CBF; reduced ΔCBF responses with activation would be an adaptation to homogenize capillary blood flow patterns to maintain tissue oxygenation. Future work is warranted to investigate these hypotheses in patients with cerebrovascular disease.
Although our findings and study size do not allow for a strict interpretation of underlying mechanisms, an explanation for our results likely gears towards an altered neurovascular (small ΔCBF with activation) and (non-linear) flow–metabolism coupling. In a recent study by Blicher et al., they have observed negative BOLD responses in chronic stroke patients using a motor task (Blicher et al., 2012). Different possibilities may lead to a negative BOLD and positive CBF response with activation: i) increased ΔCMRO2, ii) excessive compliant vasculature (increased ΔCBV), or iii) strong autoregulation (increased ΔCBF and ΔCBV), and combinations of above (see also Supplemental Fig. 2). A vasodilatory challenge was not included in the previous study, making it difficult to put their findings in relation to the local CVR and with the results presented here. Interestingly, we observe negative BOLD responses only after ACZ administration. ACZ might influence the tissue basal CMRO2 and/or neurovascular coupling. The baseline CMRO2 should then increase to produce negative BOLD responses. This contradicts previous PET studies that have shown either no significant effect of ACZ on CMRO2 and neuronal activity (Vorstrup et al., 1984) or at best a slightly decreased CMRO2 (Yamauchi et al., 2003). Further, it should be noted that ASL measures arterial CBF whereas BOLD is weighted by the venous CBF and CBV changes. An altered CBF-to-CBV coupling in respectively the arterial and venous compartments with activation could also be part of the explanation of the findings in these patients.
Experimental limitations and ROI selection
One of the limitations of the present study is that the setup restricted uninterrupted ASL/BOLD fMRI data acquisition during ACZ administration. Thus baseline effects on the BOLD signal due to ACZ signal could not be measured. Also, ACZ can only be administered once throughout an experiment which limits varied modulation of the baseline CBF. Preferably one would like to probe a range of baseline CBF induced changes in a reasonably controlled way, for example by administering different levels of CO2 and room air mixtures. In this manner one would obtain a more detailed depiction on the effect of the baseline CBF on activation induced CBF/BOLD responses for patients with hemodynamic impairment. Also, this would facilitate a comparison with healthy control subjects. ACZ administration in healthy controls was not feasible in this study due to medical ethical reasons. In the present study the sensitivity to BOLD changes was not ideal as the echo-time was on the low side, as the scan was optimized to obtain ASL data with full brain coverage. Shorter echo-times could also increase the sensitivity to non-specific intravascular signal contributions. A dual-echo ASL scan would be more suitable for simultaneously detecting the CBF and BOLD induced signal changes. This would also allow computing of changes in transverse relaxation times (T2*), which is a more quantitative measure of induced BOLD changes not only for neuronal activation but also for changes in baseline state which was not possible with the current experimental setup. A potential source of error in the ASL CBF measurements can be caused by changes in bolus arrival time (BAT) of the magnetically labeled blood during ACZ administration, neuronal activation and delayed arterial transit times for patients with vertebrobasilar insufficiency. Previous studies have shown that the BAT decreases upon neuronal activation and after a vasodilatory challenge, and thus may overestimate the computed absolute CBF values (Donahue et al., 2014; Gonzalez-At et al., 2000). Potential delays in arterial transit time in these patients, for instance given collateral flow from the middle cerebral arteries to the occipital lobe, would result in strong intravascular artifacts in the baseline CBF maps and an underestimation of the CBF values. However, our observed positive ΔCBF values with activation would remain positive even in the case of some delay in arterial transit time. Also, no obvious intravascular artifacts were observed in the baseline CBF maps. We therefore believe that potential transit time changes did not have a major impact on the presented findings. Nonetheless, when employing a long post-label delay time>1500 ms (1525 ms was used in this study) these effects can be considered small. Hypothetical correction of residual BAT effects of ACZ and neuronal activation would lower the reported ΔCBF post-ACZ with activation (Fig. 1B) bringing them closer to the ΔCBF pre-ACZ. This would give more support to our finding that the ΔCBF is similar pre- and post-ACZ. Lastly, the choice of ROI may impact the presented results. Analysis using different ROIs (anatomy based, BOLD- and CBF-activation based ROIs) revealed however that the main findings are not significantly affected (see Supplemental Fig. 1 and Tables 1, 2, 3).
Conclusions
The application of both functional and vasodilatory stimuli can provide useful information on neurovascular coupling in patients with cerebrovascular disease. We found that upon acetazolamide administration the visual activation induced BOLD response is reduced, or even negative (3 out of 8 subjects), whereas the CBF response remained relatively similar (but small) in patients with VBA steno-occlusive disease. These findings likely indicate an altered neurovascular and non-linear flow–metabolism coupling which could be connected to an impaired autoregulatory system. Future work is warranted to confirm these hypotheses. Nonetheless, caution is warranted when inferring neuronal activation and neurovascular coupling in patients with cerebrovascular disease when only BOLD MRI is used. The generally assumed positive relationship between BOLD and CBF responses may be severely compromised under changes in the physiological baseline state.
Supplementary Material
Acknowledgments
This project was partly funded by NIH/NINDS 5R01 NS078828.
Footnotes
Appendix A. Supplementary data Supplementary data to this article can be found online at http://dx.doi.org/10.1016/j.neuroimage.2014.09.033.
References
- Alsop DC, Detre JA. Reduced transit-time sensitivity in noninvasive magnetic resonance imaging of human cerebral blood flow. J. Cereb. Blood Flow Metab. 1996;16:1236–1249. doi: 10.1097/00004647-199611000-00019. [DOI] [PubMed] [Google Scholar]
- Amemiya S, Kunimatsu A, Saito N, Ohtomo K. Impaired hemodynamic response in the ischemic brain assessed with BOLD fMRI. NeuroImage. 2012;61:579–590. doi: 10.1016/j.neuroimage.2012.04.001. [DOI] [PubMed] [Google Scholar]
- Arteaga DF, Strother MK, Faraco CC, Jordan LC, Ladner TR, Dethrage LM, Singer RJ, Mocco J, Clemmons PF, Ayad MJ, Donahue MJ. The vascular steal phenomenon is an incomplete contributor to negative cerebrovascular reactivity in patients with symptomatic intracranial stenosis. J. Cereb. Blood Flow Metab. 2014;34:1453–1462. doi: 10.1038/jcbfm.2014.106. [DOI] [PMC free article] [PubMed] [Google Scholar]
- Barnett HJ, Taylor DW, Eliasziw M, Fox AJ, Ferguson GG, Haynes RB, Rankin RN, Clagett GP, Hachinski VC, Sackett DL, Thorpe KE, Meldrum HE, Spence JD. Benefit of carotid endarterectomy in patients with symptomatic moderate or severe stenosis. North American Symptomatic Carotid Endarterectomy Trial Collaborators. The New England Journal of Medicine. 1998 doi: 10.1056/NEJM199811123392002. [DOI] [PubMed] [Google Scholar]
- Blicher JU, Stagg CJ, Shea JO, Østergaard L, MacIntosh BJ, Johansen-berg H, Jezzard P, Donahue MJ, O’Shea J. Visualization of altered neurovascular coupling in chronic stroke patients using multimodal functional MRI. J. Cereb. Blood Flow Metab. 2012;32:2044–2054. doi: 10.1038/jcbfm.2012.105. [DOI] [PMC free article] [PubMed] [Google Scholar]
- Bokkers RPH, Van Osch MJP, Van Der Worp HB, De Borst GJ, Mali WPTM, Hendrikse J. Symptomatic carotid artery stenosis: impairment of cerebral autoregulation measured at the brain tissue level with arterial spin-labeling MR imaging. Radiology. 2010;256:201–208. doi: 10.1148/radiol.10091262. [DOI] [PubMed] [Google Scholar]
- Brown GG, Eyler Zorrilla LT, Georgy B, Kindermann SS, Wong EC, Buxton RB. BOLD and perfusion response to finger–thumb apposition after acetazolamide administration: differential relationship to global perfusion. J. Cereb. Blood Flow Metab. 2003;23:829–837. doi: 10.1097/01.WCB.0000071887.63724.B2. [DOI] [PubMed] [Google Scholar]
- Bruhn H, Kleinschmidt A, Boecker H, Merboldt KD, Hänicke W, Frahm J. The effect of acetazolamide on regional cerebral blood oxygenation at rest and under stimulation as assessed by MRI. J. Cereb. Blood Flow Metab. 1994;14:742–748. doi: 10.1038/jcbfm.1994.95. [DOI] [PubMed] [Google Scholar]
- Buxton RB, Uludağ K, Dubowitz DJ, Liu TT. Modeling the hemodynamic response to brain activation. NeuroImage. 2004;23(Suppl. 1):S220–S233. doi: 10.1016/j.neuroimage.2004.07.013. [DOI] [PubMed] [Google Scholar]
- Chalela JA, Alsop DC, Gonzalez-Atavales JB, Maldjian JA, Kasner SE, Detre JA. Magnetic resonance perfusion imaging in acute ischemic stroke using continuous arterial spin labeling. Stroke. 2000;31:680–687. doi: 10.1161/01.str.31.3.680. [DOI] [PubMed] [Google Scholar]
- Dai W, Garcia D, de Bazelaire C, Alsop DC. Continuous flow-driven inversion for arterial spin labeling using pulsed radio frequency and gradient fields. Magn. Reson. Med. 2008;60:1488–1497. doi: 10.1002/mrm.21790. [DOI] [PMC free article] [PubMed] [Google Scholar]
- Davis TL, Kwong KK, Weisskoff RM, Rosen BR. Calibrated functional MRI: mapping the dynamics of oxidative metabolism. Proc. Natl. Acad. Sci. U. S. A. 1998;95:1834–1839. doi: 10.1073/pnas.95.4.1834. [DOI] [PMC free article] [PubMed] [Google Scholar]
- Detre JA, Samuels OB, Alsop DC, Gonzalez-At JB, Kasner SE, Raps EC. Noninvasive magnetic resonance imaging evaluation of cerebral blood flow with acetazolamide challenge in patients with cerebrovascular stenosis. J. Magn. Reson. Imaging. 1999;10:870–875. doi: 10.1002/(sici)1522-2586(199911)10:5<870::aid-jmri36>3.0.co;2-d. [DOI] [PubMed] [Google Scholar]
- Donahue MJ, Strother MK, Hendrikse J. Novel MRI approaches for assessing cerebral hemodynamics in ischemic cerebrovascular disease. Stroke. 2012;43:903–915. doi: 10.1161/STROKEAHA.111.635995. [DOI] [PubMed] [Google Scholar]
- Donahue MJ, Faraco CC, Strother MK, Chappell MA, Rane S, Dethrage LM, Hendrikse J, Siero JCW. Bolus arrival time and cerebral blood flow responses to hypercarbia. J. Cereb. Blood Flow Metab. 2014;34:1243–1252. doi: 10.1038/jcbfm.2014.81. [DOI] [PMC free article] [PubMed] [Google Scholar]
- Feng C-M, Narayana S, Lancaster JL, Jerabek PA, Arnow TL, Zhu F, Tan LH, Fox PT, Gao J-H. CBF changes during brain activation: fMRI vs PET. NeuroImage. 2004;22:443–446. doi: 10.1016/j.neuroimage.2004.01.017. [DOI] [PubMed] [Google Scholar]
- Fox PT, Raichle ME, Mintun MA, Dence C. Nonoxidative glucose consumption during focal physiologic neural activity. Science. 1988;241:462–464. doi: 10.1126/science.3260686. [DOI] [PubMed] [Google Scholar]
- Garcia DM, Duhamel G, Alsop DC. Efficiency of inversion pulses for background suppressed arterial spin labeling. Magn. Reson. Med. 2005;54:366–372. doi: 10.1002/mrm.20556. [DOI] [PubMed] [Google Scholar]
- Golay X, Petersen ET, Hui F. Pulsed star labeling of arterial regions (PULSAR): a robust regional perfusion technique for high field imaging. Magn. Reson. Med. 2005;53:15–21. doi: 10.1002/mrm.20338. [DOI] [PubMed] [Google Scholar]
- Gonzalez-At JB, Alsop DC, Detre JA. Cerebral perfusion and arterial transit time changes during task activation determined with continuous arterial spin labeling. Magn. Reson. Med. 2000;43:739–746. doi: 10.1002/(sici)1522-2594(200005)43:5<739::aid-mrm17>3.0.co;2-2. [DOI] [PubMed] [Google Scholar]
- Gulli G, Marquardt L, Rothwell PM, Markus HS. Stroke risk after posterior circulation stroke/transient ischemic attack and its relationship to site of vertebrobasilar stenosis: pooled data analysis from prospective studies. Stroke. 2013;44:598–604. doi: 10.1161/STROKEAHA.112.669929. [DOI] [PubMed] [Google Scholar]
- Hamzei F, Knab R, Weiller C, Röther J. The influence of extra- and intracranial artery disease on the BOLD signal in FMRI. NeuroImage. 2003;20:1393–1399. doi: 10.1016/S1053-8119(03)00384-7. [DOI] [PubMed] [Google Scholar]
- Jenkinson M, Beckmann CF, Behrens TEJ, Woolrich MW, Smith SM. FSL. NeuroImage. 2012;62:782–790. doi: 10.1016/j.neuroimage.2011.09.015. [DOI] [PubMed] [Google Scholar]
- Lin A-L, Fox PT, Hardies J, Duong TQ, Gao J-H. Nonlinear coupling between cerebral blood flow, oxygen consumption, and ATP production in human visual cortex. Proc. Natl. Acad. Sci. U. S. A. 2010;107:8446–8451. doi: 10.1073/pnas.0909711107. [DOI] [PMC free article] [PubMed] [Google Scholar]
- Lythgoe DJ, Williams SC, Cullinane M, Markus HS, Arkus HUGHSM. Mapping of cerebrovascular reactivity using BOLD magnetic resonance imaging. Magn. Reson. Imaging. 1999;17:495–502. doi: 10.1016/s0730-725x(98)00211-2. [DOI] [PubMed] [Google Scholar]
- Mandell DM, Han JS, Poublanc J, Crawley AP, Stainsby JA, Fisher JA, Mikulis DJ. Mapping cerebrovascular reactivity using blood oxygen level-dependent MRI in patients with arterial steno-occlusive disease: comparison with arterial spin labeling MRI. Stroke. 2008;39:2021–2028. doi: 10.1161/STROKEAHA.107.506709. [DOI] [PubMed] [Google Scholar]
- Markus HS, van der Worp HB, Rothwell PM. Posterior circulation ischaemic stroke and transient ischaemic attack: diagnosis, investigation, and secondary prevention. Lancet Neurol. 2013;12:989–998. doi: 10.1016/S1474-4422(13)70211-4. [DOI] [PubMed] [Google Scholar]
- Murata Y, Sakatani K, Hoshino T, Fujiwara N, Kano T, Nakamura S, Katayama Y, Avenue G. Effects of cerebral ischemia on evoked cerebral blood oxygenation responses and BOLD contrast functional MRI in stroke patients. Stroke. 2006;37:2514–2520. doi: 10.1161/01.STR.0000239698.50656.3b. [DOI] [PubMed] [Google Scholar]
- Obata T, Liu T, Miller K, Luh W. Discrepancies between BOLD and flow dynamics in primary and supplementary motor areas: application of the balloon model to the interpretation of BOLD transients. NeuroImage. 2004;21:144–153. doi: 10.1016/j.neuroimage.2003.08.040. [DOI] [PubMed] [Google Scholar]
- Østergaard L, Jespersen SN, Mouridsen K, Mikkelsen IK, Jonsdottír KÝ, Tietze A, Blicher JU, Aamand R, Hjort N, Iversen NK, Cai C, Hougaard KD, Simonsen CZ, Von Weitzel-Mudersbach P, Modrau B, Nagenthiraja K, Riisgaard Ribe L, Hansen MB, Bekke SL, Dahlman MG, Puig J, Pedraza S, Serena J, Cho T-H, Siemonsen S, Thomalla G, Fiehler J, Nighoghossian N, Andersen G. The role of the cerebral capillaries in acute ischemic stroke: the extended penumbra model. J. Cereb. Blood Flow Metab. 2013;33:635–648. doi: 10.1038/jcbfm.2013.18. [DOI] [PMC free article] [PubMed] [Google Scholar]
- Rossini PM, Altamura C, Ferretti A, Vernieri F, Zappasodi F, Caulo M, Pizzella V, Del Gratta C, Romani G-L, Tecchio F. Does cerebrovascular disease affect the coupling between neuronal activity and local haemodynamics? Brain. 2004;127:99–110. doi: 10.1093/brain/awh012. [DOI] [PubMed] [Google Scholar]
- Russell D, Dybevold S, Kjartansson O, Nyberg-Hansen R, Rootwelt K, Wiberg J. Cerebral vasoreactivity and blood flow before and 3 months after carotid endarterectomy. Stroke. 1990;21:1029–1032. doi: 10.1161/01.str.21.7.1029. [DOI] [PubMed] [Google Scholar]
- St Lawrence KS, Wang J. Effects of the apparent transverse relaxation time on cerebral blood flow measurements obtained by arterial spin labeling. Magn. Reson. Med. 2005;53:425–433. doi: 10.1002/mrm.20364. [DOI] [PubMed] [Google Scholar]
- Uludag K, Moëller-Bierl B, Ugurbil K. An integrative model for neuronal activity-induced signal changes for gradient and spin echo functional imaging. NeuroImage. 2009;48:150–165. doi: 10.1016/j.neuroimage.2009.05.051. [DOI] [PubMed] [Google Scholar]
- Vafaee MS, Gjedde A. Model of blood–brain transfer of oxygen explains nonlinear flow–metabolism coupling during stimulation of visual cortex. J. Cereb. Blood Flow Metab. 2000;20:747–754. doi: 10.1097/00004647-200004000-00012. [DOI] [PubMed] [Google Scholar]
- Van Der Zande FHR, Hofman PAM, Backes WH. Mapping hypercapnia-induced cerebrovascular reactivity using BOLD MRI. Neuroradiology. 2005;47:114–120. doi: 10.1007/s00234-004-1274-3. [DOI] [PubMed] [Google Scholar]
- Van Swieten JC, Koudstaal PJ, Visser MC, Schouten HJ, Van Gijn J. Interobserver agreement for the assessment of handicap in stroke patients. Stroke. 1988;19:604–607. doi: 10.1161/01.str.19.5.604. [DOI] [PubMed] [Google Scholar]
- Vorstrup S, Henriksen L, Paulson OB. Effect of acetazolamide on cerebral blood flow and cerebral metabolic rate for oxygen. J. Clin. Invest. 1984;74:1634–1639. doi: 10.1172/JCI111579. [DOI] [PMC free article] [PubMed] [Google Scholar]
- Yamauchi H, Okazawa H, Kishibe Y, Sugimoto K, Takahashi M. The effect of acetazolamide on the changes of cerebral blood flow and oxygen metabolism during visual stimulation. NeuroImage. 2003;20:543–549. doi: 10.1016/s1053-8119(03)00283-0. [DOI] [PubMed] [Google Scholar]
- Yamauchi H, Kudoh T, Sugimoto K, Takahashi M, Kishibe Y, Okazawa H. Altered patterns of blood flow response during visual stimulation in carotid artery occlusive disease. NeuroImage. 2005;25:554–560. doi: 10.1016/j.neuroimage.2004.11.047. [DOI] [PubMed] [Google Scholar]
- Yezhuvath US, Lewis-Amezcua K, Varghese R, Xiao G, Lu H. On the assessment of cerebrovascular reactivity using hypercapnia BOLD MRI. NMR Biomed. 2009;22:779–786. doi: 10.1002/nbm.1392. [DOI] [PMC free article] [PubMed] [Google Scholar]
Associated Data
This section collects any data citations, data availability statements, or supplementary materials included in this article.