Abstract
Purpose
To characterize a new approach to magnetization transfer (MT) imaging with improved specificity for myelinated tissues relative to conventional MT.
Methods
Magnetization transfer preparation sequences were implemented with all radiofrequency power centered on a single frequency and also with power evenly divided between positive and negative frequencies. Dual frequency saturation was achieved both with short, alternating frequency pulses and with sinusoidal modulation of continuous irradiation. Images following preparation were acquired with a single shot fast spin echo sequence. Single and dual frequency preparation should achieve similar saturation of molecules except for those with inhomogenously broadened lines. Inhomogenous MT (IHMT) images were generated by subtraction of dual from single frequency prepared images. IHMT imaging was performed with different power and frequency in the brains of normal volunteers.
Results
The (IHMT) method demonstrated a greater white/gray matter ratio than conventional MT and virtual elimination of signal in scalp and other unmyelinated tissues. IHMT exceeded 5% of the fully relaxed magnetization in white matter. A broad frequency spectrum and signs of axonal angular dependence at high frequency were observed that are consistent with dipolar broadening.
Conclusion
IHMT shows promise for myelin specific imaging. Further study of physical mechanisms and diagnostic sensitivity are merited.
Keywords: Brain, Inhomogeneous broadening, MT, Magnetization transfer, Myelin
INTRODUCTION
It is now widely appreciated that off-resonance radio-frequency (RF) irradiation produces attenuation of the water proton signal in MRI. While direct saturation of water due to the T2 broadening of the line typically contributes significantly to this effect, exchange of magnetization from motion restricted protons is a primary contributor, and the phenomenon has become known as magnetization transfer (MT) attenuation (1). The attenuation results from saturation of proton magnetization in macromolecules which then exchanges with the visible, unbound water.
The MT contrast produced by off-resonance irradiation has been extensively evaluated in the clinical and research setting (2). Perhaps the most widely studied application has been the evaluation of white matter (WM) abnormalities such as multiple sclerosis (MS) and traumatic brain injury (3,4). Studies in these and other diseases and models suggest a relationship between MT contrast in WM and the extent of damage to myelin. However, the fractional changes observed are often small (5), not unique to WM (6), and difficult to reproduce across scanners because of differences in RF pulse shapes, timing, and amplitudes (7). Quantitative analysis of bound pool fraction(8-13) has shown promise for improving specificity, but further specificity and sensitivity might be achieved if aspects of the MT signal unique to myelin were identified.
MT effects arise from exchange with one or more pools of magnetization with a wide, dipolar broadened line shape. A broad line is actually the instantaneous summation of many individual lines with different offset frequencies. When these lines exchange very slowly with each other, as for example when broadening results from spatial inhomogeneity of the magnetic field, nuclei at a distinct offset frequency can be saturated to produce a hole in a broadened line (14). Typically however, spin components of these lines move rapidly from one frequency to another such that the different lines cannot be separated by RF excitation or saturation, at least with RF powers available in-vivo. Such rapidly exchanging lines are known as homogeneously broadened lines. Quantitative modeling of MT usually assumes that the broad lines are homogeneously broadened. Indeed there are multiple mechanisms in tissues to achieve this mixing of frequencies on a timescale much less than a millisecond, including rotational and translational motion, chemical exchange, and spin diffusion.
One compartment that may not be homogeneously broadened is magnetization in large membranes, the main constituent of the myelin sheath. Lipids and proteins within the membrane may fully rotate only around an axis perpendicular to the surface (15). Studies of spin diffusion in membrane lipid molecules have indicated much reduced spin diffusion (16), because small fluctuations in bond angles of the lipids inhibit it. The absence of the usual mechanisms, by which homogeneous broadening is achieved, suggest that inhomogeneous broadening may be present in membranes (17-20), which represent more than half the mass of myelin (21).
Here we propose and implement a method to detect the transfer of inhomogeneously broadened magnetization in the presence of a larger background of homogeneous MT. The resulting signal appears highly specific for myelinated structures and may have clinical and research utility.
THEORY
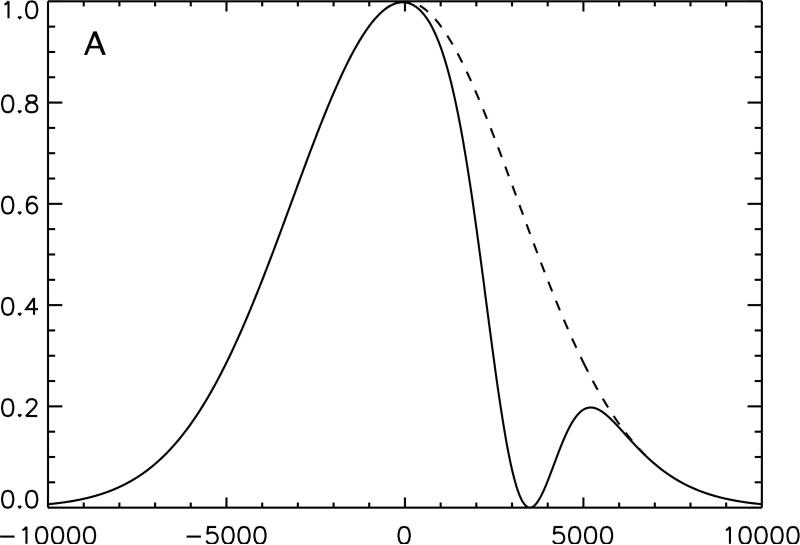
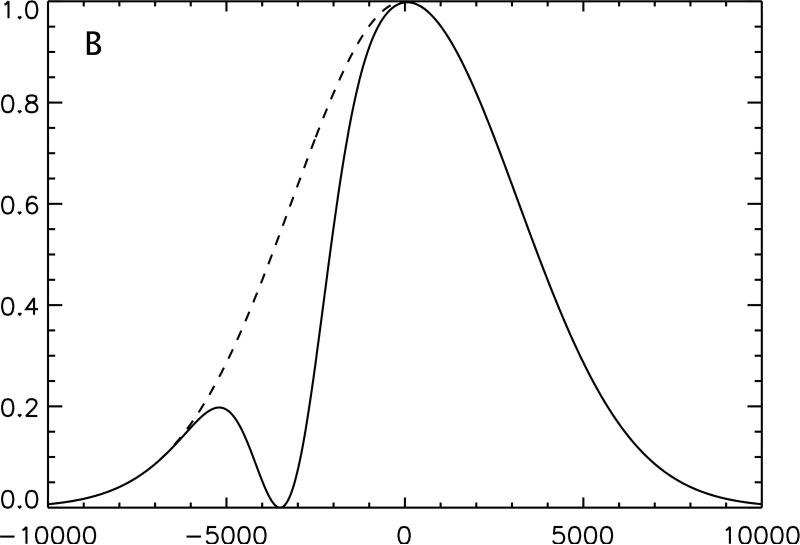
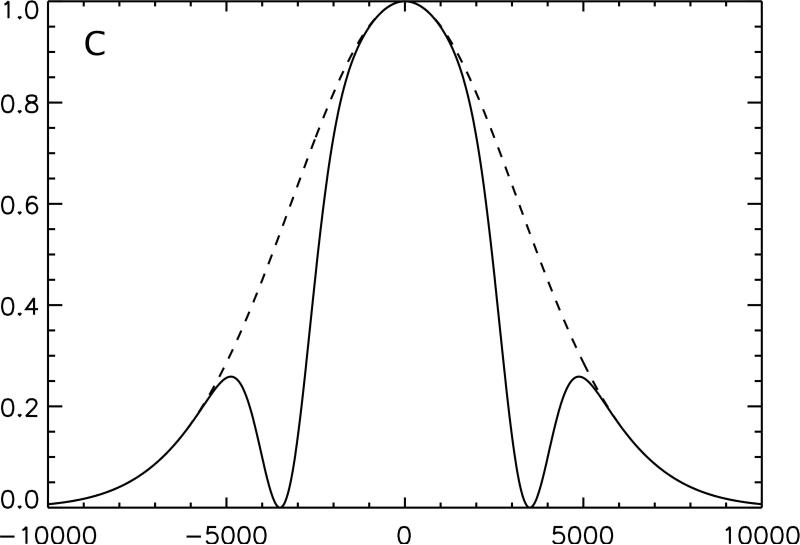
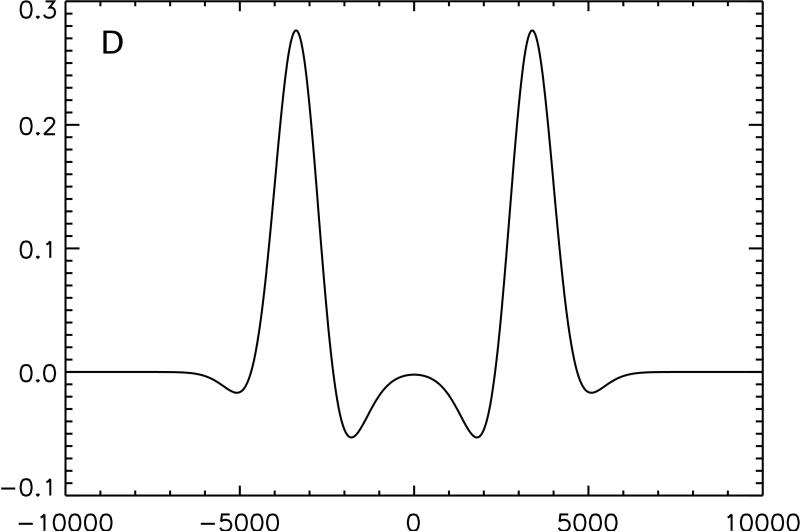
Our proposed method for measurement of inhomogeneous MT relies on an important characteristic of broad, homogeneous lines: Because the T2 decay is so rapid, the effect of applied RF power is to saturate the entire line in proportion to the applied RF power and the absorption spectrum of the line (22-24). In particular, the saturation effect of applying broad RF pulses or multiple frequency radiation can be calculated by multiplying the power spectrum of the RF irradiation by the absorption spectrum. If the homogeneous line is symmetric, the effect of applying single frequency irradiation at frequency f, should be identical to that obtained by applying irradiation at both frequency f and –f with the same total power. Since it will be zero for homogeneous lines, the difference between the single frequency and dual frequency MT experiment can be used as an indicator of magnetization transfer from inhomogeneous lines (Fig. 1).
Figure 1.
Conceptual illustration of the irradiation strategy employed in this study. The effect on an inhomogeneously broadened line of off-resonance irradiation applied solely at positive frequency, A, and negative frequency, B, is compared with the same off-resonance power equally divided between positive and negative frequency, C. Because the single frequency irradiation saturates a section of the full spectrum, subtraction of twice the dual frequency irradiated line from the sum of the two single frequency lines yields a residual difference in magnetization, D. Transfer of this magnetization to the free water pool causes a detectable change in signal.
Unfortunately, the MT spectrum can be slightly asymmetric (25). Small chemical shifts of the broad component, along with frequency offsets due to non-uniform magnetic fields and center frequency miss-calibration, can cause differences between MT from positive and negative irradiation. Using the average of single frequency MT images acquired at positive and negative frequencies in the IHMT subtraction, however, provides first order correction for this offset error.
METHODS
Human Studies
Imaging was performed at 3 Tesla on a GE VH/I imager (GE Healthcare Technologies, Waukeshau WI) using the product quadrature head coil. Following a rapid gradient echo localizer, a single 6mm thick axial slice was selected at approximately mid ventricle. MR images were acquired with a low flip angle fast spin echo sequence as previously described (26). The sequence parameters were: FOV 24×18cm; matrix 128×96; effective TE of 19.8ms; bandwidth of 16kHz; full centric phase encoding with the first two echoes skipped and an asymptotic flip angle of 60°. T2 decay during the relatively long echo train caused some blurring of the images along the phase direction that reduced the true resolution relative to the nominal resolution of 1.9mm. Images were reconstructed offline as magnitude images.
Two separate studies were performed in different groups of volunteers. The first was a series of MR acquisitions from 4 normal subjects (2 female), of mean age 29, with rapidly repeated Gaussian pulses for MT preparation prior to image acquisition. The second employed continuous wave (CW) RF irradiation for 1s (prior to acquisition) in 3 subjects (1 female), of mean age 39, to determine if pulse specific parameters were at all responsible for the observed signals. All studies were performed following a protocol approved by the institutional committee on clinical investigations and written informed consent was obtained from all volunteers.
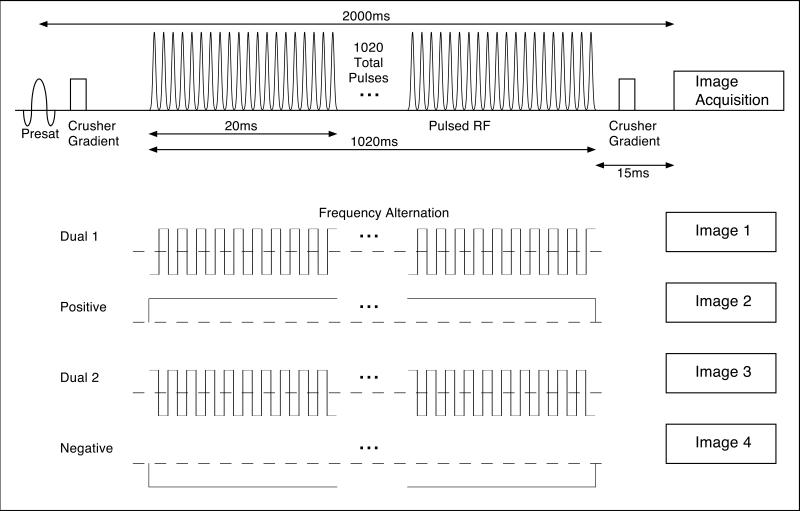
In the pulsed study(Fig. 2), MT preparation was achieved with 336μs FWHM Gaussian shaped pulses applied at 1ms intervals. For a given magnitude of frequency offset, three different images were acquired: The first used pulses all applied at the positive frequency (POS), a second image from pulses at the negative frequency (NEG), and lastly alternating positive and negative frequency pulses (BOTH). 32 images were acquired for each scan: 8 POS, 8 NEG, and 16 alternating frequency preparations interleaved in time over the 2.5 minute scan. Although in theory, the POS and NEG images should be equal in cases of homogeneous broadening, slight differences in MT will result from asymmetry in the line. Thus both POS and NEG images were used in calculation of inhomogeneous MT. A frequency offset of +150Hz was also added to minimize MT asymmetry (27,28).
Figure 2.
A schematic drawing of the pulse sequence used for pulsed IHMT imaging. A nonselective saturation 2 seconds before imaging is followed by a train of off-resonance Gaussian RF pulses applied for up to 1020ms. Image acquisition with a single shot RARE sequence is performed after a brief 15 ms wait to allow for gradient crushing and decay of any transients. Acquisition of images with alternating frequency MT pulses is interleaved with acquisition of single frequency MT images.
For all the MT experiments, nonselective saturation was applied 2 seconds before imaging to decrease artifacts from pulsating CSF and a crusher gradient was applied following the MT pulses and before imaging. Pulsed experiments (Fig. 2) were conducted with a total duration for the MT preparation of 1020ms applied at a 5kHz frequency offset with peak B1 amplitudes of 0, 30, 45, 60, 80, and 100mG, and at peak B1 of 80mG at frequency offsets of 12, 9, 7, 5, 4, and 3kHz. Finally images were acquired with frequency offset of 5 kHz, peak B1 of 80mG, and MT total durations of 68, 204, 408, 612, and 1020ms.
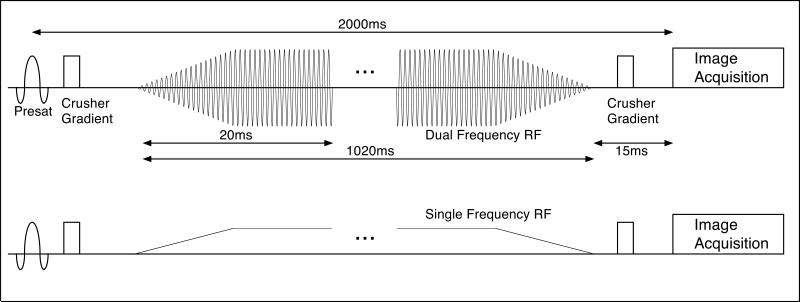
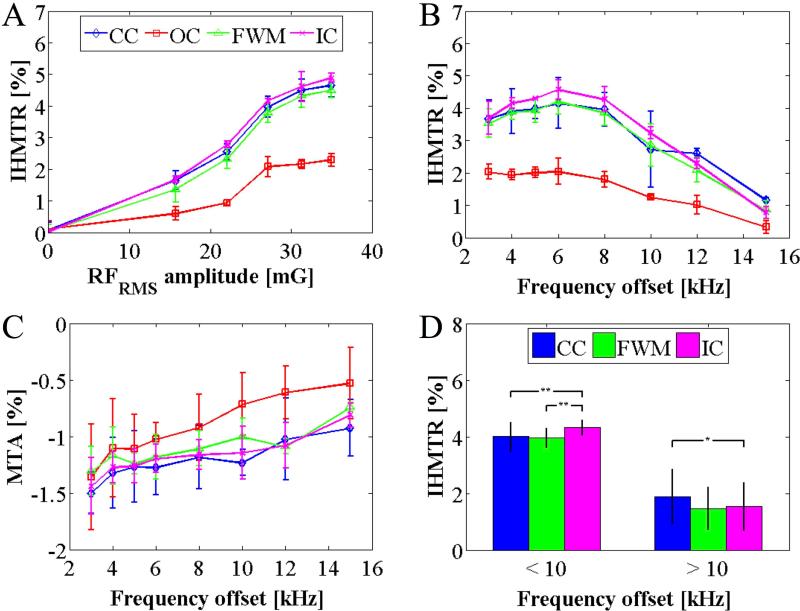
In the CW irradiation experiments (Fig. 3), RF was again applied in a series of three strategies: all POS, all NEG, or simultaneously at both, with equal average power. Simultaneous irradiation at both frequencies was achieved by cosine modulation. Small residual carrier leakage at the water frequency was avoided by shifting of the amplitude envelope center frequency by 200Hz with a linear ramp phase modulation and then re-centering with frequency modulation. To avoid transients at the beginning and end of the CW irradiation, the RF envelope was ramped up and down over 10ms. As for the pulsed MT studies, 8 POS, 8 NEG and 16 BOTH images were acquired with a TR of 5 seconds. Images were acquired for an offset frequency of 5kHz with RFRMS amplitudes of 0, 15.7, 22.1, 27.1, 31.3, and 35mG. Images were also acquired at the fixed RFRMS amplitude of 31.3mG and frequency offsets of 15, 12, 10, 8, 6, 5, 4, and 3kHz.
Figure 3.
A schematic drawing of the pulse sequence used for continuous IHMT imaging. A nonselective saturation 2 seconds before imaging is followed by a continuous off-resonance RF irradiation applied for up to 1020ms. The RF power is ramped up and down over 10ms at the beginning and end of the irradiation to minimize broadband transients. Dual frequency irradiation is achieved with sinusoidal modulation of the RF envelope. Image acquisition with a single shot RARE sequence is performed after a brief 15 ms wait to allow for gradient crushing and decay of any transients. Acquisition of images with dual frequency MT irradiation is interleaved with acquisition of single frequency MT images.
Image data were reconstructed using custom software implemented in IDL (Exelis Visual Information Solutions, Boulder CO), and were analyzed in MATLAB (Mathworks, Cambridge MA). Within subject images were registered using the Medical Image Registration Toolbox (29). Regions of interest (ROIs) were drawn in the splenium of the corpus callosum, CC, in the left frontal white matter, FWM, in the posterior limb of the internal capsule, IC, and the occipital calcarine cortex, OC, i.e. gray matter (GM) (Fig. 4e). The data acquired with peak B1/RFRMS=0mG were used as baseline, unsaturated images to form a quantitative ratio of the MT effect. Images and regional average values for the following quantities were calculated: The mean signal intensity in the baseline image, Mb, the standard magnetization difference MTD = Mb-(POS+NEG)/2, the magnetization transfer ratio, MTR= 1-(POS+NEG)/2Mb, the MT asymmetry MTA = (NEG-POS)/Mb, the newly defined inhomogeneous MT difference IHMTD = POS+NEG-2xBOTH and the inhomogeneous MT ratio, IHMTR=(POS+NEG-2xBOTH)/Mb. Means and standard deviations were calculated across subjects for the regional values.
Figure 4.
Example images (without registration) of a volunteer from the pulsed MT experiments at 5kHz frequency offset and peak B1=100mG. The relatively short TE and moderate TR RARE sequence used for acquisition provided an approximate proton density contrast in the absence of MT saturation (A). As expected, pulsed off-resonance irradiation caused substantial attenuation of signal in brain tissue (B). MTRs exceeded 50% at a relatively high RF amplitude and small frequency offset (C). The IHMT difference and ratio images showed prominent, detectable WM/GM contrast with higher signal from white matter (D,E). By contrast, the MT asymmetry was immeasurably small, due to the small frequency offset added to the MT irradiation (F). White arrows in B and D indicate scalp signal present in the MT difference image, B, but not the IHMT difference image, D.
Phantom Study
Imaging was also performed in a phantom consisting of several rows of tubes containing deionized water doped with different concentrations of MnCl, a row containing heat denatured ovalbumin, and a row containing TRESemme® (Unilever PLC, Londo) hair conditioner. Hair conditioners contain fatty alcohols in a lamellar structure that can approximate the MT properties of neural tissues(30).
Phantom IHMT data were acquired in a similar manner to the pulsed in vivo experiments, but after a system upgrade when long pulses were no longer permitted by the RF amplifier. RF irradiation was instead performed with 500us Hanning shaped pulses applied at 1.5ms intervals and a single-shot FSE (ssFSE) acquisition for imaging. MT preparation was applied at 5kHz frequency offset, at a peak B1 of 80mG for 1020ms prior to ssFSE imaging with the following parameters: FOV 24×18cm; matrix 128×96; effective TE of 29.1ms; 6mm slice thickness.
Maps of T2 were produced based on the ssFSE sequence used to acquire IHMT phantom data: TR=10s. Images were acquired at effective TEs of 29.1, 45.8, 74.9, 124.8; and 203.8ms, with the signal fit in a least-squares manner on a pixel-by-pixel basis to the monoexponential decay as previously described(31). Reduced refocusing flip angles in the ssFSE sequence likely caused overestimation of T2(26), but the measurement served to display the range of T2's studied.
RESULTS
The relatively short TE and moderate TR fast spin echo sequence used for acquisition provides an approximate proton density contrast (Fig. 4a). As expected, pulsed off-resonance irradiation caused substantial attenuation of signal in brain tissue (Fig. 4b). MTRs exceeded 50% at a relatively high RF amplitude and small frequency offset (Fig. 4c). In the pulsed MT study, the IHMT difference and ratio images showed prominent, detectable WM/GM contrast with higher signal from white matter (Fig. 4d-e). By contrast, the MT asymmetry was immeasurably small, due to the small frequency offset added to the MT irradiation (Fig. 4f).
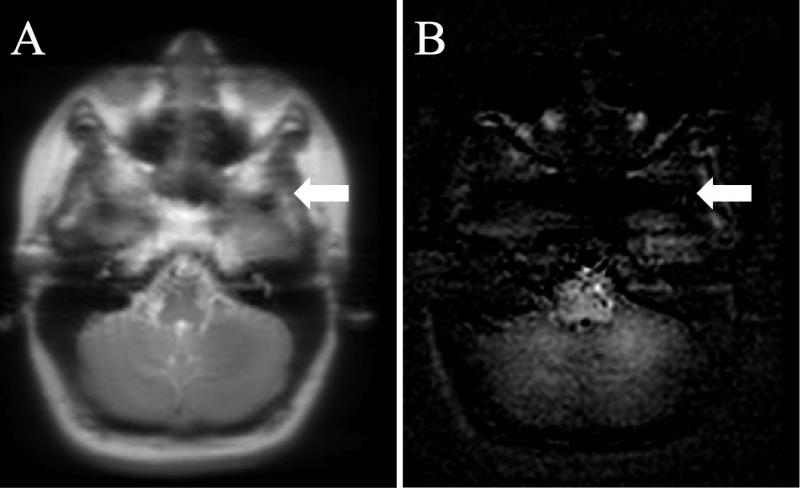
The IHMTD images appear specific to tissues containing myelin based on negligible signal from the scalp; this was particularly evident from comparison with the MTD image of the same slice (white arrows in Figs. 4b, and 4d). In addition, acquisition of IHMT data from a slice through the brainstem showed continued signal mostly from grey and white matter, whilst the surrounding tissue (based on a reference image) provided negligible signal (Fig. 5).
Figure 5.
Reference image and corresponding IHMT difference image in the brainstem of a volunteer. Tissues outside of the brain, as indicated, for example, by the white arrow, show little detectable signal compared to brainstem white matter.
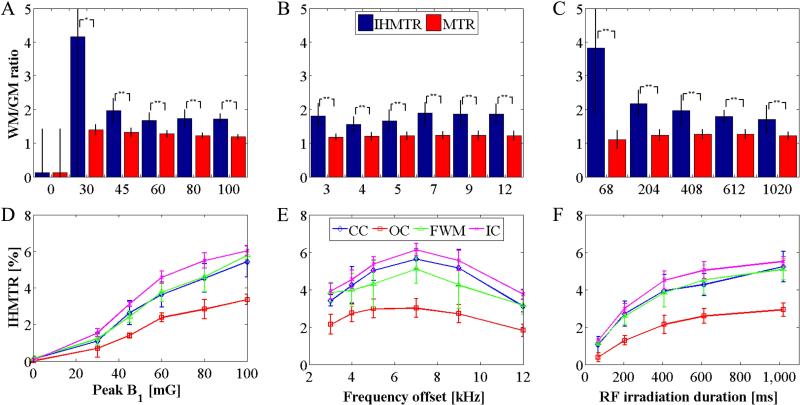
The WM/GM ratio, based on WM from the CC, FWM, IC, and GM from the OC, was significantly higher (p ≤ 0.05) in IHMTR than from traditional MTR images (Figs. 6a-c). This result was observed across all RF powers, frequency offsets and durations, apart from in the case of negligible signal at peak B1 = 0mG.
Figure 6.
Mean WM/GM ratios and IHMTR across the 3 WM ROIs and 4 volunteers in the pulsed experiments. MTR and IHMT ratios are plotted at varying peak B1, (A), frequency offset, (B), and the duration of the RF saturation preparation, (C), with error bars of standard deviation across subjects. Results from one-tail, paired student T-tests illustrate significance (*p < 0.05; **p < 0.01). Mean IHMTR as a function of the peak B1, (D), frequency offset, (E), and the duration of the RF saturation preparation, (F), with error bars of standard deviation in average IHMTR over subjects are also shown. In all cases, the IHMTR measured within the ROI in gray matter (OC, red squares) is smaller than that from ROIs in white matter (CC, blue diamonds; FWM, green triangles; IC, purple crosses).
Maximum IHMTR in WM was (6.1±0.3)%. At a fixed offset frequency of 5kHz, pulsed IHMTR increased with applied RF power but appeared to approach a plateau (Fig. 6d). IHMT ratios reached a maximum at 7kHz frequency offset for all ROIs (Fig. 6e). IHMT increased rapidly with duration of irradiation and appeared to reach equilibrium in 600ms (Fig. 6f).
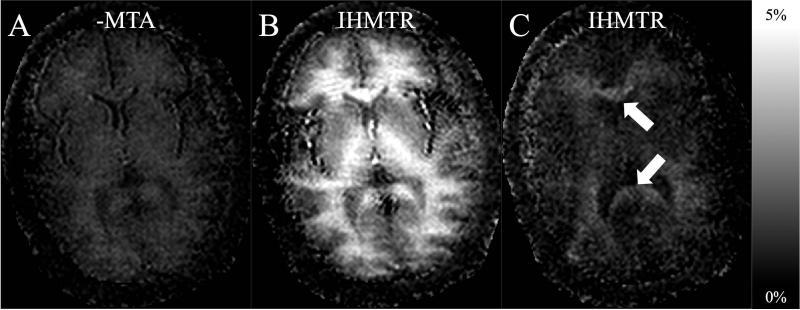
Analysis of CW off-resonance irradiation produced similar results to those from the pulsed experiments. The IHMT spectrum and amplitude response were similar (Figs. 7a-b). Because no frequency offset was employed, an estimate of the MT asymmetry was also obtained (Fig. 7c), whose spectrum did not show the apex feature as observed for IHMTR. A comparison between MTA and IHMTR maps from data acquired at the same frequency offset showed little similarity in contrast (Fig. 8). From a 15 kHz off-resonance irradiation IHMTR map (Fig. 8c), there is some suggestion of angular anisotropy with weak signal apparent in corpus callosum but not in the internal capsule. Further evidence comes from the plot of IHMTR as a function of frequency offset (Fig. 7b), in which the IHMTR from the CC was significantly lower than that in the IC below 10kHz, but was higher above this frequency offset (Fig. 7d).
Figure 7.
RF power and frequency dependence of IHMT and MT asymmetry from the continuous wave studies. Average IHMTR values, across the 3 volunteers from ROIs in calculated quantitative maps, as a function of RFRMS irradiation intensity, (A), and frequency offset, (B), and also MT asymmetry as a function of frequency offset, (C), are plotted. Averaging of the IHMTR data from WM ROIs at frequency offsets below and above 10kHz shows significant differences using one-tailed, paired student T-tests (*p < 0.05; **p < 0.01), D. Error bars represent the standard deviation in the average value (from ROIs) across the volunteers.
Figure 8.
Example maps from a volunteer in the CW experiments, provide visual comparison of the MT asymmetry, A, and IHMT, B, at a 6kHz frequency offset and RFRMS=32.3mG. An IHMTR map, C, at the highest frequency offset (15kHz) shows higher signal in the corpus callosum (white arrows) where axons tend to lie perpendicular to the main field.
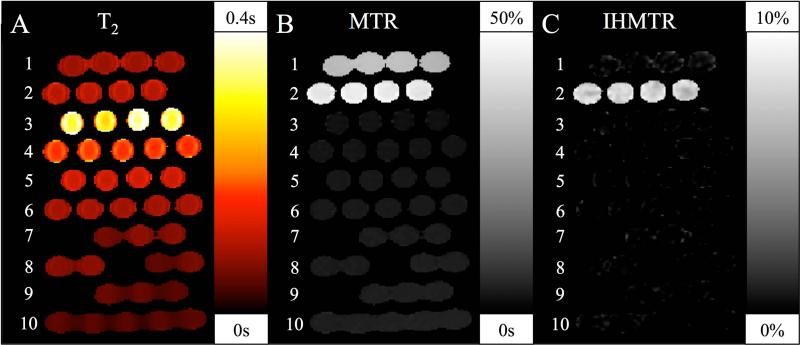
The phantom experiment confirmed the hypothesized selectivity of IHMT for specific tissues (Fig. 9). The absence of IHMT in MnCl doped phantoms spanning the range of tissue T2's invivo confirms that the IHMT effect is not an artifact related to direct saturation. The absence of significant IHMT in the heat denatured ovalbumin despite the presence of high MT signal supports the selectivity of the IHMT for particular tissues. IHMTR comparable to human white matter values was observed in the hair conditioner specimen, a mixture with many molecular and structural similarities to white matter(30).
Figure 9.
T2, MTR, and IHMTR measurements in a phantom using a pulsed IHMT sequence. Tubes containing heat denatured ovalbumin, row 1, hair conditioner, row 2, and solutions with increasing concentrations of MnCl in deionized water, rows 3-10, were arrayed in a Styrofoam holder. Measured T2 (A), MTR(B), and IHMTR (C) are shown. A slight indication of direct saturation effects on MTR is apparent in the shortest T2 phantoms, row 13, but no direct IHMT effects are apparent. Heat denatured ovalbumin shows substantial MT but negligible IHMT. Only hair conditioner, with a molecular and lamellar structure similar to membranes, shows significant IHMT.
DISCUSSION
These results demonstrate that a component of magnetization transfer in the brain originates from molecules with broad lineshape that is not homogeneously broadened on the timescale of RF saturation with clinically relevant RF power. A simple subtraction method is capable of generating images representative of this inhomogeneous magnetization transfer (Fig. 1), and these images show high WM contrast (Figs. 4, 5 and 8) compared to that from regular MT. An average 2.1:1 ratio between the white/gray matter IHMTRs is consistent in the results from ROI analysis of the pulsed and CW experiments at various RF preparation strengths, frequency offsets, and durations (Figs. 4, 6, and 7).
Several characteristics of the lines contributing to observed IHMT can be inferred from the measured results. First, the wide spectrum of IHMT, peaking at 7 kHz, almost certainly indicates the line is dipolar broadened. Chemical shift or magnetic field inhomogeneity effects are much too small to create such large frequency shifts. Field strength independent dipolar broadening is also supported by recent reports of similar IHMT at the lower field strength of 1.5 Tesla (32). Second, the similar amplitude of pulsed and continuous IHMT ratios suggests that the separate lines contributing to the broad inhomogeneous line are themselves broad, with T2's comparable to or shorter than the duration of the 336μs FWHM pulses.
The IHMT effect appears to be separate and unrelated to MT asymmetry. Differences between IHMT and MT asymmetry, which can be attributed to a chemical shift (27,28), are evident both visually and from quantitative analysis. IHMT is present whether a frequency offset to symmetrize MT is used, as in the pulsed experiment, or no offset is used, as in the CW experiment or as in (22). MTA shows little contrast between gray and white matter (Fig. 4e) whereas the IHMT data from the same CW experiment dataset shows strong contrast (Fig. 4f). Their frequency spectra also differ. WM IHMTR values in ROIs from the CW experimental data show a peak around 6kHz, whereas the MTA shows a decrease with frequency offset (Figs. 4b-c).
A similar strategy to the IHMT method proposed here has been explored for imaging of chemical exchange saturation transfer (CEST) from exchangeable lines to water(33). The CEST application uses much smaller frequency offsets and longer RF pulses to saturate the much narrower exchangeable resonances. Though the applications share experimental similarities, the CEST contribution to the IHMT reported here should be negligible because of the larger frequency offsets employed.
The results in this study do not directly address the source of this inhomogeneous magnetization transfer, but lipid membranes are a likely possibility (17,18). A broad line requires motion restriction to prevent motional narrowing, so large or bound molecules are required. Most large structural molecules such as proteins and collagen experience rapid spin diffusion that render absorption lines homogeneous on time scales of less than 100μs. On the other hand, methylene proton pairs, which represent the majority of protons in membrane lipids, may approximate two spin systems because conformational changes attenuate dipolar coupling and spin diffusion to other nearby protons (16,34). Though rotation around the normal to the membrane is rapid, the constraint to the surface of the membrane creates an average dipolar broadening and dipolar coupling that remains. Dipolar coupling of two spin systems creates two separate lines, symmetric around the proton center frequency. These lines can be separately saturated (15,16). The presence of IHMT in hair conditioner (Fig. 8), a lamellar structure containing long chains of methylene protons, provides additional support for rotationally restricted methylene protons as the origin of the IHMT effect.
Figure 6 suggests a relationship between the frequency spectrum of IHMT and the angular orientation of the tracts in the region measured. This is not surprising since inhomogeneously broadened dipolar lines result from angular dependence of the dipolar interaction. Molecules should be free to rotate perpendicular to the membrane surface, so the angle between the membrane surface and the main magnetic field will determine the dipolar shift. The greatest frequency shift will occur when the surface is parallel to the magnetic field. Because only axons nearly perpendicular to the magnetic field direction, as in the CC, will have part of their surface parallel to the field, these axons will show the most IHMT at large frequency offsets. This angular dependence is naturally weak because of the signal from an axon will result from the summation of angles around the cylindrical axon. Angular dependence may be undesirable when attempting to quantify myelin. It is likely that an optimal frequency offset will minimize anisotropy effects. Though these tract specific results are suggestive, more rigorous studies are required including varying frequency and power, measuring effects in different tracts and potentially obtaining images with different head or sample orientation.
If the IHMT component arises solely from fixed membrane lipids, then this signal may be an excellent indicator of myelin sheath density and status. Myelinated white matter has an exceptionally high membrane lipid content (35,36), with 2.9 times GM (close to the ihMTr WM/ihMTrGM ratio for the optimal frequency offset (fig 3e)), 4.6 times liver, and 14.9 times skeletal muscle lipids (calculated from columns 3 and 4 of Table II in Folch et al. (37)). An indicator of myelin density would be useful for research and clinical evaluation of demyelinating disease and its treatment. Techniques based on multi-component T2 (38) and ultra-short TE (39) have been explored for myelin characterization, but their acquisition and analysis are substantially more complicated than the IHMT ratio. While the actual IHMT signal difference of 6% is small (3% when considering the contribution from either the positive or negative frequency offset separately), it is comparable to the largest signal obtainable with blood oxygenation level dependent contrast. Improved imaging sequences with greater spatial coverage and reduced motion sensitivity to enable clinical applications of IHMT are currently in development.
CONCLUSIONS
The IHMT technique proposed provides images that appear more specific to myelin containing tissues. The method is based on magnetization transfer, but measurements of IHMTR provide significantly different WM/GM ratios from regular MT and its spectral profile is distinct from MTA. Features such as an axonal angular dependency warrant further study, and investigation of the myelin specific IHMT contrast in related pathologies is merited.
ACKNOWLEDGEMENTS
This work was supported in part by the United States National Institutes of Health through grant NS047029-05 and the Congressionally Directed Medical Research Programs of the United States Department of Defense through contract # W81XWH-10-1-0713.
REFERENCES
- 1.Wolff SD, Balaban RS. Magnetization transfer contrast (MTC) and tissue water proton relaxation in vivo. Magn Reson Med. 1989;10(1):135–144. doi: 10.1002/mrm.1910100113. [DOI] [PubMed] [Google Scholar]
- 2.Henkelman RM, Stanisz GJ, Graham SJ. Magnetization transfer in MRI: a review. NMR Biomed. 2001;14(2):57–64. doi: 10.1002/nbm.683. [DOI] [PubMed] [Google Scholar]
- 3.Bagley LJ, McGowan JC, Grossman RI, Sinson G, Kotapka M, Lexa FJ, Berlin JA, McIntosh TK. Magnetization transfer imaging of traumatic brain injury. J Magn Reson Imaging. 2000;11(1):1–8. doi: 10.1002/(sici)1522-2586(200001)11:1<1::aid-jmri1>3.0.co;2-h. [DOI] [PubMed] [Google Scholar]
- 4.Ropele S, Fazekas F. Magnetization transfer MR imaging in multiple sclerosis. Neuroimaging Clin N Am. 2009;19(1):27–36. doi: 10.1016/j.nic.2008.09.004. [DOI] [PubMed] [Google Scholar]
- 5.Vrenken H, Pouwels PJ, Ropele S, Knol DL, Geurts JJ, Polman CH, Barkhof F, Castelijns JA. Magnetization transfer ratio measurement in multiple sclerosis normal-appearing brain tissue: limited differences with controls but relationships with clinical and MR measures of disease. Mult Scler. 2007;13(6):708–716. doi: 10.1177/1352458506075521. [DOI] [PubMed] [Google Scholar]
- 6.Vavasour IM, Laule C, Li DK, Traboulsee AL, MacKay AL. Is the magnetization transfer ratio a marker for myelin in multiple sclerosis? J Magn Reson Imaging. 2011;33(3):713–718. doi: 10.1002/jmri.22441. [DOI] [PubMed] [Google Scholar]
- 7.Berry I, Barker GJ, Barkhof F, Campi A, Dousset V, Franconi JM, Gass A, Schreiber W, Miller DH, Tofts PS. A multicenter measurement of magnetization transfer ratio in normal white matter. J Magn Reson Imaging. 1999;9(3):441–446. doi: 10.1002/(sici)1522-2586(199903)9:3<441::aid-jmri12>3.0.co;2-r. [DOI] [PubMed] [Google Scholar]
- 8.Gloor M, Scheffler K, Bieri O. Quantitative magnetization transfer imaging using balanced SSFP. Magn Reson Med. 2008;60(3):691–700. doi: 10.1002/mrm.21705. [DOI] [PubMed] [Google Scholar]
- 9.Samsonov A, Alexander AL, Mossahebi P, Wu YC, Duncan ID, Field AS. Quantitative MR imaging of two-pool magnetization transfer model parameters in myelin mutant shaking pup. Neuroimage. 2012;62(3):1390–1398. doi: 10.1016/j.neuroimage.2012.05.077. [DOI] [PMC free article] [PubMed] [Google Scholar]
- 10.Schmierer K, Tozer DJ, Scaravilli F, Altmann DR, Barker GJ, Tofts PS, Miller DH. Quantitative magnetization transfer imaging in postmortem multiple sclerosis brain. J Magn Reson Imaging. 2007;26(1):41–51. doi: 10.1002/jmri.20984. [DOI] [PMC free article] [PubMed] [Google Scholar]
- 11.Sled JG, Pike GB. Quantitative imaging of magnetization transfer exchange and relaxation properties in vivo using MRI. Magn Reson Med. 2001;46(5):923–931. doi: 10.1002/mrm.1278. [DOI] [PubMed] [Google Scholar]
- 12.Underhill HR, Rostomily RC, Mikheev AM, Yuan C, Yarnykh VL. Fast bound pool fraction imaging of the in vivo rat brain: association with myelin content and validation in the C6 glioma model. Neuroimage. 2011;54(3):2052–2065. doi: 10.1016/j.neuroimage.2010.10.065. [DOI] [PMC free article] [PubMed] [Google Scholar]
- 13.Yarnykh VL, Yuan C. Cross-relaxation imaging reveals detailed anatomy of white matter fiber tracts in the human brain. Neuroimage. 2004;23(1):409–424. doi: 10.1016/j.neuroimage.2004.04.029. [DOI] [PubMed] [Google Scholar]
- 14.Bloembergen N, Purcell EM, Pound RV. Relaxation Effects in Nuclear Magnetic Absorption. Phys Rev. 1948;73(7):679–712. [Google Scholar]
- 15.Opella SJ. Structure Determination of Membrane Proteins in Their Native Phospholipid Bilayer Environment by Rotationally Aligned Solid-State NMR Spectroscopy. Acc Chem Res. 2013;46(9):2145–2153. doi: 10.1021/ar400067z. [DOI] [PMC free article] [PubMed] [Google Scholar]
- 16.Huster D, Yao X, Hong M. Membrane protein topology probed by (1)H spin diffusion from lipids using solid-state NMR spectroscopy. J Am Chem Soc. 2002;124(5):874–883. doi: 10.1021/ja017001r. [DOI] [PubMed] [Google Scholar]
- 17.Chan SI, Feigenson GW, Seiter CHA. Nuclear Relaxation Studies of Lecithin Bilayers. Nature. 1971;231(5298):110–112. doi: 10.1038/231110a0. [DOI] [PubMed] [Google Scholar]
- 18.Chan SI, Sheetz MP, Seiter CHA, Feigenson GW, Hsu M, Lau A, Yau A. Nuclear Magnetic-Resonance Studies of Structure of Model Membrane Systems - Effect of Surface Curvature. Ann NY Acad Sci. 1973;222:499–522. doi: 10.1111/j.1749-6632.1973.tb15283.x. [DOI] [PubMed] [Google Scholar]
- 19.Bloom M, Burnell EE, Roeder SBW, Valic MI. Nuclear Magnetic-Resonance Line-Shapes in Lyotrophic Liquid-Crystals and Related Systems. J Chem Phys. 1977;66(7):3012–3020. [Google Scholar]
- 20.Wennerstrom H, Lindblom G. Biological and Model Membranes Studied by Nuclaer Magnetic-Resonance of Spin One Half Nuclei. Q Rev Biophys. 1977;10(1):67–96. doi: 10.1017/s0033583500000147. [DOI] [PubMed] [Google Scholar]
- 21.Horch RA, Gore JC, Does MD. Origins of the ultrashort-T2 1H NMR signals in myelinated nerve: a direct measure of myelin content? Magn Reson Med. 2011;66(1):24–31. doi: 10.1002/mrm.22980. [DOI] [PMC free article] [PubMed] [Google Scholar]
- 22.Graham SJ, Henkelman RM. Quantifying the Magnetization Transfer Produced by RF Irradiation with Multiple Frequency Components.. Proceedings of the 4th Annual Meeting of the ISMRM; New York, NY USA. 1996.p. 469. [Google Scholar]
- 23.Graham SJ, Henkelman RM. Understanding pulsed magnetization transfer. J Magn Reson Imaging. 1997;7(5):903–912. doi: 10.1002/jmri.1880070520. [DOI] [PubMed] [Google Scholar]
- 24.Henkelman RM, Huang X, Xiang QS, Stanisz GJ, Swanson SD, Bronskill MJ. Quantitative interpretation of magnetization transfer. Magn Reson Med. 1993;29(6):759–766. doi: 10.1002/mrm.1910290607. [DOI] [PubMed] [Google Scholar]
- 25.Pekar J, Jezzard P, Roberts DA, Leigh JS, Jr., Frank JA, McLaughlin AC. Perfusion imaging with compensation for asymmetric magnetization transfer effects. Magn Reson Med. 1996;35(1):70–79. doi: 10.1002/mrm.1910350110. [DOI] [PubMed] [Google Scholar]
- 26.Alsop DC. The sensitivity of low flip angle RARE imaging. Magn Reson Med. 1997;37(2):176–184. doi: 10.1002/mrm.1910370206. [DOI] [PubMed] [Google Scholar]
- 27.Hua J, Jones CK, Blakeley J, Smith SA, van Zijl PC, Zhou J. Quantitative description of the asymmetry in magnetization transfer effects around the water resonance in the human brain. Magn Reson Med. 2007;58(4):786–793. doi: 10.1002/mrm.21387. [DOI] [PMC free article] [PubMed] [Google Scholar]
- 28.Swanson SD, Pang Y. MT is symmetric but shifted with respect to water.. Proceedings of the 11th Annual Meeting of the ISMRM; Toronto, CA. 2003.p. 660. [Google Scholar]
- 29.Myronenko A, Song XB. Intensity-Based Image Registration by Minimizing Residual Complexity. IEEE Trans Med Imaging. 2010;29(11):1882–1891. doi: 10.1109/TMI.2010.2053043. [DOI] [PubMed] [Google Scholar]
- 30.Swanson SD, Malyarenko DI, Schmiedlin-Ren P, Adler J, Helvie K, Reingold L, Al-Hawary MM, Zimmerman E. Lamellar liquid crystal phantoms for MT- calibration and quality control in clinical studies.. Proceedings of the 20th Annual Meeting of the ISMRM; Melbourne. 2012.p. 1378. [Google Scholar]
- 31.de Bazelaire CM, Duhamel GD, Rofsky NM, Alsop DC. MR imaging relaxation times of abdominal and pelvic tissues measured in vivo at 3.0 T: preliminary results. Radiology. 2004;230(3):652–659. doi: 10.1148/radiol.2303021331. [DOI] [PubMed] [Google Scholar]
- 32.Girard OM, Callot V, Vignaud A, Varma G, Cozzone PJ, Alsop DC, Duhamel G. Specific Inhomogeneous MT Contrast in White Matter. Application to Spinal Cord Imaging.. Proceedings of the 21st Annual Meeting of the ISMRM; Salt Lake City, UT USA. 2013.p. 2506. [Google Scholar]
- 33.Scheidegger R, Vinogradov E, Alsop DC. Amide proton transfer imaging with improved robustness to magnetic field inhomogeneity and magnetization transfer asymmetry using saturation with frequency alternating RF irradiation. Magn Reson Med. 2011;66(5):1275–1285. doi: 10.1002/mrm.22912. [DOI] [PMC free article] [PubMed] [Google Scholar]
- 34.Seiter CHA, Chan SI. Molecular Motion in Lipid Bilayers - Nuclear Magnetic-Resonance Line-Width Study. J Am Chem Soc. 1973;95(23):7541–7553. [Google Scholar]
- 35.Dietschy JM, Turley SD. Cholesterol metabolism in the brain. Curr Opin Lipidol. 2001;12(2):105–112. doi: 10.1097/00041433-200104000-00003. [DOI] [PubMed] [Google Scholar]
- 36.O'Brien JS, Sampson EL. Lipid composition of the normal human brain: gray matter, white matter, and myelin. J Lipid Res. 1965;6(4):537–544. [PubMed] [Google Scholar]
- 37.Folch J, Lees M, Sloane Stanley GH. A simple method for the isolation and purification of total lipides from animal tissues. J Biol Chem. 1957;226(1):497–509. [PubMed] [Google Scholar]
- 38.MacKay A, Whittall K, Adler J, Li D, Paty D, Graeb D. In vivo visualization of myelin water in brain by magnetic resonance. Magn Reson Med. 1994;31(6):673–677. doi: 10.1002/mrm.1910310614. [DOI] [PubMed] [Google Scholar]
- 39.Wilhelm MJ, Ong HH, Wehrli SL, Li C, Tsai PH, Hackney DB, Wehrli FW. Direct magnetic resonance detection of myelin and prospects for quantitative imaging of myelin density. Proc Natl Acad Sci U S A. 2012;109(24):9605–9610. doi: 10.1073/pnas.1115107109. [DOI] [PMC free article] [PubMed] [Google Scholar]


