

Abstract
Live imaging of transcription and RNA dynamics has been successful in cultured cells and tissues of vertebrates but is challenging to accomplish in vivo. The zebrafish offers important advantages to study these processes – optical transparency during embryogenesis, genetic tractability and rapid development. Therefore, to study transcription and RNA dynamics in an intact vertebrate organism, we have adapted the MS2 RNA-labeling system to zebrafish. By using this binary system to coexpress a fluorescent MS2 bacteriophage coat protein (MCP) and an RNA of interest tagged with multiple copies of the RNA hairpin MS2-binding site (MBS), live-cell imaging of RNA dynamics at single RNA molecule resolution has been achieved in other organisms. Here, using a Gateway-compatible MS2 labeling system, we generated stable transgenic zebrafish lines expressing MCP, validated the MBS-MCP interaction and applied the system to investigate zygotic genome activation (ZGA) and RNA localization in primordial germ cells (PGCs) in zebrafish. Although cleavage stage cells are initially transcriptionally silent, we detect transcription of MS2-tagged transcripts driven by the βactin promoter at ∼3-3.5 h post-fertilization, consistent with the previously reported ZGA. Furthermore, we show that MS2-tagged nanos3 3′UTR transcripts localize to PGCs, where they are diffusely cytoplasmic and within larger cytoplasmic accumulations reminiscent of those displayed by endogenous nanos3. These tools provide a new avenue for live-cell imaging of RNA molecules in an intact vertebrate. Together with new techniques for targeted genome editing, this system will be a valuable tool to tag and study the dynamics of endogenous RNAs during zebrafish developmental processes.
Keywords: In vivo RNA labeling, Transcription, MS2, Transgenic zebrafish
Summary: An easily-applied MS2 labeling system in zebrafish allows the visualization of RNA localization in germline stem cells and zygotic genome activation in vivo.
INTRODUCTION
Given the vital roles coding and noncoding RNAs play in cell biology, it is not surprising that regulatory mechanisms coordinate every step of RNA metabolism, from transcription to translational capacity and, ultimately, degradation (Garneau et al., 2007; Holt and Bullock, 2009). To fully understand RNA regulation as it occurs in vivo requires detection and visualization of RNA in the living organism. Many tools have been used to study RNA dynamics in cell culture (Armitage, 2011; Santangelo et al., 2012); however, they have yet to be widely extended to studies in living vertebrates. One tool, the MS2 RNA-labeling system, based on the high-affinity binding of the bacteriophage MS2 coat protein (MCP) to its RNA hairpin binding site (MBS), has been used in model organisms (Bertrand et al., 1998; Belaya and St Johnston, 2011; Lionnet et al., 2011). By labeling a gene of interest with multiple copies of MBS and coexpressing a fluorescent MCP, live-cell imaging of RNA dynamics with single RNA molecule resolution is possible (Hocine et al., 2013). Tagging the fluorescent MCP with a nuclear localization signal (NLS) primes the MCP for interactions with nascent RNAs in the nucleus and reduces cytoplasmic background fluorescence, allowing enhanced visualization of cytoplasmic transcripts. This method has been used to study Drosophila oogenesis (Belaya and St Johnston, 2011) and embryogenesis (van Gemert et al., 2009), trafficking in Xenopus oocytes (Gagnon et al., 2013) and recently in brain slices of mice (Park et al., 2014) but has not been applied to vertebrate development. We have developed and applied a Gateway-based MS2-MCP system (Hartley et al., 2000; Walhout et al., 2000; Kwan et al., 2007; Villefranc et al., 2007) for the easy generation of expression vectors and stable transgenic zebrafish lines expressing fluorescent MCPs (FP-MCP). We have validated its use in zebrafish and have used it to study the onset of zygotic βactin transcription and nanos3 localization in PGCs. Together with established methods of transgenesis and mutagenesis, these tools should facilitate future studies of RNA regulation in living vertebrates.
RESULTS AND DISCUSSION
Transgenic NLS-tdMCP-GFP lines
We developed a set of Gateway-compatible plasmids to facilitate generation of MCP expression vectors (Fig. 1A). Using these plasmids and Tol2-mediated transgenesis (Kawakami et al., 1998, 2004; Kawakami, 2007), we generated stable transgenic zebrafish lines expressing MCP as a tandem dimer (tdMCP) (Wu et al., 2012) fused to a NLS and eGFP under the control of the ubiquitous βactin (Higashijima et al., 1997) and inducible hsp70 (Halloran et al., 2000) promoters (supplementary material Fig. S1). In all lines, the labeled cells displayed the expected nuclear fluorescence with minimal cytoplasmic background (supplementary material Fig. S1).
Fig. 1.

Transgenic zebrafish lines expressing NLS-tdMCP-eGFP can be used to detect transcripts in vivo. (A) Gateway compatible vectors for generation of NLS-tdMCP-FP and MS2-tagged RNAs. Plasmids used to generate transgenic lines by Tol2-mediated transgenesis are shown. 5′ Entry plasmids (p5E) containing the desired promoter elements can be recombined with NLS-tdMCP-eGFP or NLS-tdMCP-tagRFP entry plasmids (pME) for expression in any cell type or tissue. Similarly, the pME-NLS-tdMCP plasmid can be recombined with any in-frame fluorescent protein (FP) in a 3′ entry plasmid (p3E) to make custom NLS-tdMCP-FPs. RNA localization elements (LE) can be tagged with cherry-24xMBS by recombining the appropriate pME and p3E plasmids. (B) Schematic of the experiment used to validate in vivo MS2-MCP interactions. (C-E) Live imaging of embryos at the sphere stage shows that cytoplasmic puncta are visible only in cells expressing the Cherry reporter. In some cases, as shown in C, the Cherry reporter aggregates, but does not overlap with MCP-GFP cytoplasmic puncta, suggesting that this is independent of the MS2-MCP interaction. The dotted line denotes borders of cells expressing Cherry reporter. Scale bar: 10 µm.
Validation of MCP-MBS interaction in zebrafish
To validate and test the feasibility of this system to visualize RNA molecules in zebrafish, we transiently and mosaically expressed cherry RNA tagged with MS2 hairpins using the βactin promoter (βactin:cherry-24xMBS) by injecting DNA into Tg(βactin:NLS-tdMCP-GFP) lines (Fig. 1B). Live imaging of zebrafish embryos revealed tdMCP-GFP cytoplasmic puncta in cells expressing the Cherry protein (Fig. 1C-E), likely representing cherry-24xMBS RNA species, as previously reported in other systems (Bertrand et al., 1998; van Gemert et al., 2009; Lionnet et al., 2011; Schonberger et al., 2012; Gagnon et al., 2013; Park et al., 2014). Furthermore, time-lapse analysis of these cells revealed highly dynamic cytoplasmic puncta (supplementary material Movies 1 and 2) that were not detected in neighboring cells lacking the Cherry reporter (n=43 cells; 6 embryos). These experiments suggested that MS2-RNA labeling is feasible in zebrafish.
Visualization of zygotic genome activation
An advantage of MS2 labeling is the ability to track transcripts throughout their lifetime, because nuclear puncta appear soon after transcriptional activation (Larson et al., 2011; Lionnet et al., 2011; Park et al., 2014). We utilized this property to investigate the time course of zygotic genome activation (ZGA) in zebrafish. The zebrafish genome is quiescent until ∼3 h post-fertilization (hpf) (Giraldez et al., 2006; Schier, 2007; Dalle Nogare et al., 2009; Tadros and Lipshitz, 2009; Harvey et al., 2013), around the time of the mid-blastula transition (MBT). Development before this period is controlled by maternal factors, many of which are replaced by zygotic products after ZGA (Giraldez et al., 2006; Schier, 2007; Langley et al., 2014; Lee et al., 2014) (Fig. 2A). Genome-wide sequencing studies have identified the time-frame of ZGA (Harvey et al., 2013; Langley et al., 2014); however, it has not been possible to visualize ZGA over time on a single-cell basis, something which MS2 labeling might permit. Previous studies have shown that, like the zygotic genome, transcription from injected plasmid DNA is repressed until ZGA (Newport and Kirschner, 1982). To investigate the onset of transcription driven by the βactin promoter, we co-injected Tg(βactin:NLS-tdMCP-GFP) embryos with a Tol2-flanked DNA encoding cherry-24xMBS expressed from the βactin promoter, and RNA encoding the Tol2 Transposase to facilitate genomic integration. Embryos were examined at stages before and after ZGA for nuclear puncta (Fig. 2B). No nuclear puncta were detected in uninjected embryos at any time point assayed (supplementary material Fig. S2; n=9 embryos each at 3, 3.5, 4 and 4.5 hpf) nor in embryos injected with the βactin:cherry control plasmid DNA lacking MBS (Fig. 2C,D; n=13, 13, 11 and 14 at 3, 3.5, 4 and 4.5 hpf, respectively). By contrast, at 3.5 hpf and stages thereafter nuclear puncta were present in subsets of cells in most embryos injected with βactin:cherry-24xMBS (embryos with nuclear puncta at 3.5 hpf, n=11/11; at 4 hpf, n=9/10; at 4.5 hpf, n=16/17) but not at earlier stages (Fig. 2E,F; 3 hpf embryos with nuclear puncta n=1/17). Furthermore, cherry-24xMBS expressed from a promoter element that is not activated at ZGA yielded no nuclear puncta at 4.5 hpf (supplementary material Fig. S3), further suggesting that the puncta represent transcriptional events. Where nuclear puncta were detected, the number ranged from one to more than ten per nucleus. Because DNA was injected, the number of puncta could reflect the plasmid copy number and the transcriptional activity of the cell. Consistent with this notion, injection of 100 pg of βactin:cherry-24xMBS DNA yielded more nuclear puncta at 4.5 hpf (n=36 nuclei, 7 embryos; 9.28 puncta per nucleus) than injection of 25 pg (n=58 nuclei, 8 embryos; 3.12 puncta per nucleus; P=8.14×10⁻⁷). Our results are consistent with previous work suggesting that ZGA occurs at ∼3 hpf (Giraldez et al., 2006; Schier, 2007; Dalle Nogare et al., 2009; Tadros and Lipshitz, 2009). In addition, time-lapse analysis revealed that these transcriptional events are dynamic, because both appearing and disappearing puncta were detected (supplementary material Movie 3). We also captured fluorescence signals exiting the nucleus in cells with nuclear puncta, suggesting that the MBS-MCP complex can be exported from the nucleus (supplementary material Movie 4).
Fig. 2.
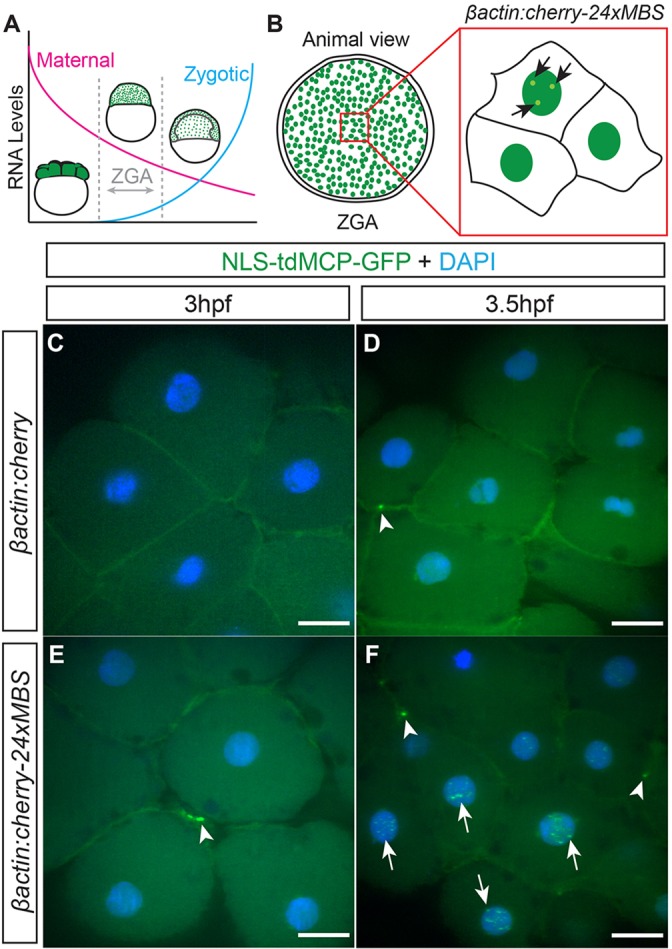
MS2-labeling reveals the onset of transcription in zebrafish embryos. (A) Immediately after fertilization, the RNA present is exclusively comprised of maternal products. After ZGA, zygotic transcripts begin to accumulate and replace maternal transcripts. (B) Embryos were injected with DNA encoding MS2-tagged-cherry RNA expressed from the βactin promoter and assayed for nuclear puncta around the time of ZGA (3-4.5 hpf). (C-F) Animal pole view of fixed embryos showing that βactin:cherry-injected control embryos at (C) 3 hpf and (D) 3.5 hpf have no nuclear puncta. Animal pole views of fixed embryos injected with βactin:cherry-24xMBS at (E) 3 hpf and (F) 3.5 hpf showing that nuclear puncta (arrows) are not detected at 3 hpf but are apparent at 3.5 hpf and beyond. Both injected (C-F) and uninjected (supplementary material Fig. S2) embryos display accumulations of MCP-GFP at cell membranes (arrowheads). Scale bars: 25 µm.
Conventional in vivo promoter reporters generally use a fluorescent protein to readout transcriptional activity. Using the MCP transgenic lines, the protein that detects transcripts (MCP) is maternally provided and present within the nucleus, and is thus poised to detect nascent transcripts. This design effectively eliminates lag between transcription, translation and protein detection, as well as concerns that fluorescent protein stability might extend beyond the transcriptionally active period, common problems with conventional fluorescent protein transcriptional reporters. As evidence of this, Cherry reporter protein expression was not detectable at the blastula stages assayed when nuclear MBS–MCP-GFP puncta were first apparent, underscoring the usefulness of the system. Transcriptional nuclear puncta were detected in all cell types assayed (supplementary material Fig. S4). Of note, in Tg(βactin:NLS-tdMCP-GFP) transgenic embryos at gastrula stages and beyond, large globular nuclear accumulations became prominent, predominantly in skin cells (supplementary material Fig. S3A,B) and enveloping layer cells (Fig. 3B). These structures were qualitatively different and easily distinguishable from the transcriptional puncta observed in cells expressing MBS-tagged RNAs (supplementary material Fig. S3A,B). Combined with advances in targeted mutagenesis and targeted insertions into the zebrafish genome (Chang et al., 2013; Hruscha et al., 2013; Hwang et al., 2013a,b; Auer et al., 2014; Shin et al., 2014), it should be possible to insert MBS tags into endogenous loci to probe endogenous transcription in the future.
Fig. 3.

MS2-tagged nanos3 3′UTR is detected by MCP-GFP in the cytoplasm of PGCs. (A) Schematic depicting injection and imaging of cherry-24xMBS-nanos3 3′UTR RNA. cherry-24xMBS-nanos3 3′UTR is initially in all cells but later is maintained only in PGCs. (B-G) Imaging of fixed embryos reveals strictly nuclear MCP-GFP in uninjected embryos at the shield stage (B,E) and cytoplasmic RNA visualized by MCP-GFP puncta in cherry-24xMBS- and cherry-24xMBS-nos3′UTR-injected embryos (C,D,F,G). Punctate accumulations of MCP-GFP are present on cell membranes of (F) cherry-24xMBS- and (G) cherry-24xMBS-nos3′UTR-injected embryos (arrows) indicating this represents a background artifact. Scale bars: 20 µm. (H-K) The Cherry reporter reveals PGCs at 30 hpf in embryos that were injected with cherry-24xMBS-nos3′UTR. PGCs expressing Cherry display cytoplasmic MCP-GFP, whereas somatic cells and non-expressing PGCs have strictly nuclear MCP-GFP. The dotted lines denote borders of cells expressing Cherry reporter. Scale bar: 10 µm.
Visualization of germ granule-like nanos3 RNA accumulations
To determine whether the MS2 system could recapitulate the localization of an endogenous zebrafish RNA, we fused MS2 tags to the nanos3 3′UTR (Koprunner et al., 2001). nanos3 is required to maintain PGCs and localizes to them beginning after ZGA (Koprunner et al., 2001; Draper et al., 2007). This localization is achieved through 3′UTR-mediated stabilization of nanos3 transcripts in PGCs and microRNA (miRNA)-mediated degradation in somatic cells (Koprunner et al., 2001; Giraldez et al., 2006; Mishima et al., 2006). We injected cherry-24xMBS-nanos3 3′UTR RNA (hereafter called cherryMBSnos3′utr) into Tg(βactin:NLS-tdMCP-GFP) embryos and analyzed fixed embryos at time points before and after clearance of nanos3 RNA from somatic cells (Fig. 3A). Before complete clearance of the RNA, MCP-GFP was cytoplasmic in cells expressing the Cherry label (Fig. 3D,G), although no cytoplasmic signals were detected in uninjected embryos (Fig. 3B,E). Of note, MCP-GFP foci were also detected at the membrane between adjacent cells (Fig. 3D,G). Similar accumulations were detected in embryos injected with cherry-24xMBS RNA lacking a UTR (Fig. 3C,F), and in uninjected Tg(βactin:NLS-tdMCP-GFP) embryos, although they were less prominent (supplementary material Fig. S2). Thus, these accumulations represent a background artifact of expressing the NLS-tdMCP-GFP that becomes more prominent upon MBS-tagged RNA expression.
Similar to other fluorescent proteins tagged with the nanos3 3′UTR, cherryMBSnos3′utr, as indicated by Cherry expression by PGCs alone, was later specifically stabilized in the PGCs (Fig. 3I), reminiscent of endogenous nanos3, indicating that the MBS hairpins did not disrupt 3′UTR-mediated clearance and stabilization of the RNA (Mishima et al., 2006). In Cherry-positive PGCs, diffuse punctate cytoplasmic MCP-GFP revealed persisting RNA (n=99/122 Cherry-positive PGCs, 21 embryos), which was not visible in somatic cells (Fig. 3H-K). Diffuse cytoplasmic MCP-GFP was never observed in PGCs of uninjected embryos (n=0/101 PGCs, 15 embryos), although one or two small MCP-GFP accumulations were infrequently visible in perinuclear regions (n=19/101 PGCs, 15 embryos), which probably represent nuclear breakdown associated with mitosis, based on nuclear morphology. Similar punctate signals have been observed for nuclear membrane proteins in dividing PGCs in other studies (Strasser et al., 2008).
To test whether cherryMBSnos3′utr localization revealed by the cytoplasmic MCP-GFP resembled that of endogenous nanos3, we used RNAscope technology (Gross-Thebing et al., 2014) to probe for nanos3 RNA. Similar to MS2-tagged RNA, nanos3 was diffusely cytoplasmic in PGCs but not in somatic cells (Fig. 4A,B). We also occasionally observed larger perinuclear accumulations of nanos3 (Fig. 4B). Closer examination of Cherry-positive PGCs from cherryMBSnos3′utr-injected embryos revealed that, in addition to diffuse cytoplasmic MCP-GFP, a fraction of Cherry-positive PGCs displayed perinuclear accumulations of MCP-GFP (Fig. 4C-F). To test whether these accumulations colocalized with endogenous nanos3, we again utilized RNAscope technology (Gross-Thebing et al., 2014) to examine nanos3 RNA. Importantly, to avoid detecting the injected cherryMBSnos3′utr, this probe specifically recognizes the open-reading frame of nanos3 and not the 3′UTR (Gross-Thebing et al., 2014). In injected embryos, endogenous nanos3 was again cytoplasmic in PGCs with occasional perinuclear accumulations (Fig. 4I). Based on MCP-GFP colocalization with endogenous nanos3 (Fig. 4G-J), we conclude that cherryMBSnos3′utr recapitulates endogenous nanos3 localization in PGCs and that the MCP-GFP fluorescence signal can serve to read out this RNA.
Fig. 4.

MS2-tagged nos3′utr colocalizes with endogenous nanos3 and a subset of Vasa-positive germ granules in PGCs. (A,B) Endogenous nanos3 RNA localizes to PGCs at 30 hpf and is present throughout the cytoplasm and in larger perinuclear accumulations (arrows). Scale bar: 10 µm. (C-F) Cherry-positive cells at 30 hpf have diffuse cytoplasmic MCP-GFP signal and larger perinuclear accumulations (arrows). Scale bar: 10 µm. (G-J) Accumulations of MCP-GFP in Cherry-expressing PGCs at 30 hpf in cherry-24xMBS-nos3′UTR-injected embryos (white arrows) colocalize with endogenous nanos3 accumulations. Nonspecific nuclear aggregates of MCP-GFP (yellow arrowheads) do not colocalize with endogenous nanos3, consistent with these structures being artifacts. Scale bar: 25 µm. (K-N) A subset of MCP-GFP accumulations in Cherry-expressing PGCs at 30 hpf in cherry-24xMBS-nos3′UTR-injected embryos coincide with Vasa protein-positive germ granules (arrows) whereas others do not (arrowheads). Scale bar: 10 µm. The dotted lines denote borders of cells expressing Cherry reporter.
The nanos3 accumulations resembled the localization patterns of other germ cell markers that promote germ cell survival or differentiation and localize to perinuclear germ granules, such as Vasa (Knaut et al., 2000; Hartung et al., 2014) and Dead end (Weidinger et al., 2003; Slanchev et al., 2009). To test whether MCP-GFP colocalized with germ granules, cherryMBSnos3′utr-injected transgenic animals were immunostained for Vasa protein. In Cherry-positive PGCs some cytoplasmic accumulations of MCP-GFP coincided with Vasa-granules and others did not (Fig. 4K-N), which might have functional significance given the role of nanos3 in PGC maintenance (Draper et al., 2007). Moreover, this result suggests that distinct populations of germ granules exist and is consistent with previous findings that germ plasm RNAs differentially accumulate during blastula cleavage stages (Theusch et al., 2006).
Our studies illustrate the feasibility of using MS2 RNA labeling to study transcription and RNA localization in vivo in zebrafish. Given that a growing number of biologically important processes, including the regulation of developmental transitions such as ZGA and MBT, involve regulation by non-coding RNA species such as miRNAs and long non-coding RNAs (lncRNAs) (Giraldez et al., 2006; Pauli et al., 2011, 2012), this system provides the potential to detect such molecules in vivo. Furthermore, with a growing number of targeted genetic manipulation techniques and an increasing wealth of transgenic disease models, these tools should permit future studies of RNA dynamics in development and disease.
MATERIALS AND METHODS
Animals
AB strain wild-type zebrafish embryos were obtained from natural matings and reared according to standard procedures (Westerfield, 2000). Embryos and larvae were raised in 1× Embryo Medium at 28.5°C and were staged as described previously (Kimmel et al., 1995). All procedures and experimental protocols were in accordance with NIH guidelines and approved by the Einstein Institutional Animal Care and Use Committee (protocol number 20140502).
Plasmids
All primers are listed in supplementary material Table S1.
MCP expression plasmids
NLS-HA-tdMCP-GFP and NLS-HA-tdMCP-tagRFP were amplified by PCR from phage-UBC-NLS-HA-tdMCP-GFP (Addgene, 40649) (Wu et al., 2012) and phage-UBC-NLS-HA-tdMCP-tagRFP (Wu et al., 2012) using NLS-HA-tdMCP-FP-F+R primers. NLS-tdMCP was amplified by PCR from phage-UBC-NLS-HA-tdMCP-GFP using NLS-tdMCPF+R primers. To add flanking attL1 and attL2 sites (Hartley et al., 2000; Walhout et al., 2000), PCR fragments were TOPO cloned into pCR8/GW/TOPO (K250020, Invitrogen) to make pME-NLS-tdMCP-eGFP, pME-NLS-tdMCP-tagRFP and pME-NLS-tdMCP. The βactin (Higashijima et al., 1997) and hsp70l (Halloran et al., 2000) promoter 5′ entry clones (p5E) were previously described (Kwan et al., 2007). Appropriate p5E and pME plasmids were recombined with pTolDestR4-R2pA (Villefranc et al., 2007) following the manufacturer's instructions (Invitrogen) to make pTol-promoter:NLS-tdMCP-eGFP.
MBS-RNA expression plasmids
pME-24xMBS was created from pCR4-24xMS2-SL (Addgene, 31865), which was digested with EcoRI, to release 24xMBS, which was then ligated into pCR8/GW/TOPO. pME-mCherry-24xMBS was created by amplifying mCherry with flanking BamHI sites by PCR from p3E-mCherry (Kwan et al., 2007) using p3E-mCherry-BamHI-F+R primers, then ligating into pME-24xMBS. pCS-mCherry-24xMBS was created by recombining pME-mCherry-24xMBS with pCSDest (Addgene, 22423) (Villefranc et al., 2007). p3E-nanos3 3′UTR was created by amplifying the nanos3 3′UTR with flanking attB2R and attB3 sites by PCR from pSP64GFP3′UTRnos (Koprunner et al., 2001) using pSP64GFP3′UTRnos-attB2R+3 primers and then recombining with pDONR P2R-P3 (Invitrogen). pCS-mCherry-24xMBS-nanos3 3′UTR was created by recombining pME-mCherry-24xMBS and p3E-nanos3 3′UTR with pCSDest2 (Addgene: 22424) (Villefranc et al., 2007). To create pTol-βactin:mCherry-24xMBS, p5E-βactin and pME-mCherry-24xMBS, were recombined with pTolDestR4-R2pA (Villefranc et al., 2007), and to create pTol-βactin:mCherry, p5E-βactin, and pME-mCherry, were recombined with pTolDestR4-R2pA.
MCP stable transgenic lines
Tol2 Transposase RNA, transcribed from pCS2FA-transposase (Kwan et al., 2007), and pTol-Promoter:NLS-tdMCP-eGFP circular DNA were combined (25 ng/μl each). Embryos were injected with 1 nl of this solution at the one-cell stage. GFP-expressing embryos were selected at 5 dpf and raised to generate founders (supplementary material Methods).
Transient assays
25 ng/μl each of circular pTol-βactin-mCherry-24xMBS DNA and Tol2 Transposase RNA were combined and injected as described above. For live imaging, embryos were scored for mCherry expression and imaged. For the time-course analysis, embryos were fixed in 4% paraformaldehyde every half hour from 3 hpf to 4.5 hpf.
mCherry-24xMBS and mCherry-24xMBS-nanos3 3′UTR RNAs were transcribed from pCS-mCherry-24xMBS and pCS-mCherry-24xMBS-nanos3 3′UTR, respectively. Plasmids were linearized with NotI and transcribed with the mMESSAGE mMACHINE T7 transcription kit (AM1344, Life Technologies). 500 pg of RNA solution was injected as described above. Embryos were fixed with 4% paraformaldehyde at the shield stage and at 30 hpf and imaged.
RNAscope in situ hybridization
Zebrafish whole-mount staining using the RNAscope Multiplex Fluorescent Reagent Kit (ACD Bio) was performed as described previously (Gross-Thebing et al., 2014). Briefly, 30 hpf embryos were fixed for 30 min in 4% paraformaldehyde, washed with PBT (PBS with 0.1% Tween), and dehydrated in MeOH at −20°C overnight. Embryos were dried for 30 min at room temperature before pretreatment 3. RNAscope Blank Probe C1 and Dr-nanos3-CDS Probe C3 (ACD Bio 431191-C3) were hybridized overnight at 40°C at a 50:1 ratio. Embryos were postfixed with 4% paraformaldehyde and washed with 0.2× SSCT before the amplification steps (Amp1-4). Amp4-AltB was used for the final reaction. Nuclei were stained with DAPI.
Immunostaining
For whole-mount immunofluorescence, embryos were fixed in 4% paraformaldehyde overnight at 4°C and permeabilized in acetone at −20°C for 12 min. Anti-Vasa antibody (Knaut et al., 2000) was diluted at 1:5000. Alexa Fluor 633-conjugated (Molecular Probes) secondary antibody was diluted at 1:500.
Imaging
Live blastula stage and post-gastrulation stage embryos were dechorionated and mounted in 1% low-melting-point agarose (A9414, Sigma-Aldrich) in embryo medium. Fixed embryos were mounted in 1% low-melting-point agarose in PBS. For transcriptional analysis, z-stacks of the blastoderm were acquired and subsequently scored for puncta in the nuclei. Fluorescent images of 30 hpf PGCs were acquired with a Leica SP2 point-scanning confocal microscope. All other images were acquired with a Zeiss 5Live Duoscan line-scanning confocal microscope. Fluorescence images were processed using ImageJ. Final adjustments were made using Adobe Illustrator CS5.1.
Supplementary Material
Acknowledgements
We thank the Marlow laboratory for discussions, A. Jenny for comments on the manuscript, our animal staff and the Analytical Imaging Facility for microscopy support.
Footnotes
Competing interests
The authors declare no competing or financial interests.
Author contributions
P.D.C. performed experiments and analysis, which were conceived and designed by P.D.C. and F.L.M. J.A.C. and R.H.S. contributed reagents and materials. F.L.M. contributed reagents, materials, and analysis tools. All authors discussed the data and manuscript. P.D.C. and F.L.M. wrote the manuscript.
Funding
This work was supported by the National Institutes of Health [R01GM089979 to F.L.M., R01GM057071, NS083085, and EB013571 to R.H.S., T32-GM007288 and 1F31NS083258 support of P.D.C.]; and the National Cancer Institute [P30CA013330 to the Analytical Imaging Facility (AIF)]. Deposited in PMC for release after 12 months.
Supplementary material
Supplementary material available online at http://dev.biologists.org/lookup/suppl/doi:10.1242/dev.118968/-/DC1
References
- Armitage B. A. (2011). Imaging of RNA in live cells. Curr. Opin. Chem. Biol. 15, 806-812 10.1016/j.cbpa.2011.10.006 [DOI] [PubMed] [Google Scholar]
- Auer T. O., Duroure K., De Cian A., Concordet J.-P. and Del Bene F. (2014). Highly efficient CRISPR/Cas9-mediated knock-in in zebrafish by homology-independent DNA repair. Genome Res. 24, 142-153 10.1101/gr.161638.113 [DOI] [PMC free article] [PubMed] [Google Scholar]
- Belaya K. and St Johnston D. (2011). Using the mRNA-MS2/MS2CP-FP system to study mRNA transport during Drosophila oogenesis. Methods Mol. Biol. 714, 265-283 10.1007/978-1-61779-005-8_17 [DOI] [PubMed] [Google Scholar]
- Bertrand E., Chartrand P., Schaefer M., Shenoy S. M., Singer R. H. and Long R. M. (1998). Localization of ASH1 mRNA particles in living yeast. Mol. Cell 2, 437-445 10.1016/S1097-2765(00)80143-4 [DOI] [PubMed] [Google Scholar]
- Chang N., Sun C., Gao L., Zhu D., Xu X., Zhu X., Xiong J.-W. and Xi J. J. (2013). Genome editing with RNA-guided Cas9 nuclease in zebrafish embryos. Cell Res. 23, 465-472 10.1038/cr.2013.45 [DOI] [PMC free article] [PubMed] [Google Scholar]
- Dalle Nogare D. E., Pauerstein P. T. and Lane M. E. (2009). G2 acquisition by transcription-independent mechanism at the zebrafish midblastula transition. Dev. Biol. 326, 131-142 10.1016/j.ydbio.2008.11.002 [DOI] [PubMed] [Google Scholar]
- Draper B. W., McCallum C. M. and Moens C. B. (2007). nanos1 is required to maintain oocyte production in adult zebrafish. Dev. Biol. 305, 589-598 10.1016/j.ydbio.2007.03.007 [DOI] [PMC free article] [PubMed] [Google Scholar]
- Gagnon J. A., Kreiling J. A., Powrie E. A., Wood T. R. and Mowry K. L. (2013). Directional transport is mediated by a Dynein-dependent step in an RNA localization pathway. PLoS Biol. 11, e1001551 10.1371/journal.pbio.1001551 [DOI] [PMC free article] [PubMed] [Google Scholar]
- Garneau N. L., Wilusz J. and Wilusz C. J. (2007). The highways and byways of mRNA decay. Nat. Rev. Mol. Cell Biol. 8, 113-126 10.1038/nrm2104 [DOI] [PubMed] [Google Scholar]
- Giraldez A. J., Mishima Y., Rihel J., Grocock R. J., Van Dongen S., Inoue K., Enright A. J. and Schier A. F. (2006). Zebrafish MiR-430 promotes deadenylation and clearance of maternal mRNAs. Science 312, 75-79 10.1126/science.1122689 [DOI] [PubMed] [Google Scholar]
- Gross-Thebing T., Paksa A. and Raz E. (2014). Simultaneous high-resolution detection of multiple transcripts combined with localization of proteins in whole-mount embryos. BMC Biol. 12, 55 10.1186/s12915-014-0055-7 [DOI] [PMC free article] [PubMed] [Google Scholar]
- Halloran M. C., Sato-Maeda M., Warren J. T., Su F., Lele Z., Krone P. H., Kuwada J. Y. and Shoji W. (2000). Laser-induced gene expression in specific cells of transgenic zebrafish. Development 127, 1953-1960. [DOI] [PubMed] [Google Scholar]
- Hartley J. L., Temple G. F. and Brasch M. A. (2000). DNA cloning using in vitro site-specific recombination. Genome Res. 10, 1788-1795 10.1101/gr.143000 [DOI] [PMC free article] [PubMed] [Google Scholar]
- Hartung O., Forbes M. M. and Marlow F. L. (2014). Zebrafish vasa is required for germ-cell differentiation and maintenance. Mol. Reprod. Dev. 81, 946-961 10.1002/mrd.22414 [DOI] [PMC free article] [PubMed] [Google Scholar]
- Harvey S. A., Sealy I., Kettleborough R., Fenyes F., White R., Stemple D. and Smith J. C. (2013). Identification of the zebrafish maternal and paternal transcriptomes. Development 140, 2703-2710 10.1242/dev.095091 [DOI] [PMC free article] [PubMed] [Google Scholar]
- Higashijima S.-i., Okamoto H., Ueno N., Hotta Y. and Eguchi G. (1997). High-frequency generation of transgenic zebrafish which reliably express GFP in whole muscles or the whole body by using promoters of zebrafish origin. Dev. Biol. 192, 289-299 10.1006/dbio.1997.8779 [DOI] [PubMed] [Google Scholar]
- Hocine S., Raymond P., Zenklusen D., Chao J. A. and Singer R. H. (2013). Single-molecule analysis of gene expression using two-color RNA labeling in live yeast. Nat. Methods 10, 119-121 10.1038/nmeth.2305 [DOI] [PMC free article] [PubMed] [Google Scholar]
- Holt C. E. and Bullock S. L. (2009). Subcellular mRNA localization in animal cells and why it matters. Science 326, 1212-1216 10.1126/science.1176488 [DOI] [PMC free article] [PubMed] [Google Scholar]
- Hruscha A., Krawitz P., Rechenberg A., Heinrich V., Hecht J., Haass C. and Schmid B. (2013). Efficient CRISPR/Cas9 genome editing with low off-target effects in zebrafish. Development 140, 4982-4987 10.1242/dev.099085 [DOI] [PubMed] [Google Scholar]
- Hwang W. Y., Fu Y., Reyon D., Maeder M. L., Tsai S. Q., Sander J. D., Peterson R. T., Yeh J.-R. J. and Joung J. K. (2013a). Efficient genome editing in zebrafish using a CRISPR-Cas system. Nat. Biotechnol. 31, 227-229 10.1038/nbt.2501 [DOI] [PMC free article] [PubMed] [Google Scholar]
- Hwang W. Y., Fu Y., Reyon D., Maeder M. L., Kaini P., Sander J. D., Joung J. K., Peterson R. T. and Yeh J.-R. J. (2013b). Heritable and precise zebrafish genome editing using a CRISPR-Cas system. PLoS ONE 8, e68708 10.1371/journal.pone.0068708 [DOI] [PMC free article] [PubMed] [Google Scholar]
- Kawakami K. (2007). Tol2: a versatile gene transfer vector in vertebrates. Genome Biol. 8Suppl. 1, S7 10.1186/gb-2007-8-s1-s7 [DOI] [PMC free article] [PubMed] [Google Scholar]
- Kawakami K., Koga A., Hori H. and Shima A. (1998). Excision of the tol2 transposable element of the medaka fish, Oryzias latipes, in zebrafish, Danio rerio. Gene 225, 17-22 10.1016/S0378-1119(98)00537-X [DOI] [PubMed] [Google Scholar]
- Kawakami K., Imanaka K., Itoh M. and Taira M. (2004). Excision of the Tol2 transposable element of the medaka fish Oryzias latipes in Xenopus laevis and Xenopus tropicalis. Gene 338, 93-98 10.1016/j.gene.2004.05.013 [DOI] [PubMed] [Google Scholar]
- Kimmel C. B., Ballard W. W., Kimmel S. R., Ullmann B. and Schilling T. F. (1995). Stages of embryonic development of the zebrafish. Dev. Dyn. 203, 253-310 10.1002/aja.1002030302 [DOI] [PubMed] [Google Scholar]
- Knaut H., Pelegri F., Bohmann K., Schwarz H. and Nusslein-Volhard C. (2000). Zebrafish vasa RNA but not its protein is a component of the germ plasm and segregates asymmetrically before germline specification. J. Cell Biol. 149, 875-888 10.1083/jcb.149.4.875 [DOI] [PMC free article] [PubMed] [Google Scholar]
- Koprunner M., Thisse C., Thisse B. and Raz E. (2001). A zebrafish nanos-related gene is essential for the development of primordial germ cells. Genes Dev. 15, 2877-2885. [DOI] [PMC free article] [PubMed] [Google Scholar]
- Kwan K. M., Fujimoto E., Grabher C., Mangum B. D., Hardy M. E., Campbell D. S., Parant J. M., Yost H. J., Kanki J. P. and Chien C.-B. (2007). The Tol2kit: a multisite gateway-based construction kit for Tol2 transposon transgenesis constructs. Dev. Dyn. 236, 3088-3099 10.1002/dvdy.21343 [DOI] [PubMed] [Google Scholar]
- Langley A. R., Smith J. C., Stemple D. L. and Harvey S. A. (2014). New insights into the maternal to zygotic transition. Development 141, 3834-3841 10.1242/dev.102368 [DOI] [PubMed] [Google Scholar]
- Larson D. R., Zenklusen D., Wu B., Chao J. A. and Singer R. H. (2011). Real-time observation of transcription initiation and elongation on an endogenous yeast gene. Science 332, 475-478 10.1126/science.1202142 [DOI] [PMC free article] [PubMed] [Google Scholar]
- Lee M. T., Bonneau A. R. and Giraldez A. J. (2014). Zygotic genome activation during the maternal-to-zygotic transition. Annu. Rev. Cell Dev. Biol. 30, 581-613 10.1146/annurev-cellbio-100913-013027 [DOI] [PMC free article] [PubMed] [Google Scholar]
- Lionnet T., Czaplinski K., Darzacq X., Shav-Tal Y., Wells A. L., Chao J. A., Park H. Y., de Turris V., Lopez-Jones M. and Singer R. H. (2011). A transgenic mouse for in vivo detection of endogenous labeled mRNA. Nat. Methods 8, 165-170 10.1038/nmeth.1551 [DOI] [PMC free article] [PubMed] [Google Scholar]
- Mishima Y., Giraldez A. J., Takeda Y., Fujiwara T., Sakamoto H., Schier A. F. and Inoue K. (2006). Differential regulation of germline mRNAs in soma and germ cells by zebrafish miR-430. Curr. Biol. 16, 2135-2142 10.1016/j.cub.2006.08.086 [DOI] [PMC free article] [PubMed] [Google Scholar]
- Newport J. and Kirschner M. (1982). A major developmental transition in early Xenopus embryos: II. Control of the onset of transcription. Cell 30, 687-696 10.1016/0092-8674(82)90273-2 [DOI] [PubMed] [Google Scholar]
- Park H. Y., Lim H., Yoon Y. J., Follenzi A., Nwokafor C., Lopez-Jones M., Meng X. and Singer R. H. (2014). Visualization of dynamics of single endogenous mRNA labeled in live mouse. Science 343, 422-424 10.1126/science.1239200 [DOI] [PMC free article] [PubMed] [Google Scholar]
- Pauli A., Rinn J. L. and Schier A. F. (2011). Non-coding RNAs as regulators of embryogenesis. Nat. Rev. Genet. 12, 136-149 10.1038/nrg2904 [DOI] [PMC free article] [PubMed] [Google Scholar]
- Pauli A., Valen E., Lin M. F., Garber M., Vastenhouw N. L., Levin J. Z., Fan L., Sandelin A., Rinn J. L., Regev A. et al. (2012). Systematic identification of long noncoding RNAs expressed during zebrafish embryogenesis. Genome Res. 22, 577-591 10.1101/gr.133009.111 [DOI] [PMC free article] [PubMed] [Google Scholar]
- Santangelo P. J., Alonas E., Jung J., Lifland A. W. and Zurla C. (2012). Probes for intracellular RNA imaging in live cells. Methods Enzymol. 505, 383-399 10.1016/B978-0-12-388448-0.00028-0 [DOI] [PMC free article] [PubMed] [Google Scholar]
- Schier A. F. (2007). The maternal-zygotic transition: death and birth of RNAs. Science 316, 406-407 10.1126/science.1140693 [DOI] [PubMed] [Google Scholar]
- Schonberger J., Hammes U. Z. and Dresselhaus T. (2012). In vivo visualisation of RNA in plants cells using the lambdaN(22) system and a GATEWAY-compatible vector series for candidate RNAs. Plant J. 71, 173-181 10.1111/j.1365-313X.2012.04923.x [DOI] [PubMed] [Google Scholar]
- Shin J., Chen J. and Solnica-Krezel L. (2014). Efficient homologous recombination-mediated genome engineering in zebrafish using TALE nucleases. Development 141, 3807-3818 10.1242/dev.108019 [DOI] [PMC free article] [PubMed] [Google Scholar]
- Slanchev K., Stebler J., Goudarzi M., Cojocaru V., Weidinger G. and Raz E. (2009). Control of Dead end localization and activity--implications for the function of the protein in antagonizing miRNA function. Mech. Dev. 126, 270-277 10.1016/j.mod.2008.10.006 [DOI] [PubMed] [Google Scholar]
- Strasser M. J., Mackenzie N. C., Dumstrei K., Nakkrasae L.-I., Stebler J. and Raz E. (2008). Control over the morphology and segregation of Zebrafish germ cell granules during embryonic development. BMC Dev. Biol. 8, 58 10.1186/1471-213X-8-58 [DOI] [PMC free article] [PubMed] [Google Scholar]
- Tadros W. and Lipshitz H. D. (2009). The maternal-to-zygotic transition: a play in two acts. Development 136, 3033-3042 10.1242/dev.033183 [DOI] [PubMed] [Google Scholar]
- Theusch E. V., Brown K. J. and Pelegri F. (2006). Separate pathways of RNA recruitment lead to the compartmentalization of the zebrafish germ plasm. Dev. Biol. 292, 129-141 10.1016/j.ydbio.2005.12.045 [DOI] [PubMed] [Google Scholar]
- van Gemert A. M. C., van der Laan A. M. A., Pilgram G. S. K., Fradkin L. G., Noordermeer J. N., Tanke H. J. and Jost C. R. (2009). In vivo monitoring of mRNA movement in Drosophila body wall muscle cells reveals the presence of myofiber domains. PLoS ONE 4, e6663 10.1371/journal.pone.0006663 [DOI] [PMC free article] [PubMed] [Google Scholar]
- Villefranc J. A., Amigo J. and Lawson N. D. (2007). Gateway compatible vectors for analysis of gene function in the zebrafish. Dev. Dyn. 236, 3077-3087 10.1002/dvdy.21354 [DOI] [PMC free article] [PubMed] [Google Scholar]
- Walhout A. J. M., Temple G. F., Brasch M. A., Hartley J. L., Lorson M. A., van den Heuvel S. and Vidal M. (2000). GATEWAY recombinational cloning: application to the cloning of large numbers of open reading frames or ORFeomes. Methods Enzymol. 328, 575-592 10.1016/S0076-6879(00)28419-X [DOI] [PubMed] [Google Scholar]
- Weidinger G., Stebler J., Slanchev K., Dumstrei K., Wise C., Lovell-Badge R., Thisse C., Thisse B. and Raz E. (2003). dead end, a novel vertebrate germ plasm component, is required for zebrafish primordial germ cell migration and survival. Curr. Biol. 13, 1429-1434 10.1016/S0960-9822(03)00537-2 [DOI] [PubMed] [Google Scholar]
- Westerfield M. (2000). The Zebrafish Book. A Guide for the Laboratory use of Zebrafish (Danio rerio). Eugene: University of Oregon Press. [Google Scholar]
- Wu B., Chao J. A. and Singer R. H. (2012). Fluorescence fluctuation spectroscopy enables quantitative imaging of single mRNAs in living cells. Biophys. J. 102, 2936-2944 10.1016/j.bpj.2012.05.017 [DOI] [PMC free article] [PubMed] [Google Scholar]
Associated Data
This section collects any data citations, data availability statements, or supplementary materials included in this article.