

Analysis of transcriptomics data reveals the LPS response can be subdivided into a larger number of co-regulated gene subsets than previously considered.
Keywords: LPS, interferon-β, interferon-γ, gene expression
Abstract
Macrophages respond to the TLR4 agonist LPS with a sequential transcriptional cascade controlled by a complex regulatory network of signaling pathways and transcription factors. At least two distinct pathways are currently known to be engaged by TLR4 and are distinguished by their dependence on the adaptor molecule MyD88. We have used gene expression microarrays to define the effects of each of three variables—LPS dose, LPS versus IFN-β and -γ, and genetic background—on the transcriptional response of mouse BMDMs. Analysis of correlation networks generated from the data has identified subnetworks or modules within the macrophage transcriptional network that are activated selectively by these variables. We have identified mouse strain-specific signatures, including a module enriched for SLE susceptibility candidates. In the modules of genes unique to different treatments, we found a module of genes induced by type-I IFN but not by LPS treatment, suggesting another layer of complexity in the LPS-TLR4 signaling feedback control. We also observe that the activation of the complement system, in common with the known activation of MHC class 2 genes, is reliant on IFN-γ signaling. Taken together, these data further highlight the exquisite nature of the regulatory systems that control macrophage activation, their likely relevance to disease resistance/susceptibility, and the appropriate response of these cells to proinflammatory stimuli.
Introduction
Macrophages are primary effectors of the innate immune system. They recognize pathogens and other foreign entities through expression of an extensive repertoire of surface and intracellular receptors [1]. When activated, these receptors trigger signaling pathways that act to alter the transcriptional landscape of the cells, thereby tailoring their functional activity, according to local conditions. The nature of the response varies with pathogen type and exposure, host genotype, and the phenotype of the cell before activation [2]. As much of the pathology of infectious and inflammatory disease is initiated by macrophage activity [3], their response to a given insult must be appropriate and tightly regulated. LPS or endotoxin, an outer-membrane component of Gram-negative bacteria, is the most studied pathogen-associated molecule and used to model many aspects of infection and inflammation. In mammalian cells, recognition of LPS involves a series of interactions with several proteins [4], including the LPS-binding protein, CD14, LY96 (myeloid differentiation protein 2), and TLR4. The receptor complex then initiates at least two distinct signaling pathways, distinguished by the dependence on the adaptor MyD88 [4]. The MyD88-independent pathway activates the IRF3 transcription factor, resulting in IFN-β expression, which then acts in an autocrine manner to contribute to the subsequent LPS-transcriptional response [5, 6]. The MyD88-dependant pathway is the main protagonist in the activation of the MAPK and NF-κB signaling pathways. A subset of the immediate-early, LPS-responsive genes, including Tnf and Ifnb1, is activated through the promotion of transcription elongation from poised transcription initiation complex, ensuring the rapid onset of the response [7, 8]. Motif analysis has been used in a number of studies of the LPS response to infer the identity of key transcriptional regulators, leading to identification of ATF3 and NF-E2 as feedback regulators [9, 10].
The response of macrophages to LPS is dose-dependent [11, 12]. At the receptor level, CD14 is known to enhance the sensitivity of the TLR4/LY96 receptor complex to endotoxin [13], and mice lacking CD14 are resistant to endotoxic shock [14]. Different LPS-responsive genes can display distinct dose-response curves [15]. The response to LPS is also regulated by other signals, notably from the acquired immune response. One of the key functions of the Th1 cytokine IFN-γ is to sensitize macrophages to activation by pathogen challenge, including LPS [16, 17]. IFN-γ and LPS signals synergize at a number of levels, from their signaling pathways, transcription factor activation and target gene regulation [17], and feedback control, via the SOCS proteins [18]. Signals also converge at key transcription factors, such as LPS-mediated phosphorylation of Stat1, a crucial cytosolic factor for IFN-γ-dependent gene regulation [17]. There is a related cross-talk and synergy between LPS and type-I IFN signaling. In macrophages, LPS stimulation induces the rapid transcription of IFN-β mRNA and protein secretion [19]. In turn, IFN-β signaling forms a key portion of the LPS transcriptional response and LPS-induced lethality [5, 6]. The type I and type II IFN systems have overlapping but nonredundant activities [20, 21] and activate many of the same genes, although the specifics are ill-defined.
There are significant differences in the set of LPS-induced genes between macrophages derived from different inbred mouse strains [22, 23] and between mammalian species, but overall, the transcriptional networks are similar [24, 25]. The C57BL/6 strain of mice is, by far, the most widely used and studied experimental rodents. It is considered the prototypical Th1 strain, and its macrophages produce NO more readily in response to classical activators (LPS, IFN-γ) than macrophages from BALB/c, the prototypical Th2 strain. The T lymphocytes of BALB/c mice generate more IL-4 and Th2 cytokines, and these stimulate macrophage arginine metabolism by inducing arginase [26]. Another key difference between the strains is the autocrine IFN signaling in C57BL/6 mice; C57BL/6 macrophages display IFN-dependent, differential resistance to Newcastle disease virus [27] and respond to LPS as if IFN-primed [23]. Strain-specific methylation patterns have been shown to contribute to differences in gene expression between the two strains, including the Gbp1 gene [28], and their macrophages differ in response to Yersinia enterocolitica infection [29] and Leishmania major infection [30].
We have previously used the transcriptional network analysis tool BioLayout Express3D to dissect the transcriptional landscape of different populations of mouse cells [31, 32]. With a sufficiently large dataset, genes with related function often share robustly correlated expression patterns across datasets. When correlation matrixes of expression data are analyzed as networks, these form cliques of high connectivity within the graph. Such gene clusters commonly contain the transcription factors that regulate them; for example, a robust set of genes, coexpressed in phagocytes, contained lysosome-related genes and known transcription regulators PU.1 and C/EBP [31]. In the current study, we focus our analysis on the transcriptional networks induced in BMDMs of the mouse stimulated by “classical”-activating factors. In this study, the murine macrophage transcriptional network has been systematically perturbed by exposure to IFN-β and -γ, varying concentrations of LPS and on different genetic backgrounds. In each case, the time-course of transcriptional events has been monitored using whole genome gene expression microarrays. The results indicate that the LPS response can be subdivided into transcriptional modules of genes that encode proteins with specific and different roles in innate immunity.
MATERIALS AND METHODS
Cell culture and treatment
BMDMs were prepared from femurs of 7- to 8-week-old male BALB/cJ or C57BL/6J mice (Charles River Laboratories, UK). Complete culture media were composed of RPMI-1640 medium (Sigma-Aldrich, Gillingham, UK), supplemented with 10% heat-inactivated FBS (Sigma-Aldrich), 25 U/ml penicillin (Invitrogen, Paisley, UK), 25 μg/ml streptomycin (Invitrogen), and 2 mM L-glutamine (Invitrogen). Briefly, bone marrow cells were cultured for 6 days in complete medium in the presence of 10,000 U/ml CSF-1 on 10 cm2 bacteriological plastic plates, with a resupplement of CSF-1 on Day 5. On Day 6, cells were harvested, counted, resuspended in complete medium with 10,000 U/ml CSF-1, and seeded into 24-well tissue-culture plates at a density of 200,000 cells/well. Twenty-four hours later (Day 7), BALB/c-derived cells were treated with one of the following: 10 U/ml mouse rIFN-β (PBL InterferonSource, Piscatway, NJ, USA), 10 U/ml IFN-γ (Perbio Science, Northumberland, UK), or 5 ng/ml LPS (Salmonella minnesota Re595; Sigma-Aldrich), collected pretreatment (0 h) and then, at 1, 2, 4, 8, and 24 h, post-treatment. C57BL/6-derived macrophages were treated with LPS at 0.5 ng/ml, 5 ng/ml, or 50 ng/ml and harvested at the same time-points as BALB/c (see Fig. 1 and Supplemental Table 1). All treatments were performed in the presence of CSF-1, as it is constitutively present in vivo. Moreover, CSF-1 is itself induced upon macrophage activation with LPS and has been shown to enhance the activation of some genes by LPS [33].
Figure 1. Experimental workflow for mouse BMDM time-course experiments.

Six time-course experiments on mouse BMDMs were set up in parallel. Macrophages were derived from the bone marrow of the C57BL/6 or BALB/c strain of mice and differentiated using the growth factor CSF-1. Following 7 days of culture, C57BL/6 cells were treated with any of 50 ng/ml, 5 ng/ml, or 0.5 ng/ml LPS; BALB/c macrophages were treated with any of 5 ng/ml LPS, 10 U/ml IFN-β, or 10 U/ml IFN-γ. In each case, cells were harvested at 1, 2, 4, 8, and 24 h post-treatment [as well as pretreatment (0 h)]. RNA from all samples was processed for labeling and hybridization to the Affymetrix Mouse Gene 1.1 arrays on the Array Plate format. Gene expression data were analyzed using a combination of statistical filtering with the Bioconductor package and network-based correlation analysis using the network analysis tool BioLayout Express3D.
RNA extraction, quality control, and labeling for arrays
Total RNA was harvested from the cells using an RNeasy Plus kit (Qiagen, Crawley, UK), according to the manufacturer's instructions. RNA was quantified and quality-controlled using a NanoDrop spectrophotometer (NanoDrop Technologies, Wilmington, DE, USA) and 2100 Bioanalyzer (Agilent Technologies, Santa Clara, CA, USA) to determine RNA purity and integrity. Replicate 250-ng samples of total RNA, derived from two separate wells/time-point, were first processed using the Ambion WT Expression Kit (Life Technologies, Carlsbad, CA, USA) to generate amplified and biotinylated sense-strand DNA targets from the entire genome without bias. Sense-strand DNA samples were then labeled and hybridized to the Affymetrix Mouse Gene 1.1 ST Array Plate using the GeneChip WT terminal labeling and hybridization kit (Affymetrix, Santa Clara, CA, USA), according to the manufacturer's recommendation. Individual arrays interrogate >28,000 annotated transcripts using >770,000 distinct probes. Hybridization, washing, and scanning of the 64 arrays were performed in a single run using the Affymetrix GeneTitan instrument, according to the manufacturer's recommendations.
Data processing and network analysis
Data (submitted to GEO, GSE44292) was normalized and annotated using the Robust Multichip Analysis package within the Affymetrix Expression Console software. Empirical Bayes statistical analysis was performed using the Bioconductor package (www.bioconductor.org). Network analysis of the normalized expression data was performed using BioLayout Express3D [34]. The specifics for each analysis are described below.
LPS dose-response analysis
To begin, the expression data for the 50-ng/ml LPS time-course on C57BL/6 macrophages was analyzed in isolation, and then, all C57BL/6 LPS treatment samples at each dose were examined together. Taking the 50-ng/ml LPS time-course samples, a Pearson correlation matrix of a transcript-to-transcript profile comparison was used to filter for expression relationships of r > 0.95, generating a graph of 2950 nodes (transcripts), connected by 174,621 edges (correlations greater than threshold). To identify modules of tightly coexpressed genes, the graph was clustered using the graph-based clustering algorithm MCL [35], set at a MCLi of 1.7 (which determines the granularity of the clusters), generating 60 clusters of coexpressed genes.
Taking data for all arrays of the LPS dose-response samples, 16,856 “low-expressed” probes (expressed <40 in all arrays) were removed. An initial network graph of the remaining probes was constructed by filtering for at least r > 0.85, generating a graph of 11,601 nodes connected by 1,221,571 edges. The graph was clustered using a MCLi of 2.2, generating 241 clusters. Probes (9678) were within these clusters, which were inspected, and those representing noise/technical artifacts, annotated as a result of a difference in the intensity of the arrays across the plate (2583 transcripts in total), were removed from the subsequent analysis.
A further network graph was then constructed but this time, at cut-off of r > 0.87, generating a graph of 8425 nodes, connected by 805,049 edges. Cluster analysis was performed using a MCLi of 2.2, resulting in 254 clusters with at least four nodes. Transcripts (7289) were within clusters; 6160 of these within clusters associated with LPS treatment (www.macrophages.com/Raza2013-expression-networks), and 1129 transcripts were within correlated but not regulated clusters of genes. The clusters were annotated as representing “up”- or “down”-regulated patterns of expression. Transcripts (3212) were within clusters representing down-regulated patterns; 305 transcripts were clusters showing down-regulation at first and then up-regulation later. Nodes (2545) were within up-regulated clusters and 98 within clusters, representing up-regulation at first and repressed at later time-points. A detailed examination of dose responsiveness was carried out on the probes within up-regulated clusters (including up first and later repressed), totaling 2643 probes. With the use of the expression profile of each probe, its relative AUC was compared at the different LPS dose treatments (0.5, 5, and 50 ng/ml). The AUC ratios at each dose were compared to ascertain the dose responsiveness of each transcript. A detailed description of the AUC analysis is provided in Supplemental Fig. 1. A hierarchical cluster-interaction network of the up-regulated clusters and their gene members was created using the yEd Graph Editor software and BioLayout Express3D. Color-coded, dose-responsiveness categories (determined from the AUC analysis) were overlaid onto the graph.
Mouse strain comparison
Statistical filtering.
A number of filtering steps were applied to determine genes most differentially expressed between the two strains. The Empirical Bayes function within the Bioconductor package (www.bioconductor.org) was used to find: (1) genes most differentially expressed overall between the two strains and (2) those behaving most differentially over time between the strains by comparing the differentials at each time-point comparison (0 h vs. other time-points) for each strain. Genes (897) passed the first filter (at an adjusted P value cut-off of <0.05 and fold change of at least 1.5). One thousand four hundred ninety-six passed the second filter (adjusted P value cut-off of <0.05). There was an overlap of 151 genes between the two lists. The aggregated list was taken forward to determine the main differences between the two strains. Probes with a low signal (expression value <50 in 22 of the 24 arrays) were excluded (311 probes in total). Individual profiles of the low-expressed probes were inspected, and most were background noise/artifacts. However, 14 probes displayed expression patterns distinct to one strain or the other, so they were retained for further analysis. The remaining 297 low-expressed probes were excluded.
A network of graphs of the remaining “differentials list” was constructed to inspect the main patterns of expression in the dataset. The resultant graph (r>0.85) consisted of 1754 nodes, connected by 58,445 edges and was subjected to cluster analysis using a MCLi of 2.2. This generated 46 clusters with a membership of at least five nodes (www.macrophages.com/Raza2013-expression-networks). The clusters were inspected for patterns of expression associated with treatment over the time-courses or mouse strain, and gene lists associated with clusters were exported for GO annotation analysis (Biological and Metabolic Processes Level–FAT) using the DAVID tool [36].
Identification of null expression alleles
To identify those transcripts that are null or very weakly expressed in one strain compared with the other, further filtering was applied to the list of differentials. Probes with expression of <100 in all arrays in one strain but expressed >100 in at least two arrays of the other strain were extracted for further inspection, as were probes where six or more arrays in one strain versus the other had expression of <100. In total, 346 probes passed this filter. Their individual profiles were inspected, and 124 transcripts were marked as convincingly null-expressed in one strain.
From this list and the cluster analysis, some of the most compelling examples of strain-specific expression are shown in Supplemental Fig. 2. These are divided into six groups: transcripts expressed in BALB/c > C57BL/6; C57BL6 > BALB/c; induced by LPS in BALB/c but not (or barely) in C57BL/6; induced by LPS in C57BL/6 but not (or barely) in BALB/c; and induced/repressed in both strains but to a far greater extent in one or the other.
IFN and LPS comparisons
An initial filtering step was performed by filtering a network graph of expression data relating to all of the probes (transcripts) on the array at r > 0.85 cut-off threshold. The resultant network graph of 11,258 nodes, connected by 270,601 edges, was then clustered at a MCLi of 2.2, resulting in >600 clusters with at least greater than or equal to three nodes. Clusters related to technical artifacts or patterns of expression unchanging across the 32 arrays were eliminated. A further network graph, relating only to the data from probes within “interesting” clusters of the filtered graph (3747 nodes), was generated (by filtering relationships at r>0.85 and clustering the consequential graph at a MCLi of 2.2). The clusters were inspected for patterns of expression associated with treatment over the time-courses, and gene lists associated with clusters were exported for GO annotation analysis (Biological Processes Level–FAT), using the DAVID tool. Cluster patterns and annotations are detailed at www.macrophages.com/Raza2013#LPS-vs-interferon.
Analysis of transcription factor-binding enrichment in expression clusters identified here and comparison with data generated in a previous study
In a previous study, Amit et al. [37] examined the transcriptional response of bone marrow monocytes matured in GM-CSF (CSF-2), commonly referred to as BMDCs, to five TLR agonists at nine time-points following stimulation. This group also went on to examine the DNA interaction dynamics of 25 transcription factors in this cell system [38]. To better understand the transcriptional control of the clusters of genes observed here to be regulated by LPS and how the current study compares with the data generated by this group, we have attempted a direct comparison. The study by Amit et al. [37] used the Affymetrix HT_MG-430A chip to monitor expression following activation by the TLR agonists. The data were downloaded from GEO (GSE17721) and analyzed using the network analysis approach described above. In brief, a “.expression” file was generated, and correlation network was constructed of relationships where r > 0.85 and clustered (MCLi, 1.7). Clusters were then annotated based on the average pattern of expression of each cluster. The same analysis was performed on the data generated here. A hypergeometric test was then performed to examine both sets of expression clusters for an enrichment of genes, which are known targets of the 25 transcription factors examined by Garber et al. [38]. Results were subjected to a Bonferroni correction for multiple hypotheses, and results, where P < 0.0001, were reported.
Supplemental material
Supplemental Table 1 analyzed BMDM samples and treatment—a list of all analyzed samples, specifying the mouse strain origin, treatment type, treatment concentration, and time of sampling. Supplemental Fig. 1 categorizes dose-responsiveness based on AUC. This described the methodology behind calculating the AUC for transcripts at each dose treatment and how the dose-responsive patterns are determined from the relative ratios of AUCs at one dose treatment versus another. Nineteen different patterns of dose responsiveness are described, as is their grouping into five broader categories. Supplemental Fig. 2 includes selected expression profiles of strain-specific differentials. Sixty-three of the most compelling examples of strain-specific/biased expression (taken from a filtered short list of 124 genes) are shown in this material. The examples are grouped, based on the overall characteristics of their expression, e.g., transcripts with differential expression in either strain, regardless of LPS treatment, or transcripts induced by LPS in one strain but not the other. Supplemental Table 2 illustrates cluster annotations of all cluster analyses. This material contains details of all genes within any of the network analyses in this study, including their cluster (coexpression) membership, description of their expression pattern, and any other accompanying details. Gene annotations and normalized expression data are also provided. Specifics for each analysis can be viewed by expanding the appropriate columns; to do this, click on the + sign above the column of interest on the spreadsheet.
RESULTS
Network-based approach for dissecting the mouse-BMDM transcriptional response to LPS
The genome-wide transcriptional response of macrophages to LPS has been examined previously [10, 39, 40]. We set out to examine the LPS response using the latest generation of whole genome microarray technology and more advanced computation analytical methods. We sought to examine three aspects of the response: (1) the variation in response to a 100-fold range in LPS dose; (2) the influence of mouse genetic background; and (3) a comparison of the LPS response with the response to IFN-β or IFN-γ.
In total, six time-course experiments were set up in parallel (Fig. 1 and Supplemental Table 1). BMDMs were derived from C57BL/6 or BALB/c mice. C57BL/6 macrophages were treated with of 0.5, 5, or 50 ng/ml LPS, and BALB/c-derived macrophages were treated with 5 ng/ml LPS, 10 U/ml mouse rIFN-β, or 10 U/ml IFN-γ. The design of each time-course was the same, and cultures of BMDMs were treated and then harvested at 0 h (before stimulation) and then 1, 2, 4, 8, and 24 h post-treatment. Two replicate samples were collected for each treatment at each time-point. All RNA samples were processed simultaneously for microarray analysis, including the labeling, hybridization, and scanning steps. We applied a combination of statistical filtering and gene coexpression network analysis to interpret the expression data.
Dose-dependent and -independent actions of LPS
The initial baseline analysis replicates and extends the previous study [10] of the response of BMDM from C57BL/6 macrophages to a maximally stimulatory concentration of salmonella R595 LPS (50 ng/ml). A Pearson correlation matrix of a transcript-to-transcript profile comparison was used to filter the LPS time-course data for expression correlation relationships of r > 0.95. A graph of 2954 nodes, connected by 174,669 edges, was generated (Fig. 2, and see www.macrophages.com/Raza2013-expression-networks). To identify cohorts of tightly coexpressed genes, the graph was clustered using an MCLi of 1.7. Sixty clusters of coexpressed genes were generated, ranging in size from 956 to four nodes. A full breakdown of the clusters, their gene membership, and description of expression patterns is provided in Supplemental Table 2 (Excel file column LPS 50 ng/ml C57BL/6 analysis). The expression patterns of selected clusters of coexpressed genes are shown in Fig. 2. As noted previously [10], the response is a temporal cascade that changes continuously over 24 h. The immediate-early and early response consisted of only 47 genes. These were highly enriched for regulatory factors, including many transcription factors (Egr2, Fosl1, Irf4, Junb, Klf6, Maff, Nr4a1, Spry1, Zbtb10), other regulatory molecules (Errfi1, Ifrd1, Phlda1, Prdm2, Ppp1r15a, Rcan1), and cytokines (Cxcl1, Cxcl2, Lif, Tnf, Tnfsf9). These data also confirm the self-limiting nature of the LPS response [23], with a large number of negative regulators up-regulated early in the response, including a number of DUSPs (Dusp4, Dusp5, Dusp8, Dusp14) NF-κB regulators (Nfkbia, Nfkbid, Nfkbiz, Tnfaip3), and the regulator of mRNA stability (Zfp36), whose actions are known to inhibit the activation of the LPS signaling pathways (Fig. 2). The mid and mid-to-late transcriptional changes contain the hallmarks of classical macrophage activation; the up-regulated genes include type-I IFN response genes (Ifi204, Ifi205, Ifi35, Ifi47, Ifih1, Ifit1, Ifit2, Ifit3), ILs (Il12a, Il18, Il27, Il7), solute carriers (Slc11a, Slc15a3, Slc25a12, Slc25a22, Slc25a43, Slc26a2), pattern recognition receptors (Tlr3, Tlr6, Tlr7, Tlr8, Nod1, Nod2, Aim2), and chemokines (Ccl3, Ccl4, Ccl8, Ccl17, Ccl22, Cxcl3, Cxcl9, Cxcl10, Cxcl11, Cxcl16; Supplemental Table 2). The second-largest cluster of genes in the network graph (Cluster 2), containing 784 transcripts, whose expression peaked at 8 h post-LPS treatment, formed part of this mid-to-late LPS response. However, the largest cluster of coexpressed genes comprised transcripts whose expression was repressed 8–24 h post-LPS. Accordingly, the down-regulated clusters contained 1125 genes (1252 transcripts), including numerous cell cycle-associated genes, such as the cyclins (Ccna2, Ccnb1, Ccnb2, Ccne1, Ccnf, Ccny), cyclin-dependant kinases (Cdk1, Cdk2, Cdk4, Cdk15, Cdk19), kinesin family members (Kif2c, Kif4, Kifc1, Kif11, Kif14, Kif15), DNA replication initiators (Mcm2, Mcm3, Mcm4, Mcm5), the S-phase transcription factor (E2f1), and the CSF-1R target, urokinase plasminogen activator (Plau). These data are consistent with the previously reported ability of LPS to block signaling from the CSF-1R, thereby causing growth arrest in BMDMs, as well as repressing CSF-1R target genes [41].
Figure 2. A transcriptional network of expression data derived from 50 ng/ml LPS time-course treatment of (C57BL/6) macrophages.

A Pearson correlation matrix of transcript-to-transcript profile comparisons was used to filter the LPS time-course data for expression correlation relationships of r > 0.95. A network graph of 2950 nodes (transcripts), connected by 174,621 edges (r≥0.95), was generated. To identify cohorts of tightly coexpressed genes, the graph was clustered using a graph-based clustering algorithm MCLi value of 1.7. Nodes within the graph sharing the same color belong to the same cluster, and clusters are labeled according to their number ID. The average expression profiles of transcripts within selected clusters are shown across the sampled treatment times, along with the number of transcripts within the cluster and example genes. The graphs are grouped into clusters representing different patterns of temporal regulation (e.g., up-early or up-late).
Costelloe et al. [15] reported previously that certain LPS-responsive genes responded differently to different doses of LPS. Such differential sensitivity might arise if the two LPS signaling pathways have distinct sensitivities, and it could be important to ensure that the response is commensurate with the magnitude of the challenge. No previous genome-scale studies have considered dose responsiveness. Accordingly, C57BL/6 macrophages were treated with three different doses of LPS (0.5, 5, and 50 ng/ml), and the transcriptional response was assessed at five time-points following administration. A network graph of prefiltered expression data was constructed from transcript-to-transcript, at r > 0.87. The graph comprised 8425 nodes (transcripts) connected by 805,049 edges (correlations >0.87), and was clustered at a MCLi of 2.2. Transcripts (6160) were classified as being within clusters of genes regulated by LPS treatment, 3517 transcripts classified as down-regulated and 2643 transcripts as belonging to up-regulated clusters.
The data allow analysis of the dose-responsive elements to the LPS response. The relative AUC of each up-regulated transcript at one dose treatment versus another was measured and comparisons made across all three dose treatments. Nineteen different patterns were detected (Supplemental Fig. 1) and simplified into five broad groups based on most-similar overall patterns, as shown in Fig. 3. Breakdown of the gene membership in the five categories is described in Supplemental Fig. 1 and a full list of the 6160 transcripts and their dose-responsiveness and cluster categories is detailed in Supplemental Table 2 (Excel file LPS dose-response analysis columns).
Figure 3. Dose-responsive pattern of genes regulated in response to LPS treatment.

Five predominant patterns of expression in response to different doses of LPS were observed; a positive correlation of gene expression with dose, no change in gene expression level in response to dose (not dose responsive), gene expression highest at a submaximal dose of LPS (up most at 5 ng), gene expression lowest at a submaximal dose of LPS (up least at 5 ng), and a negative correlation of gene expression with increasing dose (inverse dose-responsive).
Fifty-six percent of the inducible genes (1480 transcripts) were found to be dose-responsive; that is to say that their expression increased with the dose of LPS. Many chemokines and cytokines are among the inducible genes that show clear dose-dependence, suggesting that the overall inflammatory response depends on the magnitude of the challenge (Fig. 3). Genes (24.7%) were maximally expressed even at the 0.5-ng/ml dose (assessed as being <1.5-fold, different across comparisons at the three different doses). Genes (4.7%) displayed their highest expression level at 5 ng/ml LPS, and 5.1% of genes also showed lowest levels of induction at 5 ng/ml LPS. Genes (9.5%) showed an inverse correlation with increasing dose, meaning that their level of induction was reduced with increasing LPS doses. Of the 169 transcripts up-regulated by 1 h, 106 were dose-responsive, including six different DUSPs (Dusp1/4/5/8/10/14). Dose dependence is not related to time of stimulation. In keeping with earlier data [15], Tnf was also induced maximally at 1 h by the lowest LPS dose, whereas induction of Ifnb1, maximal at 1–2 h, was dose-dependent. A visualization of these dose-dependent activation profiles is presented using the graph-animation function within BioLayout Express3D, whereby graph nodes increase in size as their expression increases. This highlights the expression levels of the individual transcripts within the up-regulated network graph at the different time-points and LPS concentrations (Fig. 4, and see www.macrophages.com/Raza2013#LPS-dose). A hierarchical interaction network of the up-regulated clusters is also presented (Fig. 5). The graph is arranged to flow from left to right and in this direction, displays the temporal changes in transcript abundance. (Supplemental Fig. 1 summarizes the numbers of genes in each dose-responsive category at each time phase.) The proportion of nondose-responsive transcripts increased with the time-course, as did those whose expression was inversely correlated with dose (Fig. 5).
Figure 4. Graph animation of the up-regulated transcriptional response of BMDMs to stimulation with three different doses of LPS and over time.
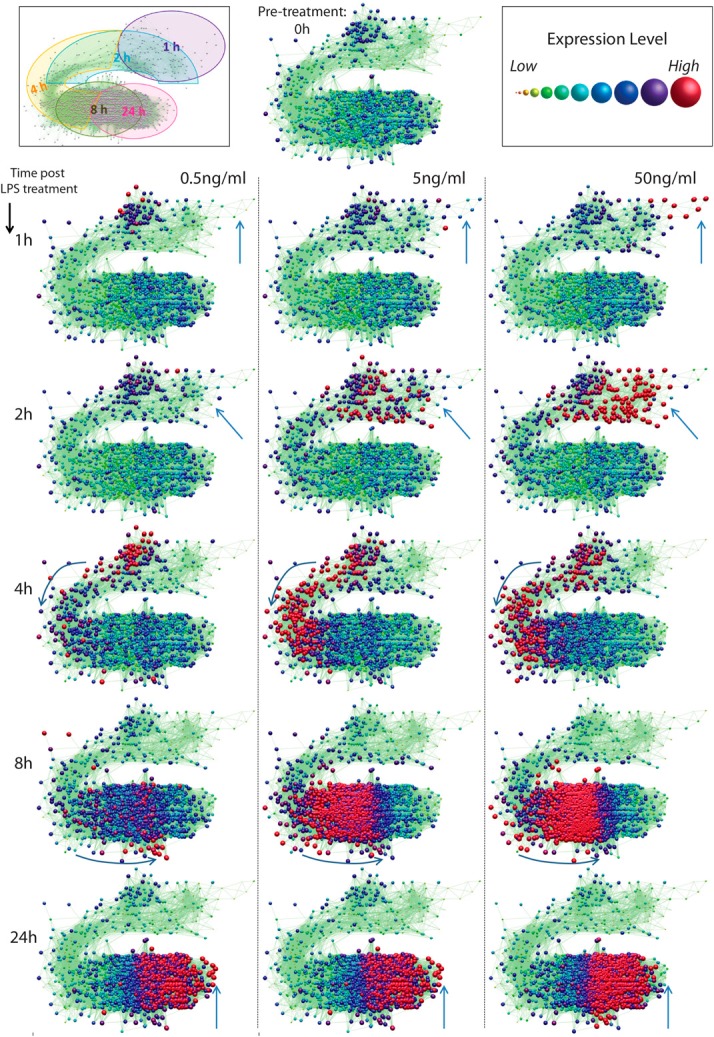
A network graph of transcripts up-regulated in response to LPS has been animated. such that nodes are colored and sized according to their relative expression levels at each time-point/condition. The size/color of a node is determined by its relative expression level: large, red nodes denote transcripts at or near their maximal expression level; small, yellow nodes represent transcripts expressed at a relatively low level relative to their maximal expression. (Inset, upper left) General trend in the temporal response across the graph; for example, nodes in the upper right graph area are expressed from 1 h or 1–2 h post-LPS. Arrows indicate areas of main differences at each time-point. Real-time animations of these data can be viewed within the tool BioLayout Express3D.
Figure 5. Hierarchical cluster interaction network of the up-regulated transcriptional response to LPS.

The graph is arranged to flow from left to right and in this direction displays the temporal changes in transcription (genes up-regulated from early time-points (1 h) to late (24 h). The nodes are colored according to their pattern of dose-responsiveness.
Strain-specific response to LPS
We carried out a comparative time-course analysis of the response of macrophages from C57BL/6 and BALB/c mice to a single submaximal dose of LPS (5 ng/ml). A filtered list of >1945 genes that showed differential expression was subjected to network analysis at a value of r > 0.85. The resultant graph of 1754 nodes connected by 58,445 edges was clustered at a MCLi of 2.2, generating 46 clusters with a membership of at least five nodes. Clusters of coexpressed genes were inspected, and their patterns of expression, over-represented GO terms, and examples of genes are summarized in Fig. 6 and in Supplemental Table 2 (Excel file mouse-strain comparison columns). The largest of these clusters (Cluster 1) contained up-regulated genes whose expression was higher in C57BL/6 than BALB/c mice before stimulation. Many of these were known IFN targets, consistent with the innate IFN signaling in macrophages derived from C57BL/6 mice (Fig. 6). Genes in Cluster 2 (associated with proton and hydrogen transport) were repressed in both strains but were expressed higher in BALB/c. Cluster 4 represented 150 transcripts induced to a much-greater extent in C57BL/6 macrophages; the GO annotation enrichment included “complement activation”. Stat4 was present in this cluster, as were a number of its well-known transcriptional targets (C1qa, C1qb, C1qc, Cd28). These genes have each been implicated in SLE susceptibility [42–44], as have several other genes (Cd244, Gpr77, Nlrp1a, Nlrp1c) within the cluster [45–48]. Cluster 5 genes exhibited the opposite trend, comprising 99 transcripts expressed at a higher level in BALB/c, which are associated with immune signaling, cytokine production regulation, and histocompatibility antigens. Other clusters exhibited idiosyncratic patterns that serve to illustrate the subtle connections within the transcriptional cascade.
Figure 6. Clusters of coexpressed genes in LPS-treated BMDMs derived from C57BL/6 or BALB/c mice.

The patterns of expression across clusters of coexpressed genes in a comparison of the 5-ng/ml LPS response in macrophages derived from two different strains of mice—C57BL/6 or BALB/c.
A number of macrophage-expressed genes were absent in BALB/c compared with C57BL/6 or vice versa. To identify additional genes showing deleted (null) expression in one strain or the other, further filtering steps were applied to the dataset (see Materials and Methods) to produce a short list of 124 genes expressed in a strain-specific manner (see Supplemental Table 2, Column J). Sixty-three of the most compelling examples of strain-specific/biased expression from this short list and the cluster analysis are shown in Supplemental Fig. 2, and six examples from these are shown in Fig. 7. For example, the class II MHC gene H2-Ea is known to be deleted in C57BL/6 [49, 50]; in this study, H2-Ea was undetectable in C57BL/6 BMDMs but was strongly LPS-inducible in BMDMs from BALB/c mice. The absence of cathepsin E in C57BL/6 macrophages also confirms earlier findings [51].
Figure 7. Expression profiles of six genes in mouse macrophages derived from BALB/c or C57BL/6 bone marrow and treated with 5 ng/ml LPS.

Macrophages were treated with 5 ng/ml LPS, and gene expression was measured at 1, 2, 4, 8, and 24 h pre- or post-treatment (0 h). Shown above are six example transcripts behaving differentially across macrophages from the different strains, as determined by statistical filtering and manual inspection of individual profiles. Full gene lists are available at www.macrophages.com/Raza2013-expression-networks and in Supplemental Fig. 2. Some transcripts are expressed in one strain (or the other) regardless of LPS treatment, although LPS treatment may alter their expression over time.
Comparison of macrophage response with IFN-β, IFN-γ, or LPS treatment
As noted in the Introduction, the responses to type I and type II IFNs in macrophages are subtly different in terms of signaling, and IFN-β is known to be an autocrine regulator in LPS signaling. As C57BL/6 macrophages constitutively express many IFN-regulated transcripts, we restricted the comparative analysis of the responses to these three agonists to the BALB/c line. Macrophages derived from BALB/c mice were stimulated with 10 U/ml IFN-β, 10 U/ml IFN-γ, or 5 ng/ml LPS. A network graph of prefiltered expression data was created by filtering for coexpression relationships at a threshold of r > 0.85, generating a graph of 3747 nodes connected by 172,688 edges. The graph was then clustered at a MCLi of 2.2, and clusters were inspected for patterns of expression associated with the three treatments over the time-course and annotated accordingly (see Supplemental Table 2; Excel file IFNβ/γ, and LPS analysis columns). Examples of the average expression profile across six different clusters of coexpressed genes are shown in Fig. 8A. To visualize better the overlap and divergence in the transcriptional response to IFN-β, IFN-γ, and LPS, network diagrams displaying the target genes of each treatment were generated (Fig. 8B). Connections (edges) were defined between the treatment type (IFN-β, IFN-γ, and LPS) and the genes regulated in response to a given treatment. If a particular gene was regulated in response to all three treatments, then there would be three input edges into the gene. Connections from treatment type to genes were captured regardless of the extent of transcriptional induction; i.e., genes preferentially induced by LPS and also induced in response to IFN-β and IFN-γ (but to a lesser extent) are connected to all three treatment types. The up-regulated response comprised transcriptional targets common to all three treatments (948 transcripts), targets shared between two treatments only (IFN-γ and IFN-β: 33, IFN-γ; LPS: 11, LPS; IFN-β: 111 transcripts), and genes unique to the individual treatments (IFN-γ: 50; IFN-β: 115; LPS: 727 transcripts). In contrast to the inducible response, all of the down-regulated targets were essentially common to all three stimuli, albeit to varying degrees. The group of IFN-β-specific transcripts was unexpected, given that LPS also induces type I IFN signaling. The most distinctly IFN-β-specific, inducible genes included; Casp2, Gpsm2, Grap2, Klrg2, Tnfsf8, Uaca, Abcb1a, Gna14, HapI, Slc4a11, Cd4, Cdkn1c, and Lrrc14b. IFN-γ-specific transcripts included the C1q subunits (C1qa, C1qb, C1qc), C4b, Chrm3, Clec9a, Tnik, Naaa, Selp, Tgm1, and Traf3ip2. Irf8 was also induced by IFN-β but to a far greater extent by IFN-γ and was not activated in response to LPS. There were also other genes inducible by IFN-γ and IFN-β but were not induced (or far less inducible) by LPS, including Fcgr4, Flrt2, Treml2, Ccr1, Gpr146, Ppp1r3d, Card6, Clec1a, Ifitm6, Klk1, Klk1b11, Klk1b21, Ctnnd2, Hpse, Il12rb2, Ncoa3, Gprc5b, Il18rap, Slc26a2, Amotl2, and Gadd45g.
Figure 8. The overlap and divergence in the transcriptional targets of LPS, IFN-β, and IFN-γ signaling in mouse BMDMs.

(A) Average expression profile of transcripts within clusters associated with changes across three different treatments in mouse BMDMs. Expression levels are plotted across the different time-points sampled and the different treatments (IFN-β, IFN-γ, and LPS). GO terms associated with each cluster and example genes are shown to the right of each plot. Cluster 12 represents transcripts expressed to a similar degree regardless of treatment type. Clusters 5 and 9 transcripts are preferentially expressed in LPS-treated cells. Cluster 10 expression is restricted to/greater in IFN-β-treated cells, whereas Cluster 14 transcript expression is restricted to IFN-γ-treated macrophages. (B) Network showing overlap in the up-regulated transcriptional targets of IFN-β, IFN-γ, and LPS in BALB/c-derived macrophages. The left side shows each stimulus, and the right side displays the transcriptional targets of the stimuli. Some transcripts are specific to each treatment, whereas others overlap.
Comparison with previous studies
Advances in genomics technology and the availability of new reagents mean that it is now possible to begin to understand the factors that regulate the transcriptional response to LPS and other activating factors [38, 52]. We therefore decided to examine the similarity between the data reported by Amit et al. [37], on the transcriptional response of BMDCs derived from C57BL/6J to five TLR agonists at nine time-points following stimulation, and the data reported here. Network analysis of the Amit et al. [37] data showed that the cells responded similarly with time-dependent activation and suppression of a large number of genes. There were also clear differences in ligand-dependent gene activation, as well as many commonalities, as originally reported [37]. Mapping the expression clusters between the two datasets showed a significant overlap between the studies. One notable exception was a distinct lack of expression of cell cycle-related (S-, G2-, and M-phase) genes in the Amit et al. [37] data, which in the current study, were down-regulated strongly upon activation. This group also went on to examine the DNA interaction dynamics of 25 transcription factors in this cell system [38]. We therefore performed a hypergeomtric test to examine both sets of expression clusters for an enrichment (Bonferroni corrected, P<0.0001) of genes that are known targets of the 25 transcription factors. As a result of the differences in the cell populations used, array platform used, and experimental conditions, the power of such analyses is limited. However, there was a striking similarity between the two analyses in terms of the enrichment of transcription factor-binding site analyses of the main gene clusters observed in the two studies. For example, the main up-regulated cluster of genes (Cluster 2; maximum expression, 8–24 h post-activation) in both studies was enriched with genes with motifs for the following factors: Atf3, Cebpb, Rel, E2f1, Irf1, Irf2, Irf4, Junb, Krox20, Maff, Nfkb1, PU.1 (Spi1), Rela, Relb, Runx1, Stat1, Stat2, and Stat3, with the current also showing an enrichment for Ets2 binding. Other large, up-regulated gene clusters, especially in the Amit et al. [37] study, showed a similar profile of transcription factor-binding site enrichment, albeit without enrichment for some of the factors mentioned above. Similarly, the largest cluster of down-regulated genes in both studies (Cluster 1) exhibited an enrichment in binding sites for Atf3, Cebpb, E2f1, E2f4, Egr1, Ets2, Hif1a, Irf1, Irf4, Junb, Krox20, Maff, PU.1 (Spi1), Rela, and Runx1, although no enrichment for Hif1a was observed in the current study. Again, other down-regulated clusters, especially in the current study, showed an overlapping profile of motif enrichment but also with enrichment in a number of other factors, particularly early response genes, including as Fos, Jun, Junb, Rel, as well as Stat family members 1, 2, and 3 and Nfkb1.
DISCUSSION
The transcriptomic response of mouse macrophages to LPS has been studied in considerable detail. A recent study by Bhatt et al. [53] documented the immediately early response to LPS over the first 2 h in BMDM, separately examining the events in transcript initiation, elongation, processing, and polyadenylation. These authors noted that the early response genes tend to be associated with CpG islands and pre-exist in open chromatin. By contrast, secondary response genes, many of which required autocrine IFN signaling via IFNAR1, as described previously [5, 6], required chromatin remodeling before transcriptional activation. A similar dichotomy in terms of the chromatin status of LPS-inducible genes was reported by Iglesias et al. [54]. Pre-existing chromatin states of genes, potentially LPS-inducible, depend, at least in part, on the macrophage-specific transcription factor, PU.1 [55]. Although endogenous IFN has been firmly implicated in LPS signaling, no previous study has compared the responses to IFN with LPS or considered the dose response. Furthermore, most studies have focused only on early response genes and only on the C57BL/6 mouse strain. The weakness of the C57BL/6 mouse as a model for human macrophages has been demonstrated elsewhere [24], and Wells et al. [23] showed that individual mouse strains vary widely in their response to LPS. So, it is legitimate to question to which extent the response of C57BL/6 mice are representative of the responses of the majority of laboratory mouse strains or of wild-type mice. The IFN-β-, IFN-γ-, and LPS-activated signaling pathways also converge at a number of levels. Indeed, classical activation of macrophages is only truly attained by IFN-γ exposure, in concert with a microbial stimulus, such as LPS. The cellular actions of IFNs are mediated via their regulation of subsets of genes (known as IFN-stimulated genes). Variance in the type I and type II transcriptional signatures is potentially fundamental in the nonredundant activities of these cytokines, i.e., where one IFN cannot substitute for the lack of another, as demonstrated in experimental and clinical states of infection [20, 21] but to date, has not been studied in detail. By exploring a much wider set of variables and analyzing the data, based on a network-clustering approach, we reveal that LPS-regulated genes can be subdivided into a larger number of subsets.
One important variable that is not commonly considered in the actions of LPS on BMDM is the presence of CSF-1. Many studies do not report whether it is re-added following harvesting. The presence of CSF-1 increases responsiveness to LPS [33], and some genes are only induced in its presence [41]. Its continued presence also ensures that most BMDMs are in cell cycle, and LPS causes growth arrest [41]. This study shows that this is also the case with type I and type II IFN activation. This impacts upon the nature of the coexpression clusters, seen when we reiterate the standard model used by others, the C57BL/6 BMDM. We see a sequential cascade that continues out to 24 h (Fig. 2). We note the existence of large sets of down-regulated genes (Clusters 1 and 4), many of which are known to be associated with the cell cycle.
Previous microarray studies of the LPS response have used a range doses of LPS and LPS derived from different species of Gram -ve bacteria [24, 56–58]. The relative dose of endotoxin is acknowledged to impact on the expression of downstream targets [12], yet a comprehensive analysis of the dose-dependent actions of LPS is currently lacking. We found that the majority (56%) of the LPS-inducible response was positively correlated with increasing dose. Part of this might be attributed to the type I response (MyD88-independent pathway), as the expression of IFN-β was itself dose-responsive (see www.macrophages.com/Raza2013#LPS-dose), as were many type I response genes (Fig. 3). Corresponding, nondose-responsive targets were over-represented among the LPS-specific genes (MyD88-dependent targets), whereas 75% of genes common to IFN-β and LPS treatment were dose-responsive. The early response to LPS, i.e., genes up-regulated by 1 h, comprised a number of transcripts known to encode transcription factors or associated with transcriptional regulation (e.g., enhancers), and a majority (60%) of these were dose-responsive. This was also true for signaling feedback inhibitors (Socs3, Dusp1/5/8/10/14), cytokines and their receptors. Regardless of the time-phase, most cytokines were dose-responsive, with the exception of Cxcl16 (which was not dose-responsive) and Cxcl2/3 (whose expression was maximal at the 5-ng/ml dose; Fig. 3), suggesting that the potential to recruit other immune cells increases at higher LPS dose challenges. This also translates to an in vivo context, where the host must orchestrate an immune response relative to the challenge.
Expression of 250 transcripts (9.5% of up-regulated targets) was inversely correlated with dose, 71 of which encoded transmembrane proteins, 25 were associated with the endoplasmic reticulum, 13 were solute carrier proteins, and 11 were zinc finger proteins. The CSF-1R-encoding gene, Csf1r, was among the inverse-correlated targets, which was maximally induced at the lowest dose (0.5 ng/ml) but repressed at 50 ng/ml. Some transcripts, whose expression was inversely correlated with dose, are targets of CSF-1 signaling. Interestingly, two genes, expressed to a greater extent at the lowest doses (Gss and Gsta3), are involved in cellular antioxidant mechanisms and cellular protection from oxidative damage by free radicals. Phagocyte-derived reactive oxygen and nitrogen species are crucial to the antimicrobial response [59]. It is possible that their enzymatic detoxification is promoted where the bacterial load is less threatening to the host and may explain the higher expression of Gss and Gsta3 at the lower doses of LPS in our data.
It seems likely that differential structural requirements for the MyD88-dependent and MyD88-independent signaling pathways underlie the dose dependence. The absolute requirement of CD14 for TLR4 signaling varies with dose of LPS [60], and CD14 is dispensable at higher LPS doses. It has been suggested that TLR4 engagement of downstream adaptor proteins MyD88 and TLR adaptor molecule 1 (Toll-IL-1R domain-containing adaptor-inducing IFN-β) depends on the conformational arrangement of TLR4 [61]. Our own data indicated that Tollip expression was inversely correlated with dose. Tollip forms part of the TLR4 receptor signaling complex and has been shown to regulate the magnitude of proinflammatory cytokine production to low and physiological concentrations of LPS but not lethal doses of LPS [62].
C57BL/6 mice are particularly susceptible to experimental models of organ-specific autoimmune disease [63], whereas BALB/c are susceptible to Th2-associated fibrotic diseases and asthma models [64, 65]. The baseline expression of type I IFN targets was higher in the C57BL/6 strain compared with BALB/c (Fig. 6), consistent with observations of others [66]. A second set of genes was expressed selectively in C57BL/6 and repressed by LPS. It included several genes implicated in susceptibility to SLE: the C1q subunits [42], Stat4 [44], and Cd28 [43]. Unabated production of IFN is common in SLE patients, as is the up-regulation of IFN-stimulated genes in the PBMCs of patients [67, 68]. Our analysis suggests higher SLE susceptibility expression in C57BL/6 mice compared with BALB/c. Aside from genes that were differentially regulated, we also mined the dataset to identify genes where expression appeared deleted in one strain versus the other. Sixty-three of the most compelling examples of strain-specific expression are shown in Supplemental Fig. 2 and six examples in Fig. 7. This list of genes, showing null expression in one strain, included some known examples, as well as others previously uncharacterized. Known genes that are expressed in C57BL/6 but are essentially absent in BALB/c include Nlrp1c and Trim12. Those detected in BALB/c but not C57BL/6 include Cxcl14, Ctse, Gbp1, Ifi202b, and H2-Ea (Supplemental Fig. 2). These differences place some limits on the extent to which either strain can be used as a general model of mouse immunobiology. For example, the absence of Ctse and H2-Ea is likely to impact significantly on antigen presentation and might contribute to a misleading view of the relative importance of macrophages and DCs in antigen presentation [69].
The transcriptional activation profile of mouse BMDMs treated with IFN-β, IFN-γ, and LPS has been studied previously [10, 39, 40, 70–73], but a direct comparison has not been attempted. We studied the biology in BALB/c mice because of the basal autocrine IFN stimulation in C57BL/6 confirmed herein. The inducible transcriptional response was also much broader and potent (in terms of fold-change induction) in LPS-treated macrophages compared with those treated with IFN-β or IFN-γ. Among the transcripts induced specifically in LPS treatment was a cluster of 92 early-response genes, including Dusp1/4/5/8/14, regulators of the NF-κB system (Nfkbia/d/z), transcripts representing microRNAs (Mir17/18/19a/19b1/221/222/92-1), and the Irf4 (Fig. 8). This cluster of genes is indicative of negative-feedback control of TLR4-activated pathways. Irf4, MAPK phosphatases (Dusp), and certain microRNAs have been shown to mediate TLR signaling and proinflammatory cytokine production in macrophages [74–76]. Based on this functional annotation, other coregulated genes within this cluster may be potential candidates for factors involved in the (negative) regulation of signaling pathways downstream of TLR activation. There were a number of other clusters representing expression restricted to or enriched for LPS treatment (e.g. Clusters 2, 3, and 5; www.macrophages.com/Raza2013#LPS-vs-interferon). These “LPS-centric” clusters included chemokines (Ccl9, Ccl17, Ccl22, Ccl24, Cxcl1, Cxcl16, Cxcl3, Cxcl2, Cxcl1, Tnf); ILs (Il12a, Il12b, Il17rd, Il18, Il1a, Il12, Il6); IL receptor subunits (Il17rd, Il20rb, Il2ra); MAPK signaling components (Map3k10, Mapkapk2, Mapkbp1); members of the NF-κB transcription factor family: Bcl3, Rel, Rela, Relb; type I IFN signaling (Ifnb1, Ifnar1); Csf-1; and eight transcripts encoding zinc finger proteins. These observations fit with the literature, as LPS is known to induce CSF-1 in macrophages [77], and a number of zinc finger proteins have been found to regulate proinflammatory activation in macrophages [78]. Other genes characteristic of classical macrophage activation were also within LPS centric clusters: Nos2, Ccl5, and Ccr7 [79].
Common to all three treatments was the repression of genes associated with cell cycle (Cluster 1). These genes were repressed, to a greater extent, in LPS treatment compared with cells treated with IFN-β or IFN-γ. Transcripts induced to a similar extent in all three treatments included the transcription factors Stat1, Stat3, and Irf5, as well as GBPs (Gbp1/2/6/9). High Irf5 expression has been suggested as being characteristic of M1 macrophages [80], and Stat1 is required for executing type I and type II IFN signaling, as well as LPS-induced gene expression [17]. The response to IFN-β and LPS was more overlapping than that of LPS and IFN-γ. Genes shared by LPS and IFN-β were predominantly type I IFN targets (Ifi202b/204/205/35/44, Ifit2/3, Ifih1, Oas1a/1b/1g, Oas2/l1/l2, Mx1). There were also transcripts (Cluster 34), expressed specifically in IFN-γ or LPS treatment but not IFN-β treatment, such as MHC class II antigens (Cd74, H2-Aa, H2-Ab1, H2-Ea) or related proteins (for example, Ctsh, which encodes a lysosomal cysteine proteinase required for degradation of lysosomal proteins). Therefore, this dataset presents a number of MHC class II candidates, induced (at the message level, at least) by LPS in mouse BMDMs, independently of IFN-γ.
Cluster 14 (45 transcripts) represented transcripts whose expression was specific to IFN-γ-treated cells and included the MHC class II-related transcripts: H2-DMa, H2-DMb2, H2-Eb1, Ciita, as well as the transcripts encoding complement components: C1qb, C1qc, C1qa, C4b (expressed constitutively in C57BL/6). The full spectrum of classical activation of macrophages is thought to be induced by IFN-γ in concert with a microbial stimulus, such as LPS [17]. Two clusters (Clusters 10 and 36) comprised transcripts whose expression was mostly restricted to IFN-β treatment. Functional annotation of these IFN-β-enriched clusters was poor. Some of the most IFN-β-specific transcripts included Casp2, which was induced as early as 1 h by IFN-β, yet repressed in response to LPS treatment. The LPS response is known to possess an antiapoptotic component [81], and the repression of Casp2 could be an example of an antiapoptotic mechanism used in macrophages in response to endotoxin. Hence, there is a level of intersection between the MyD88-dependent and MyD88-independent pathways that means that the LPS response is not simply the sum of the two responses. The difference between the type I and type II transcriptional signatures reflects the distinct signaling pathways and the fact that they have nonredundant biological functions [20, 21].
The literature on macrophage “activation” has been strongly influenced by the concept of M1 (classical) and M2 (alternative) activation [82], although others have preferred the concept of continuum of states [83]. The data herein show that the classical response depends on mouse strain, dose, and nature of agonist. We have included CSF-1, as it is present constitutively in vivo, but this is also an important regulator [33]. The differences between the two mouse strains include genes that are completely undetectable in a strain-specific manner, as well as major regulatory differences. These differences are not unique to the mouse strains chosen; an earlier study revealed substantive differences in the DBA/2 and C3H strains [23]. The complete sequencing of 17 common inbred strains [84] reveals very large differences between the strains, including ∼85 acquired stop codons/strain, substantial segments that cannot be mapped to the C57BL/6 reference, and documented allele-specific transcription in 12% of genes in an F1 cross between two strains. Not surprisingly, the differences are even greater between inbred and wild-type-derived strains. Aside from genetic background, the in vitro models, looking at one factor, neglect the complex cytokine milieu within an inflammatory site, which itself changes with time, and the distinct set of regulatory pathways generated in response to different pathogen-associated molecules.
To compare the current study with those that have gone before it, we reanalyzed the data generated by Amit et al. [37], describing the transcriptional response of BMDCs to five TLR agonists at nine time-points following stimulation. Both datasets were generated on monocyte-derived cells. The current study used CSF-1 to differentiate the cells to “BMDM” cells, whereas the Amit et al. [37] study used CSF-2 to generate “BMDC”; however, the overall expression profiles of these cells have been shown to be similar [32]. The microarray platforms used were also different, as was the experimental design of both studies. Despite these differences, the overlap in the genes induced or repressed in the two studies was considerable. We went on to show that the enrichment of known transcription factor-binding sites (as defined by Garber et al. [38]) in the expression analyses was similar in the main clusters of genes up- as well as down-regulated. One notable exception was the enrichment of motifs for a number of early response genes, including as Fos, Jun, Junb, Rel, as well as Stat family members 1, 2, and 3 and Nfkb1 in the down-regulated clusters observed here. One explanation for this observation is that the BMDMs used in this study were actively proliferating, and genes associated with the cell cycle were strongly down-regulated by LPS and type I and type II IFN. In contrast, cell-cycle genes were not expressed or were expressed at very low levels in the Amit et al. [37] data and therefore, not down-regulated during activation. In summary, each gene has its own unique promoter, and each individual animal or human produces a unique response to a unique stimulus. Models need to be interpreted and generalized with caution.
Supplementary Material
ACKNOWLEDGMENTS
This work was funded, in part, by the Biotechnology and Biological Sciences Research Council and the microarray analyses were performed as part of the Wellcome Trust Course on Funtional Genomics and Systems Biology, Hinxton with support from Affymetrix.
SEE CORRESPONDING EDITORIAL ON PAGE 161
The online version of this paper, found at www.jleukbio.org, includes supplemental information.
- AUC
- area under curve
- BMDC
- bone marrow-derived DC
- BMDM
- bone marrow-derived macrophage
- DAVID
- Database for Annotation, Visualization, and Integrated Discovery
- GEO
- Gene Expression Omnibus
- GO
- Gene Ontology
- Gss
- glutathione synthetase
- IRF
- IFN regulatory factor
- MCL
- Markov-clustering
- MCLi
- Markov-clustering inflation value
- r
- Pearson correlation coefficient
- SLE
- systemic lupus erythematosus
- WT
- whole transcript
AUTHORSHIP
S.R. was instrumental in the design of the study, performed all experiments (cell culture, treatment, and microarray processing), analyzed/interpreted the gene-expression data, and was a primary author of the manuscript. M.W.B. made significant contributions to the laboratory procedures (cell culture, treatment, and microarray processing). D.A.H. was instrumental in the experimental design and interpretation of results and was a primary author of the manuscript. Z.I. and I.A. performed the enrichment analysis of coexpression clusters. T.C.F. conceived of and designed the study, contributed to the microarray processing, oversaw the data analysis, and was a primary author of the manuscript. All authors read and approved the final manuscript.
DISCLOSURES
The authors declare no conflicts of interest.
REFERENCES
- 1.Pluddemann A., Mukhopadhyay S., Gordon S. (2011) Innate immunity to intracellular pathogens: macrophage receptors and responses to microbial entry. Immunol. Rev. 240, 11–24. [DOI] [PubMed] [Google Scholar]
- 2.Hume D. A., Underhill D. M., Sweet M. J., Ozinsky A. O., Liew F. Y., Aderem A. (2001) Macrophages exposed continuously to lipopolysaccharide and other agonists that act via Toll-like receptors exhibit a sustained and additive activation state. BMC Immunol. 2, 11. [DOI] [PMC free article] [PubMed] [Google Scholar]
- 3.Biswas S. K., Chittezhath M., Shalova I. N., Lim J. Y. (2012) Macrophage polarization and plasticity in health and disease. Immunol. Res. 53, 11–24. [DOI] [PubMed] [Google Scholar]
- 4.Lu Y. C., Yeh W. C., Ohashi P. S. (2008) LPS/TLR4 signal transduction pathway. Cytokine 42, 145–151. [DOI] [PubMed] [Google Scholar]
- 5.Karaghiosoff M., Steinborn R., Kovarik P., Kriegshauser G., Baccarini M., Donabauer B., Reichart U., Kolbe T., Bogdan C., Leanderson T., Levy D., Decker T., Muller M. (2003) Central role for type I interferons and Tyk2 in lipopolysaccharide-induced endotoxin shock. Nat. Immunol. 4, 471–477. [DOI] [PubMed] [Google Scholar]
- 6.Thomas K. E., Galligan C. L., Newman R. D., Fish E. N., Vogel S. N. (2006) Contribution of interferon-β to the murine macrophage response to the Toll-like receptor 4 agonist, lipopolysaccharide. J. Biol. Chem. 281, 31119–31130. [DOI] [PubMed] [Google Scholar]
- 7.Medzhitov R., Horng T. (2009) Transcriptional control of the inflammatory response. Nat. Rev. Immunol. 9, 692–703. [DOI] [PubMed] [Google Scholar]
- 8.Hargreaves D. C., Horng T., Medzhitov R. (2009) Control of inducible gene expression by signal-dependent transcriptional elongation. Cell 138, 129–145. [DOI] [PMC free article] [PubMed] [Google Scholar]
- 9.Gilchrist M., Thorsson V., Li B., Rust A. G., Korb M., Roach J. C., Kennedy K., Hai T., Bolouri H., Aderem A. (2006) Systems biology approaches identify ATF3 as a negative regulator of Toll-like receptor 4. Nature 441, 173–178. [DOI] [PubMed] [Google Scholar]
- 10.Nilsson R., Bajic V. B., Suzuki H., di Bernardo D., Bjorkegren J., Katayama S., Reid J. F., Sweet M. J., Gariboldi M., Carninci P., Hayashizaki Y., Hume D. A., Tegner J., Ravasi T. (2006) Transcriptional network dynamics in macrophage activation. Genomics 88, 133–142. [DOI] [PubMed] [Google Scholar]
- 11.Boldrick J. C., Alizadeh A. A., Diehn M., Dudoit S., Liu C. L., Belcher C. E., Botstein D., Staudt L. M., Brown P. O., Relman D. A. (2002) Stereotyped and specific gene expression programs in human innate immune responses to bacteria. Proc. Natl. Acad. Sci. USA 99, 972–977. [DOI] [PMC free article] [PubMed] [Google Scholar]
- 12.Huang H., Fletcher A., Niu Y., Wang T. T., Yu L. (2012) Characterization of lipopolysaccharide-stimulated cytokine expression in macrophages and monocytes. Inflamm Res. 61, 1329–1338. [DOI] [PubMed] [Google Scholar]
- 13.Gioannini T. L., Teghanemt A., Zhang D., Coussens N. P., Dockstader W., Ramaswamy S., Weiss J. P. (2004) Isolation of an endotoxin-MD-2 complex that produces Toll-like receptor 4-dependent cell activation at picomolar concentrations. Proc. Natl. Acad. Sci. USA 101, 4186–4191. [DOI] [PMC free article] [PubMed] [Google Scholar]
- 14.Haziot A., Ferrero E., Kontgen F., Hijiya N., Yamamoto S., Silver J., Stewart C. L., Goyert S. M. (1996) Resistance to endotoxin shock and reduced dissemination of gram-negative bacteria in CD14-deficient mice. Immunity 4, 407–414. [DOI] [PubMed] [Google Scholar]
- 15.Costelloe E. O., Stacey K. J., Antalis T. M., Hume D. A. (1999) Regulation of the plasminogen activator inhibitor-2 (PAI-2) gene in murine macrophages. Demonstration of a novel pattern of responsiveness to bacterial endotoxin. J. Leukoc. Biol. 66, 172–182. [DOI] [PubMed] [Google Scholar]
- 16.Mosser D. M. (2003) The many faces of macrophage activation. J. Leukoc. Biol. 73, 209–212. [DOI] [PubMed] [Google Scholar]
- 17.Schroder K., Sweet M. J., Hume D. A. (2006) Signal integration between IFNγ and TLR signalling pathways in macrophages. Immunobiology 211, 511–524. [DOI] [PubMed] [Google Scholar]
- 18.Liew F. Y., Xu D., Brint E. K., O'Neill L. A. (2005) Negative regulation of Toll-like receptor-mediated immune responses. Nat. Rev. Immunol. 5, 446–458. [DOI] [PubMed] [Google Scholar]
- 19.Gessani S., Belardelli F., Pecorelli A., Puddu P., Baglioni C. (1989) Bacterial lipopolysaccharide and γ interferon induce transcription of β interferon mRNA and interferon secretion in murine macrophages. J. Virol. 63, 2785–2789. [DOI] [PMC free article] [PubMed] [Google Scholar]
- 20.Muller U., Steinhoff U., Reis L. F., Hemmi S., Pavlovic J., Zinkernagel R. M., Aguet M. (1994) Functional role of type I and type II interferons in antiviral defense. Science 264, 1918–1921. [DOI] [PubMed] [Google Scholar]
- 21.Van de Wetering D., van Wengen A., Savage N. D., van de Vosse E., van Dissel J. T. (2011) IFN-α cannot substitute lack of IFN-γ responsiveness in cells of an IFN-γR1 deficient patient. Clin. Immunol. 138, 282–290. [DOI] [PubMed] [Google Scholar]
- 22.Heinz S., Romanoski C. E., Benner C., Allison K. A., Kaikkonen M. U., Orozco L. D., Glass C. K. (2013) Effect of natural genetic variation on enhancer selection and function. Nature 503, 487–492. [DOI] [PMC free article] [PubMed] [Google Scholar]
- 23.Wells C. A., Ravasi T., Faulkner G. J., Carninci P., Okazaki Y., Hayashizaki Y., Sweet M., Wainwright B. J., Hume D. A. (2003) Genetic control of the innate immune response. BMC Immunol. 4, 5. [DOI] [PMC free article] [PubMed] [Google Scholar]
- 24.Schroder K., Irvine K. M., Taylor M. S., Bokil N. J., Le Cao K. A., Masterman K. A., Labzin L. I., Semple C. A., Kapetanovic R., Fairbairn L., Akalin A., Faulkner G. J., Baillie J. K., Gongora M., Daub C. O., Kawaji H., McLachlan G. J., Goldman N., Grimmond S. M., Carninci P., Suzuki H., Hayashizaki Y., Lenhard B., Hume D. A., Sweet M. J. (2012) Conservation and divergence in Toll-like receptor 4-regulated gene expression in primary human versus mouse macrophages. Proc. Natl. Acad. Sci. USA 109, E944–E953. [DOI] [PMC free article] [PubMed] [Google Scholar]
- 25.Kapetanovic R., Fairbairn L., Beraldi D., Sester D. P., Archibald A. L., Tuggle C. K., Hume D. A. (2012) Pig bone marrow-derived macrophages resemble human macrophages in their response to bacterial lipopolysaccharide. J. Immunol. 188, 3382–3394. [DOI] [PubMed] [Google Scholar]
- 26.Mills C. D., Kincaid K., Alt J. M., Heilman M. J., Hill A. M. (2000) M-1/M-2 macrophages and the Th1/Th2 paradigm. J. Immunol. 164, 6166–6173.10843666 [Google Scholar]
- 27.Zawatzky R., Wurmbaeck H., Falk W., Homfeld A. (1991) Endogenous interferon specifically regulates Newcastle disease virus-induced cytokine gene expression in mouse macrophages. J. Virol. 65, 4839–4846. [DOI] [PMC free article] [PubMed] [Google Scholar]
- 28.Schilling E., El Chartouni C., Rehli M. (2009) Allele-specific DNA methylation in mouse strains is mainly determined by cis-acting sequences. Genome Res. 19, 2028–2035. [DOI] [PMC free article] [PubMed] [Google Scholar]
- 29.Van Erp K., Dach K., Koch I., Heesemann J., Hoffmann R. (2006) Role of strain differences on host resistance and the transcriptional response of macrophages to infection with Yersinia enterocolitica. Physiol. Genomics 25, 75–84. [DOI] [PubMed] [Google Scholar]
- 30.Sakthianandeswaren A., Curtis J. M., Elso C., Kumar B., Baldwin T. M., Lopaticki S., Kedzierski L., Smyth G. K., Foote S. J., Handman E. (2010) Fine mapping of Leishmania major susceptibility Locus lmr2 and evidence of a role for Fli1 in disease and wound healing. Infect. Immun. 78, 2734–2744. [DOI] [PMC free article] [PubMed] [Google Scholar]
- 31.Hume D. A., Summers K. M., Raza S., Baillie J. K., Freeman T. C. (2010) Functional clustering and lineage markers: insights into cellular differentiation and gene function from large-scale microarray studies of purified primary cell populations. Genomics 95, 328–338. [DOI] [PubMed] [Google Scholar]
- 32.Mabbott N. A., Kenneth Baillie J., Hume D. A., Freeman T. C. (2010) Meta-analysis of lineage-specific gene expression signatures in mouse leukocyte populations. Immunobiology 215, 724–736. [DOI] [PubMed] [Google Scholar]
- 33.Sweet M. J., Campbell C. C., Sester D. P., Xu D., McDonald R. C., Stacey K. J., Hume D. A., Liew F. Y. (2002) Colony-stimulating factor-1 suppresses responses to CpG DNA and expression of Toll-like receptor 9 but enhances responses to lipopolysaccharide in murine macrophages. J. Immunol. 168, 392–399. [DOI] [PubMed] [Google Scholar]
- 34.Freeman T. C., Goldovsky L., Brosch M., van Dongen S., Maziere P., Grocock R. J., Freilich S., Thornton J., Enright A. J. (2007) Construction, visualisation, and clustering of transcription networks from microarray expression data. PLoS Comput. Biol. 3, 2032–2042. [DOI] [PMC free article] [PubMed] [Google Scholar]
- 35.Van Dongen S., Abreu-Goodger C. (2012) Using MCL to extract clusters from networks. Methods Mol. Biol. 804, 281–295. [DOI] [PubMed] [Google Scholar]
- 36.Huang da W., Sherman B. T., Tan Q., Kir J., Liu D., Bryant D., Guo Y., Stephens R., Baseler M. W., Lane H. C., Lempicki R. A. (2007) DAVID Bioinformatics Resources: expanded annotation database and novel algorithms to better extract biology from large gene lists. Nucleic Acids Res. 35, W169–W175. [DOI] [PMC free article] [PubMed] [Google Scholar]
- 37.Amit I., Garber M., Chevrier N., Leite A. P., Donner Y., Eisenhaure T., Guttman M., Grenier J. K., Li W., Zuk O., Schubert L. A., Birditt B., Shay T., Goren A., Zhang X., Smith Z., Deering R., McDonald R. C., Cabili M., Bernstein B. E., Rinn J. L., Meissner A., Root D. E., Hacohen N., Regev A. (2009) Unbiased reconstruction of a mammalian transcriptional network mediating pathogen responses. Science 326, 257–263. [DOI] [PMC free article] [PubMed] [Google Scholar]
- 38.Garber M., Yosef N., Goren A., Raychowdhury R., Thielke A., Guttman M., Robinson J., Minie B., Chevrier N., Itzhaki Z., Blecher-Gonen R., Bornstein C., Amann-Zalcenstein D., Weiner A., Friedrich D., Meldrim J., Ram O., Cheng C., Gnirke A., Fisher S., Friedman N., Wong B., Bernstein B. E., Nusbaum C., Hacohen N., Regev A., Amit I. (2012) A high-throughput chromatin immunoprecipitation approach reveals principles of dynamic gene regulation in mammals. Mol. Cell 47, 810–822. [DOI] [PMC free article] [PubMed] [Google Scholar]
- 39.Hume D. A., Wells C. A., Ravasi T. (2007) Transcriptional regulatory networks in macrophages. Novartis Found. Symp. 281, 2–18. [DOI] [PubMed] [Google Scholar]
- 40.Ravasi T., Wells C. A., Hume D. A. (2007) Systems biology of transcription control in macrophages. Bioessays 29, 1215–1226. [DOI] [PubMed] [Google Scholar]
- 41.Sester D. P., Trieu A., Brion K., Schroder K., Ravasi T., Robinson J. A., McDonald R. C., Ripoll V., Wells C. A., Suzuki H., Hayashizaki Y., Stacey K. J., Hume D. A., Sweet M. J. (2005) LPS regulates a set of genes in primary murine macrophages by antagonising CSF-1 action. Immunobiology 210, 97–107. [DOI] [PubMed] [Google Scholar]
- 42.Rafiq S., Frayling T. M., Vyse T. J., Cunninghame Graham D. S., Eggleton P. (2010) Assessing association of common variation in the C1Q gene cluster with systemic lupus erythematosus. Clin. Exp. Immunol. 161, 284–289. [DOI] [PMC free article] [PubMed] [Google Scholar]
- 43.Brambila-Tapia A. J., Davalos-Rodriguez I. P., Gamez-Nava J. I., Gonzalez-Lopez L., Medina-Diaz J., Bernard-Medina A. G., Salazar-Paramo M. (2012) CD28 proximal promoter polymorphisms in systemic lupus erythematosus susceptibility. Rheumatol. Int. 32, 2165–2168. [DOI] [PubMed] [Google Scholar]
- 44.Namjou B., Sestak A. L., Armstrong D. L., Zidovetzki R., Kelly J. A., Jacob N., Ciobanu V., Kaufman K. M., Ojwang J. O., Ziegler J., et al. (2009) High-density genotyping of STAT4 reveals multiple haplotypic associations with systemic lupus erythematosus in different racial groups. Arthritis Rheum. 60, 1085–1095. [DOI] [PMC free article] [PubMed] [Google Scholar]
- 45.Furnrohr B. G., Wach S., Kelly J. A., Haslbeck M., Weber C. K., Stach C. M., Hueber A. J., Graef D., Spriewald B. M., Manger K., et al. (2010) Polymorphisms in the Hsp70 gene locus are genetically associated with systemic lupus erythematosus. Ann. Rheum. Dis. 69, 1983–1989. [DOI] [PMC free article] [PubMed] [Google Scholar]
- 46.Kim J. R., Mathew S. O., Patel R. K., Pertusi R. M., Mathew P. A. (2010) Altered expression of signalling lymphocyte activation molecule (SLAM) family receptors CS1 (CD319) and 2B4 (CD244) in patients with systemic lupus erythematosus. Clin. Exp. Immunol. 160, 348–358. [DOI] [PMC free article] [PubMed] [Google Scholar]
- 47.Ota Y., Kawaguchi Y., Takagi K., Tochimoto A., Kawamoto M., Katsumata Y., Gono T., Masuda I., Ikari K., Momohara S., Yamanaka H. (2010) Single nucleotide polymorphisms of CD244 gene predispose to renal and neuropsychiatric manifestations with systemic lupus erythematosus. Mod. Rheumatol. 20, 427–431. [DOI] [PubMed] [Google Scholar]
- 48.Pontillo A., Girardelli M., Kamada A. J., Pancotto J. A., Donadi E. A., Crovella S., Sandrin-Garcia P. (2012) Polimorphisms in inflammasome genes are involved in the predisposition to systemic lupus erythematosus. Autoimmunity 45, 271–278. [DOI] [PubMed] [Google Scholar]
- 49.Dembic Z., Ayane M., Klein J., Steinmetz M., Benoist C. O., Mathis D. J. (1985) Inbred and wild mice carry identical deletions in their E α MHC genes. EMBO J. 4, 127–131. [DOI] [PMC free article] [PubMed] [Google Scholar]
- 50.Mathis D. J., Benoist C., Williams V. E., II, Kanter M., McDevitt H. O. (1983) Several mechanisms can account for defective E α gene expression in different mouse haplotypes. Proc. Natl. Acad. Sci. USA 80, 273–277. [DOI] [PMC free article] [PubMed] [Google Scholar]
- 51.Tulone C., Tsang J., Prokopowicz Z., Grosvenor N., Chain B. (2007) Natural cathepsin E deficiency in the immune system of C57BL/6J mice. Immunogenetics 59, 927–935. [DOI] [PubMed] [Google Scholar]
- 52.Ostuni R., Piccolo V., Barozzi I., Polletti S., Termanini A., Bonifacio S., Curina A., Prosperini E., Ghisletti S., Natoli G. (2013) Latent enhancers activated by stimulation in differentiated cells. Cell 152, 157–171. [DOI] [PubMed] [Google Scholar]
- 53.Bhatt D. M., Pandya-Jones A., Tong A. J., Barozzi I., Lissner M. M., Natoli G., Black D. L., Smale S. T. (2012) Transcript dynamics of proinflammatory genes revealed by sequence analysis of subcellular RNA fractions. Cell 150, 279–290. [DOI] [PMC free article] [PubMed] [Google Scholar]
- 54.Iglesias M. J., Reilly S. J., Emanuelsson O., Sennblad B., Pirmoradian Najafabadi M., Folkersen L., Malarstig A., Lagergren J., Eriksson P., Hamsten A., Odeberg J. (2012) Combined chromatin and expression analysis reveals specific regulatory mechanisms within cytokine genes in the macrophage early immune response. PLoS One 7, e32306. [DOI] [PMC free article] [PubMed] [Google Scholar]
- 55.Ghisletti S., Barozzi I., Mietton F., Polletti S., De Santa F., Venturini E., Gregory L., Lonie L., Chew A., Wei C. L., Ragoussis J., Natoli G. (2010) Identification and characterization of enhancers controlling the inflammatory gene expression program in macrophages. Immunity 32, 317–328. [DOI] [PubMed] [Google Scholar]
- 56.Stolovitzky G. A., Kundaje A., Held G. A., Duggar K. H., Haudenschild C. D., Zhou D., Vasicek T. J., Smith K. D., Aderem A., Roach J. C. (2005) Statistical analysis of MPSS measurements: application to the study of LPS-activated macrophage gene expression. Proc. Natl. Acad. Sci. USA 102, 1402–1407. [DOI] [PMC free article] [PubMed] [Google Scholar]
- 57.Gao J. J., Diesl V., Wittmann T., Morrison D. C., Ryan J. L., Vogel S. N., Follettie M. T. (2002) Regulation of gene expression in mouse macrophages stimulated with bacterial CpG-DNA and lipopolysaccharide. J. Leukoc. Biol. 72, 1234–1245. [PubMed] [Google Scholar]
- 58.Edwards J. P., Zhang X., Frauwirth K. A., Mosser D. M. (2006) Biochemical and functional characterization of three activated macrophage populations. J. Leukoc. Biol. 80, 1298–1307. [DOI] [PMC free article] [PubMed] [Google Scholar]
- 59.Fang F. C. (2004) Antimicrobial reactive oxygen and nitrogen species: concepts and controversies. Nat. Rev. Microbiol. 2, 820–832. [DOI] [PubMed] [Google Scholar]
- 60.Lloyd-Jones K. L., Kelly M. M., Kubes P. (2008) Varying importance of soluble and membrane CD14 in endothelial detection of lipopolysaccharide. J. Immunol. 181, 1446–1453. [DOI] [PubMed] [Google Scholar]
- 61.O'Neill L. A., Bowie A. G. (2007) The family of five: TIR-domain-containing adaptors in Toll-like receptor signalling. Nat. Rev. Immunol. 7, 353–364. [DOI] [PubMed] [Google Scholar]
- 62.Didierlaurent A., Brissoni B., Velin D., Aebi N., Tardivel A., Kaslin E., Sirard J. C., Angelov G., Tschopp J., Burns K. (2006) Tollip regulates proinflammatory responses to interleukin-1 and lipopolysaccharide. Mol. Cell. Biol. 26, 735–742. [DOI] [PMC free article] [PubMed] [Google Scholar]
- 63.Sun B., Rizzo L. V., Sun S. H., Chan C. C., Wiggert B., Wilder R. L., Caspi R. R. (1997) Genetic susceptibility to experimental autoimmune uveitis involves more than a predisposition to generate a T helper-1-like or a T helper-2-like response. J. Immunol. 159, 1004–1011. [PubMed] [Google Scholar]
- 64.Gueders M. M., Paulissen G., Crahay C., Quesada-Calvo F., Hacha J., Van Hove C., Tournoy K., Louis R., Foidart J. M., Noel A., Cataldo D. D. (2009) Mouse models of asthma: a comparison between C57BL/6 and BALB/c strains regarding bronchial responsiveness, inflammation, and cytokine production. Inflamm. Res. 58, 845–854. [DOI] [PubMed] [Google Scholar]
- 65.Wynn T. A. (2004) Fibrotic disease and the T(H)1/T(H)2 paradigm. Nat. Rev. Immunol. 4, 583–594. [DOI] [PMC free article] [PubMed] [Google Scholar]
- 66.DeMaeyer E., DeMaeyer-Guignard J., Bailey D. W. (1975) Effect of mouse genotype on interferon production. I. Lines congenic at the If-1 locus. Immunogenetics 1, 438–443. [Google Scholar]
- 67.Banchereau J., Pascual V. (2006) Type I interferon in systemic lupus erythematosus and other autoimmune diseases. Immunity 25, 383–392. [DOI] [PubMed] [Google Scholar]
- 68.Bennett L., Palucka A. K., Arce E., Cantrell V., Borvak J., Banchereau J., Pascual V. (2003) Interferon and granulopoiesis signatures in systemic lupus erythematosus blood. J. Exp. Med. 197, 711–723. [DOI] [PMC free article] [PubMed] [Google Scholar]
- 69.Hume D. A. (2008) Macrophages as APC and the dendritic cell myth. J. Immunol. 181, 5829–5835. [DOI] [PubMed] [Google Scholar]
- 70.Der S. D., Zhou A., Williams B. R., Silverman R. H. (1998) Identification of genes differentially regulated by interferon α, β, or γ using oligonucleotide arrays. Proc. Natl. Acad. Sci. USA 95, 15623–15628. [DOI] [PMC free article] [PubMed] [Google Scholar]
- 71.Indraccolo S., Pfeffer U., Minuzzo S., Esposito G., Roni V., Mandruzzato S., Ferrari N., Anfosso L., Dell'Eva R., Noonan D. M., Chieco-Bianchi L., Albini A., Amadori A. (2007) Identification of genes selectively regulated by IFNs in endothelial cells. J. Immunol. 178, 1122–1135. [DOI] [PubMed] [Google Scholar]
- 72.Waddell S. J., Popper S. J., Rubins K. H., Griffiths M. J., Brown P. O., Levin M., Relman D. A. (2010) Dissecting interferon-induced transcriptional programs in human peripheral blood cells. PLoS One 5, e9753. [DOI] [PMC free article] [PubMed] [Google Scholar]
- 73.Zhang S., Kim C. C., Batra S., McKerrow J. H., Loke P. (2010) Delineation of diverse macrophage activation programs in response to intracellular parasites and cytokines. PLoS Negl. Trop. Dis. 4, e648. [DOI] [PMC free article] [PubMed] [Google Scholar]
- 74.Negishi H., Ohba Y., Yanai H., Takaoka A., Honma K., Yui K., Matsuyama T., Taniguchi T., Honda K. (2005) Negative regulation of Toll-like-receptor signaling by IRF-4. Proc. Natl. Acad. Sci. USA 102, 15989–15994. [DOI] [PMC free article] [PubMed] [Google Scholar]
- 75.Salojin K. V., Owusu I. B., Millerchip K. A., Potter M., Platt K. A., Oravecz T. (2006) Essential role of MAPK phosphatase-1 in the negative control of innate immune responses. J. Immunol. 176, 1899–1907. [DOI] [PubMed] [Google Scholar]
- 76.Liu G., Friggeri A., Yang Y., Park Y. J., Tsuruta Y., Abraham E. (2009) miR-147, a microRNA that is induced upon Toll-like receptor stimulation, regulates murine macrophage inflammatory responses. Proc. Natl. Acad. Sci. USA 106, 15819–15824. [DOI] [PMC free article] [PubMed] [Google Scholar]
- 77.Becker S., Devlin R. B., Haskill J. S. (1989) Differential production of tumor necrosis factor, macrophage colony stimulating factor, and interleukin 1 by human alveolar macrophages. J. Leukoc. Biol. 45, 353–361. [PubMed] [Google Scholar]
- 78.Liang J., Song W., Tromp G., Kolattukudy P. E., Fu M. (2008) Genome-wide survey and expression profiling of CCCH-zinc finger family reveals a functional module in macrophage activation. PLoS One 3, e2880. [DOI] [PMC free article] [PubMed] [Google Scholar]
- 79.Mantovani A., Sica A., Sozzani S., Allavena P., Vecchi A., Locati M. (2004) The chemokine system in diverse forms of macrophage activation and polarization. Trends Immunol. 25, 677–686. [DOI] [PubMed] [Google Scholar]
- 80.Krausgruber T., Blazek K., Smallie T., Alzabin S., Lockstone H., Sahgal N., Hussell T., Feldmann M., Udalova I. A. (2011) IRF5 promotes inflammatory macrophage polarization and TH1-TH17 responses. Nat. Immunol. 12, 231–238. [DOI] [PubMed] [Google Scholar]
- 81.Lombardo E., Alvarez-Barrientos A., Maroto B., Bosca L., Knaus U. G. (2007) TLR4-mediated survival of macrophages is MyD88 dependent and requires TNF-α autocrine signalling. J. Immunol. 178, 3731–3739. [DOI] [PubMed] [Google Scholar]
- 82.Gordon S. (2003) Alternative activation of macrophages. Nat. Rev. Immunol. 3, 23–35. [DOI] [PubMed] [Google Scholar]
- 83.Mosser D. M., Edwards J. P. (2008) Exploring the full spectrum of macrophage activation. Nat. Rev. Immunol. 8, 958–969. [DOI] [PMC free article] [PubMed] [Google Scholar]
- 84.Keane T. M., Goodstadt L., Danecek P., White M. A., Wong K., Yalcin B., Heger A., Agam A., Slater G., Goodson M., et al. (2011) Mouse genomic variation and its effect on phenotypes and gene regulation. Nature 477, 289–294. [DOI] [PMC free article] [PubMed] [Google Scholar]
Associated Data
This section collects any data citations, data availability statements, or supplementary materials included in this article.