

Highlight
Transgenically imposed high glutathione, uncoupled from cellular controls, causes an oxidative shift in cytosolic redox potential, activates tobacco MAPKs, and primes immune responses to adapted and non-adapted Pseudomonas syringae pathogens.
Key words: Glutathione, hypersensitive response, priming, Pseudomonas syringae, redox state, salicylic acid, SIPK/WIPK.
Abstract
The role of the redox-active tripeptide glutathione in plant defence against pathogens has been studied extensively; however, the impact of changes in cellular glutathione redox potential on signalling processes during defence reactions has remained elusive. This study explored the impact of elevated glutathione content on the cytosolic redox potential and on early defence signalling at the level of mitogen-activated protein kinases (MAPKs), as well as on subsequent defence reactions, including changes in salicylic acid (SA) content, pathogenesis-related gene expression, callose depositions, and the hypersensitive response. Wild-type (WT) Nicotiana tabacum L. and transgenic high-glutathione lines (HGL) were transformed with the cytosol-targeted sensor GRX1-roGFP2 to monitor the cytosolic redox state. Surprisingly, HGLs displayed an oxidative shift in their cytosolic redox potential and an activation of the tobacco MAPKs wound-induced protein kinase (WIPK) and SA-induced protein kinase (SIPK). This activation occurred in the absence of any change in free SA content, but was accompanied by constitutively increased expression of several defence genes. Similarly, rapid activation of MAPKs could be induced in WT tobacco by exposure to either reduced or oxidized glutathione. When HGL plants were challenged with adapted or non-adapted Pseudomonas syringae pathovars, the cytosolic redox shift was further amplified and the defence response was markedly increased, showing a priming effect for SA and callose; however, the initial and transient hyperactivation of MAPK signalling was attenuated in HGLs. The results suggest that, in tobacco, MAPK and SA signalling may operate independently, both possibly being modulated by the glutathione redox potential. Possible mechanisms for redox-mediated MAPK activation are discussed.
Introduction
In higher plants, the first line of defence against pathogens is triggered by pathogen/microbe-associated molecular patterns (P/MAMPs), causing activation of pattern-triggered immunity (PTI). In the course of evolution, micro-organisms have evolved effector proteins to cope with PTI. If suppression of defence barriers by microbe effectors has been successful, pathogens will cause disease, classifying them as adapted pathogens for a given host plant. In response, plants have evolved effector-triggered immunity as a second line of defence, which is highly pathogen or pathovar specific and is mediated by recognition of pathogen effector(s) via specialized resistance proteins (Chisholm et al., 2006; Pieterse et al., 2009). Signalling triggered by immunity receptors is mediated by reactive oxygen species (ROS) and mitogen-activated protein kinases (MAPKs), resulting in transcriptional reprograming, activation of defence proteins and metabolites, cell-wall reinforcement, and programmed cell death (Boller and Felix, 2009). Besides mounting an all-out defence against infection, plants are also able to acquire a primed state that enables them to respond to biotic or abiotic stress faster and more efficiently (Conrath, 2011).
Previous studies have explored the role of the tripeptide glutathione in plant immunity, motivated by its multiple functions as an intracellular redox buffer (Mou et al., 2003), as a substrate for glutathionylation of target proteins (Zaffagnini et al., 2012), and because of its involvement in the biosynthesis of sulfur-containing plant defence compounds (Geu-Flores et al., 2011; Su et al., 2011). Lowering the overall cellular glutathione content has a profound effect on plant defence against pathogens. Thus, glutathione-deficient Arabidopsis thaliana mutants showed increased susceptibility to several pathogens: the pad2 mutant displayed an increased susceptibility to the bacterium Pseudomonas syringae, to the oomycete Phytophtora brassicae (Parisy et al., 2007; Dubreuil-Maurizi et al., 2011), and to the fungus Alternaria brassicicola (van Wees et al., 2003). Furthermore, the mutants cad2 and rax1 showed increased susceptibility to an avirulent P. syringae strain, concomitant with decreased transcript levels for genes involved in plant resistance to pathogens (Ball et al., 2004). All three mutants are defective in γ-glutamylcysteine ligase (GCL), the key enzyme for glutathione biosynthesis (Hothorn et al., 2006). While an impairment of defence against pathogens was consistently observed, the underlying molecular mechanism(s) are of complex nature, as in the Brassicaceae glutathione is—besides its role as a redox buffer—involved in the biosynthesis of glucosinolates and the phytoalexin camalexin (Roetschi et al., 2001; Schlaeppi et al., 2008).
The cellular redox state was also shown to be of crucial importance for the salicylic acid (SA)–NON-EXPRESSOR OF PR GENES 1 (NPR1) signalling pathway. In the cytosol, NPR1 protein monomers are released from large disulphide bridge-linked complexes and are subsequently translocated to the nucleus, where they associate with transcription factors to activate defence genes (Mou et al., 2003). The release of NPR1 monomers required thioredoxins, whereas S-nitrosoglutathione facilitated NPR1 oligomerization (Tada et al., 2008). Recently, Han et al. (2013) demonstrated that, upon transfer from a high-CO2 environment (blockage of photorespiration) to ambient air, the catalase-deficient Arabidopsis mutant cat2 displayed a 2-fold increase in total glutathione content, with its glutathione pool being more than 50% oxidized. This shift in glutathione oxidation state was accompanied by a strong increase in free SA and its glucoside SAG (Chaouch et al., 2010), concomitant with restricted propagation of the virulent pathogen P. syringae DC3000 during the early infection stage (Han et al., 2013). Conversely, in an Arabidopsis mutant for cytosolic glutathione reductase (gr1), which also displayed an increased oxidation state of its glutathione pool (although less pronounced than in the cat2 mutant; Mhamdi et al., 2010), total glutathione content was not significantly increased (Marty et al., 2009), and SA content was rather decreased compared with that of the wild type (WT). These observations suggested that both total glutathione content and degree of oxidation may impinge on SA accumulation.
Besides SA-induced NPR1-dependent signalling, MAPKs can also induce defence gene expression in a SA/NPR1-independent manner (Tsuda et al., 2013). While the role of ROS and redox change appear to be important for the P/MAMP-mediated activation of the MAPK cascade (Liu et al., 2007; Xu et al., 2014b), the molecular mechanism(s) that trigger MAPK signalling may depend on host species and elicitor type (Segonzac et al., 2011; Xu et al., 2014a). Hints for a possible direct redox regulation of MAPKs come from mammalian studies including redox-sensitive cysteine of MAPKs and MAPK phosphatase (Kim et al., 2012; Bassi et al., 2014).
Based on these results and the previously reported increase of glutathione during pathogen attack under physiological conditions (Vanacker et al., 2000; Parisy et al., 2007), the present study addressed the following questions: (i) To what extent does an increased glutathione content (induced transgenically or pharmacologically) affect the cytosolic redox state? (ii) Does an increase in glutathione content and/or change in redox state also impact on MAPK signalling, SA accumulation, and pathogenesis-related (PR) gene induction in the absence of pathogen challenge? (iii) Which defence responses are targeted by glutathione upon P. syringae infection?
To answer these questions, the cytosolic glutathione redox state was monitored with a redox sensor (GRX1-roGFP2) in a genetic background of WT and transgenic lines, expressing the bifunctional glutathione biosynthetic enzyme from Streptococcus thermophilus (StGCL-GS combines the activities of γ-glutamylcysteine ligase and glutathione synthetase; Liedschulte et al., 2010). The results obtained from this transgenic approach with high-glutathione lines (HGLs)—and further corroborated by pulse feeding of reduced glutathione (GSH) or the oxidized form (GSSG) to leaves of WT tobacco—demonstrated a direct effect of the cytosolic glutathione redox state on the activation state of the MAPKs wound-induced protein kinase (WIPK) and SA-induced protein kinase (SIPK), while possible mechanisms for a post-translational redox modulation of the MAPK cascade are discussed. Furthermore, HGLs displayed improved defence against adapted and non-adapted strains of P. syringae at the level of SA accumulation, PR gene expression, callose deposition, and the hypersensitive response (HR).
Materials and methods
Plant material, growth conditions, and generation of transgenic lines
Seeds of WT (Nicotiana tabacum Samsun NN) and transgenic lines expressing the bacterial bifunctional enzyme (StGCL-GS) under the control of the constitutive cauliflower mosaic virus 35S promoter (Liedschulte et al., 2010) were sterilized and placed on MS agar for germination. Transgenesis was confirmed by selection on kanamycin. After selection, plants were transferred to soil and grown in the greenhouse for 6 weeks under long-day conditions (16h light per day, temperature 24±2 °C). For stable expression of reduction-oxidation sensitive green fluorescent protein (roGFP2), the cassette of GRX1:roGFP2 plus ubiquitin promoter (present in the pBinAR vector; kindly provided by A. Meyer, Bonn, Germany) was amplified with primers cytRoGFP_F and cytRoGFP_R (listed in Supplementary Table S1 at JXB online) and inserted into plasmid vector pSS02 to allow selection for hygromycin resistance. Subsequently, this construct was mobilized into Agrobacterium tumefaciens strain C58C1 and used for stable transformation of tobacco leaf discs (Gallois and Marinho, 1995) in a WT background and four different StGCL-GS lines with five to six individual plants per line that displayed different degrees of glutathione accumulation.
Bacterial growth and infection protocol
For infection experiments, P. syringae strains were grown in Luria–Bertani broth overnight, washed, and resuspended in 10mM MgCl2 to an optical density (OD600) of 0.5, corresponding to approximately 5×10⁸ colony-forming units (CFU) ml–1. Aliquots of appropriate bacterial dilution (50 µl) were infiltrated into tobacco leaves using a 10ml syringe without needle applied to the abaxial side of the leaf (Thilmony et al., 1995). To monitor bacterial propagation in the leaf, two leaf discs were excised (diameter 1cm2) from each plant and macerated in 1ml of 10mM MgCl2 (Katagiri et al., 2002). Bacterial number was counted after plating appropriate serial dilutions on Luria–Bertani agar plates supplemented with 100mg l–1 of rifampicin or ampicillin. Mock treatment included the same treatment with 10mM MgCl2. Plant pathogenic bacteria including P. syringae pv. tabaci ATCC 11527 (Pst), P. syringae pv. maculicola ATCC 33190 (Psm) and P. syringae pv. syringae ATCC 19310 (Pss) were purchased from the German Collection of Microorganisms and Cell Cultures (DMSZ, Braunschweig, Germany). P. syringae pv. tabaci ATCC 11528 was obtained from the Sainsbury Laboratory, UK.
Glutathione measurement
Thiols were extracted from 30mg of plant tissue in the presence of dithiothreitol (DTT; for total glutathione) or N-ethylmaleimide (NEM; for oxidized glutathione) and derivatized with monobromobimane (Sigma) as described previously (Fey et al., 2005). Glutathione was measured by reverse-phase high-performance liquid chromatography (HPLC) according to Liedschulte et al. (2010). GSH was determined by subtracting GSSG from total glutathione.
In vivo imaging of the cellular redox state by confocal laser-scanning microscopy and ratiometric analysis
Images of epidermal cells from plants stably transformed with the GRX-roGFP2 sensor were taken with an LSM510META (Carl Zeiss MicroImaging, Germany), using 405 and 488nm excitation wavelengths as described by Schwarzlaender et al. (2008). Leaves were infiltrated with 100mM DTT or 50mM H2O2 for calibration of the probe. In preliminary experiments, it was confirmed that these concentrations were sufficient for full reduction or oxidation of the probe. To monitor the cellular redox state (with or without infection), leaf areas were mock infiltrated with sterile distilled water or bacterial suspension, and, subsequent microscopic analysis was done avoiding the area of syringe contact. Fluorescence ratio analysis, including the degree of oxidation and calculation of redox potential (Meyer et al., 2007), was carried out via the MatLab (The MathWorks, USA) analysis suite, kindly provided by A. Meyer (Bonn, Germany).
Immunoblot analysis of MAPKs and activation status of SIPK/WIPK
The amounts of activated MAPK proteins (SIPK and WIPK) were determined by immunoblot analysis with anti-pTEpY (anti-ERK1/2) antibody, purchased from Cell Signalling. Total SIPK protein was detected with anti-AtMPK6 antibody (Sigma) and total WIPK protein with anti-AtMPK3 antibody (Sigma). Total protein was extracted using the protocol of Segonzac et al. (2011). Different amounts of protein were loaded per lane depending on the experimental setup (see Results).
Determination of free and total SA
The method was adapted from DeFraia et al. (2008), using Acinetobacter sp. ADPWH _lux strain (Huang et al., 2005, 2006). In brief, 100mg of tissue was frozen in liquid nitrogen and thoroughly ground, and 250 µl of acetate buffer (0.1M, pH 5.6) was added. Samples were then mixed and centrifuged for 15min at 16 000g. Half of the supernatant was stored on ice for determination of free SA, whereas the other half was incubated at 37 °C for 2h with 10U of β-glucosidase (Sigma) for determination of total SA, consisting largely of free SA and its glucoside (SAG). Acinetobacter sp. ADPWH_lux strain was diluted to an OD600 of 0.35 and incubated with 20 µl of plant crude extract for 2h in a microtitre plate. Luminescence was detected on a plate reader (Fluostar Omega; BMG LabTech, Germany). Standards contained known concentrations of SA.
Determination of electrolyte leakage by conductivity measurement
The protocol was adapted from Torres et al. (2002). At 24h post-infection (hpi), 10 leaf discs (diameter 1cm) were collected from infected area, washed with double-distilled water, and placed in a tube with 20ml water. In mock treatments, plants were injected with 10mM MgCl2. Conductivity was measured with a conductivity meter (Schott, Germany) and expressed as µS cm–1.
Quantitative polymerase chain reaction analysis
Total RNA was extracted using a Gene Matrix Universal RNA Purification kit (EurX) and reverse transcribed with a SuperScript III First-Strand Synthesis System from Invitrogen. Quantitative polymerase chain reaction was performed using the following conditions: 95 °C for 6min, followed by 40 cycles of 95 °C 30 s, 60 °C 20 s, and 72 °C for 30 s. All primer sequences used in this study are listed in Supplementary Table S1. Ribosomal protein L25 was used as reference gene for the gene expression normalization using the ΔΔC t method. For independent confirmation of the results, ubiquitin and elongation factor 1α were used as additional reference genes.
Callose detection
For visualization of callose, leaf discs were cut from inoculated regions and incubated with ethanol:acetic acid solution (1:3, v/v) overnight to completely remove leaf pigments. After rehydration, the leaf discs were stained with 0.01% aniline blue in 150mM K2HPO4, pH 9 (Millet et al., 2010). Stained tissue was examined using ultraviolet epifluorescence (DAPI filter; Leika), avoiding areas close to wounds from inoculation or leaf sample excision. Callose deposits were counted per 1.5mm2 microscopy field, using ImageJ software.
Determination of H2O2
H2O2 was determined according to Wi et al. (2012), based on the oxidation of dichlorodihydrofluorescein diacetate (DCFH-DA; Sigma). In brief, after homogenization of tissue with 10mM Tris/HCl buffer (pH 7.2), the supernatant was incubated with DCFH-DA at room temperature for 10min in the dark. DCF fluorescence was detected using a plate reader (Fluostar Omega; BMG LabTech) at an excitation wavelength of 485nm and an emission wavelength of 525nm. Relative fluorescence was normalized to milligrams of protein. For 3,3’-diaminobenzidine staining, leaf discs were cut at 24 hpi and stained in 1mg ml–1 of 3,3’-diaminobenzidine for 6h. The leaf discs were then destained with 96 % ethanol and rehydrated in 50% glycerol. Samples were visualized by bright-field microscopy.
Statistical analysis
Student’s t-test was used to analyse statistically significant differences between transgenic lines and WT, and between different treatments. Significant differences were indicated for P≤0.05 and P≤0.01.
Results
Glutathione redox potential of HGLs reveals oxidized patches in the cytosol
HGLs with constitutive expression of a bacterial bifunctional enzyme for glutathione synthesis (StGCL-GS), covering a broad range of glutathione accumulation (i.e. from about 3- to more than 10-fold increase compared with WT) have been described previously by Liedschulte et al. (2010). For the present study, two types of HGLs were selected: lines with cytosolically localized bacterial enzyme (cyt) and lines with StGCL-GS targeted to the plastids (pls). Note that the HGLs used in this study displayed 2- to 5-fold higher glutathione content compared with WT, this increase being in the same range as reported for the pathogen-induced glutathione increase in several plant species (see Introduction).
To assess the cytosolic redox state in epidermal leaf cells, WT tobacco and four different HGLs were stably transformed with the cytosol-targeted redox sensor GRX1-roGFP2. This method allows monitoring of the glutathione redox potential in situ at high spatial resolution via ratiometric analysis using confocal imaging (Meyer et al., 2007; Schwarzlaender et al., 2008). It was first confirmed that the dynamic range of the sensor as determined by DTT and H2O2 treatments was similar in WT and HGLs (Supplementary Fig. S1A at JXB online). The degree of oxidation of the GRX1-roGFP2 probe (Supplementary Fig. S1B) was used to calculate the glutathione redox potential. When monitored in the absence of stress exposure, oxidized cytoplasmic patches in HGLs were detected, which were not observed in WT (Fig. 1A). These patches displayed dynamic changes in their redox poise, with glutathione redox potentials varying in range from –275 to –295 mV (Fig. 1B). The mean glutathione redox potential in HGLs was less reducing compared with WT (–306 mV), reaching on average –290 mV for cytroGFP lines and –287 mV for plsroGFP lines, respectively (Fig. 1C). Additionally, bulk analysis of glutathione from leaf extracts by HPLC revealed that the GSH:GSSG ratio was 20:1 in WT, while it dropped to 15:1 and 13:1 in the cytroGFP and plsroGFP lines, respectively (Fig. 1D). Glutathione reductase activities were increased up to 2-fold in HGLs compared with WT (Fig. 1E).
Fig. 1.

Analysis of cytosolic glutathione redox potential in epidermal cells of tobacco reveals a more oxidized state in HGLs compared with WT plants. (A) In situ measurements of glutathione redox potential, using cytosol-targeted GRX1-roGFP2 as sensor. The colour scale represents the fluorescence ratio with the redox state of roGFP ranging from fully reduced (red.) in blue to fully oxidized (ox.) in red. Calibration of the probe was performed with 100mM DTT and 50mM H2O2 for each sample. Bars, 10 µm. (B) Dynamic changes of glutathione redox potential for the points of analysis indicated by circles in (A). Each point was monitored for 270 s in 30 s time intervals. (C) Mean redox potentials of two independent lines of each pool (WT and HGL cyt and pls background with roGFP expression) calculated from ratio values for three individual plants of each line according to Meyer et al. (2007). (D) Mean contents of GSH and GSSG as determined by HPLC for plants as indicated in (C). (E) Glutathione reductase activities for WT and cyt and pls HGLs. Student’s t-test was used to calculate significant differences (*P<0.05, **P<0.01) between WT and HGLs. Error bar indicates standard deviation.
HGLs display increased levels of the activated MAPKs SIPK and WIPK
To explore whether MAPK signalling is affected in HGLs, the expression of three tobacco MAPKs (SIPK, WIPK, and Ntf6) was first analysed at the transcript level (Fig. 2A). While expression of SIPK and Ntf6 kinase was barely affected in HGLs, WIPK transcripts were increased 9-fold and 53-fold in lines pls16 and pls10, respectively. Since WIPK gene induction correlates with and might be dependent on SIPK activation (Liu et al., 2003), total protein amounts and activation states of both MAPKs were determined. When compared with WT, HGLs displayed increased levels of phosphorylated (i.e. active state) SIPK, and, albeit to a lesser extent, WIPK. Conversely, while accumulation of total WIPK protein was increased substantially in all HGLs, SIPK protein levels in WT and HGLs differed only slightly (Fig. 2B).
Fig. 2.

In leaves of tobacco HGLs, the MAPKs SIPK and WIPK are constitutively activated. (A) WIPK, SIPK, and Ntf6 transcript abundance in HGLs and WT. Numbers indicate fold induction in comparison with normalized expression for WT. Ribosomal protein L25 was used as a reference gene. Results represent the mean value of three biological replicates±standard error. Constitutive expression of ribosomal protein L25 was confirmed by comparison with two additional reference genes, namely ubiquitin and elongation factor 1α (see Supplementary Fig. S2 at JXB online). (B) Immunoblot analysis of phosphorylated forms of MAPKs using anti-pTEpY-ERK1/2 antibody for the active kinases WIPK and SIPK in HGLs compared with WT (upper panel). SIPK and WIPK total protein levels were also determined (middle and lower panel). Forty micrograms of total protein for the active form of SIPK/WIPK and 15 µg of total protein for SIPK and WIPK detection were loaded per lane. For the loading control, the membrane was stained with amido black. Experiments were repeated three times with similar results, and results are presented for individual plants of each line. Student’s t-test was used to calculate significant differences (*P<0.05, ** P<0.01) between WT and HGLs.
In WT, glutathione application causes an oxidative shift in cytosolic redox potential and induces rapid activation of SIPK and WIPK
To corroborate the assumption that the observed activation of SIPK and WIPK in HGLs is caused by the increase in cellular glutathione content and/or redox state, leaf discs of WT plants were treated with 10mM GSH or 1mM GSSG. Since GSH is not stable in aqueous solution (Yamamoto and Ishihara, 1994) and is expected to be further oxidized in the apoplast before uptake into the cytosol, treating leaf cells with GSH might, like GSSG, cause an oxidative shift of the cytosolic glutathione redox potential. To test this assumption, leaves of tobacco GRX1-roGFP2 transformants (in a WT background) were infiltrated with 10mM GSH or 1mM GSSG solution, and cytosolic glutathione redox potential was monitored over time. Indeed, both treatments caused shifts towards a more oxidized state (Fig. 3A).
Fig. 3.
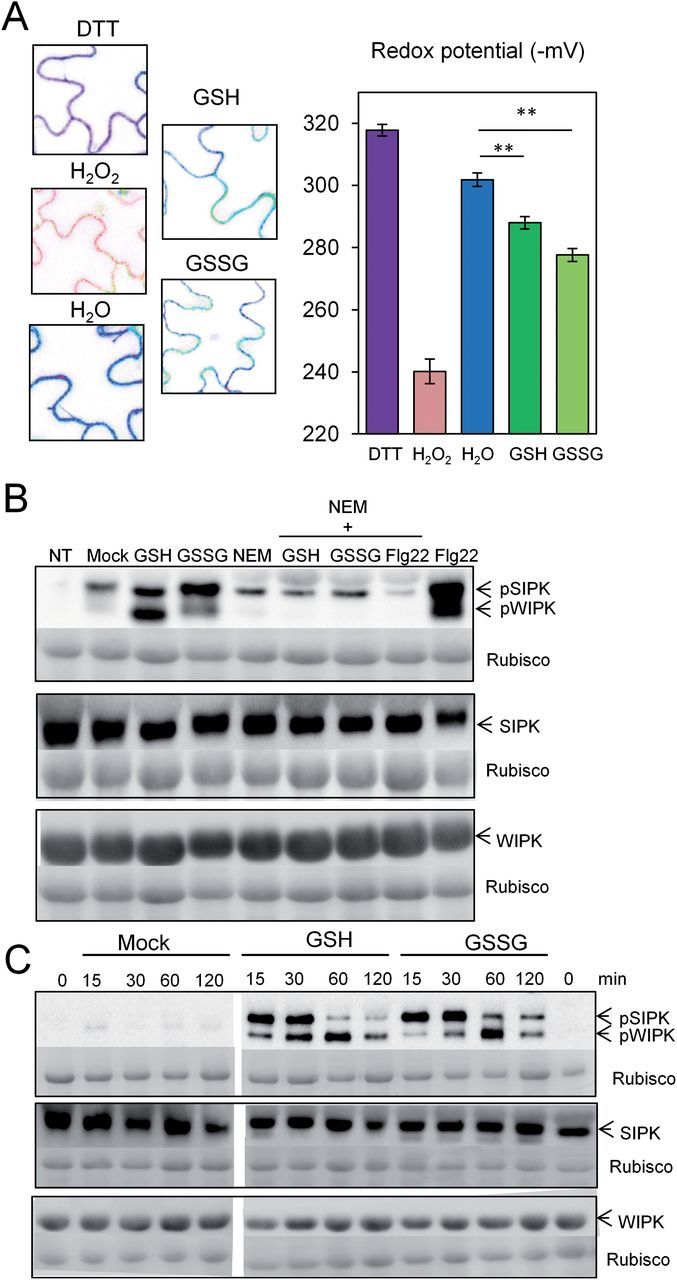
Infiltration of GSH (10mM) or GSSG (1mM) into leaves of WT tobacco causes significant oxidative shifts in cytosolic redox potential and rapidly activates SIPK and WIPK. (A) GSH and GSSG solutions were infiltrated with a needleless syringe from the abaxial leaf side. After 30min, redox potentials were determined with GRX1-roGFP2 as sensor in three independent samples (see also Fig. 1). Student’s t-test was used to calculate significant differences (**P<0.01) between treatments. (B) Treatment with GSH or GSSG for 30min activates MAPK signalling. Pre-incubation with 10mM N-ethylmaleimide (NEM) for 20min blocked SIPK and WIPK activation in response to GSH, GSSG, or 100nM Flg22 (flagellin N-terminal epitope). (C) Time course of SIPK and WIPK activation with GSH and GSSG over a 2h incubation period compared with mock treatment. Fifteen micrograms of total protein was loaded per lane. For loading control, the membrane was stained with amido black. Experiments were repeated twice with similar results.
A fast and strong activation of SIPK and WIPK was observed in response to reduced and oxidized glutathione, respectively, without a change in the total amounts of SIPK and WIPK proteins (Fig. 3B). Pre-treatment with NEM (preventing cysteine modifications, including disulfide bridge formation) blocked not only the activation of SIPK and WIPK by GSH, but also activation by GSSG. Likewise, NEM pre-treatment prevented the activation of both MAPKs by flagellin. A time course experiment revealed that the relative activation levels of SIPK and WIPK showed slightly different kinetics in response to GSH and GSSG. While, following GSSG treatment, SIPK activation was maintained somewhat longer compared with GSH treatment, the activation of WIPK appeared to be delayed (Fig. 3C).
Non-infected HGLs display a constitutive upregulation of defence gene expression without an increase in free SA
To assess the potential impact of MAPK signalling in HGLs as caused by the changed glutathione redox state on downstream defence signalling in the absence of pathogen challenge, an expression analysis was performed for selected genes considered to be specific for various defence-signalling pathways (van Loon, 1985). Expression of several PR protein genes was strongly (and constitutively) upregulated in HGLs when compared with WT (Fig. 4A). Upregulated genes included PR1, PR2, PR4, and PR5, known to be activated by SA in NPR1-dependent and -independent modes (Cao et al., 1994; Rao et al., 2002; Thibaud et al., 2004). Two established PTI marker genes for Nicotiana, namely CYP71D20 (Lacombe et al., 2010) and PTI5 (Nguyen et al., 2010), were also significantly induced in HGLs (Fig. 4B), whereas transcripts for PR10 and NPR1 remained unchanged (Fig. 4A). Since SA-mediated signalling is thought to be required for induction of PR genes in response to biotrophic or hemi-biotrophic pathogens such as P. syringae (Katagiri et al., 2002), the contents of free SA and total SA, including its glucoside form (SAG), were also determined. Interestingly, SA did not differ between HGLs and WT, consistent with unchanged (or even lowered) transcript amounts for isochorismate synthase (ICS1), an enzyme involved in SA biosynthesis. However, all HGLs had a significantly increased content of total SA, due to the presence of low amounts of the SA conjugate SAG, which was almost absent in WT (Fig. 4C).
Fig. 4.

In tobacco HGLs, steady-state transcript levels for PR protein genes and immunity marker genes are upregulated without an increase in free SA. (A) Transcript levels for PR protein genes and NPR1. (B) Transcript levels for immunity marker genes PTI5 and CYP71D20. (C) Transcript levels for ICS1 and contents of free SA and total SA in WT and HGLs. For gene expression analysis, numbers indicate fold induction in comparison with normalized expression in WT. Ribosomal protein L25 was used as a reference gene. Results represent mean values of three biological replicates±standard error. For SA measurements, results represent mean values of five biological replicates±standard deviation. Student’s t-test was employed to calculate significant differences (*P<0.05, **P<0.01) between WT and HGLs. Experiments were repeated three to five times with similar results.
Upon pathogen challenge, HGLs differ from WT at the level of glutathione redox potential, PR gene expression, and MAPK activation
Based on the abovementioned observations, it was expected that redox change, coupled with MAPK activation and defence gene induction, would impact significantly on plant defence. To substantiate this assumption, the cytosolic redox state in epidermal cells of WT and HGLs (cyt and pls) was monitored during bacterial infection with Psm and Pst, respectively. In tobacco, the non-adapted pathovar Psm causes a typical HR, whereas the adapted pathovar Pst causes severe disease symptoms (for further details, see below).
In WT, infection with Psm (5×10⁷ CFU ml–1) caused a significant increase of glutathione, with GSSG content being increased 5-fold at 6h hpi. An increase in GSSG could also be detected after challenge with the adapted pathovar Pst; however, here the effect was less pronounced (Fig. 5A). At 6 hpi, the glutathione redox potential of WT increased from –308 mV to about –275 mV in response to both pathogens. HGLs, which already displayed a slightly oxidized state (–282/–291 mV) in the absence of pathogen challenge (see above), revealed further oxidation reaching –263/–270 mV for Pst infection and –242/–254 mV for Psm infection. At 24 hpi, challenge with Pst led to further oxidation in WT and HGLs, but cells remained viable (Fig. 5B). The early strong oxidation after infection with the non-adapted pathovar Psm correlated with an accelerated cell death, and no more roGFP fluorescence was detectable at 24 hpi due to the advanced stage of HR (Supplementary Fig. S3 at JXB online).
Fig. 5.
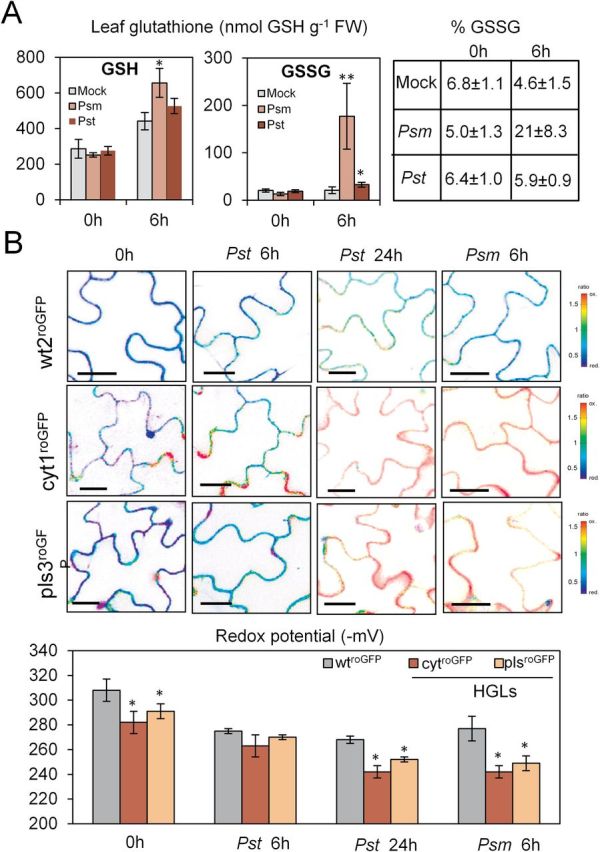
Response of cellular redox state of WT tobacco and HGLs to infection with adapted Pst or non-adapted Psm pathovars. (A) Accumulation of GSH and GSSG upon infection of WT with Psm and Pst. (B) GRX1-roGFP2-expressing plants (in WT or HGL background) were analysed immediately before (0h), 6h after Psm inoculation, and 6 and 24h after Pst inoculation. Mean redox potentials for the GSH/GSSG couple (mV) were calculated from three individual plants. For further details, see Fig. 1. Error bar indicates standard deviation. Bars, 10 µm. The pathogen inoculum was 5×10⁷ CFU ml–1. Student’s t-test was used to calculate significant differences (*P<0.05, **P<0.01) between WT and HGLs and different treatments.
In contrast to the constitutive activation of SIPK and WIPK in HGLs (Fig. 2), the further amplification of MAPK signalling upon challenge with flagellin, Psm, or Pst did not exceed the response of WT. After infection with the non-adapted pathovar Psm, HGLs even displayed an attenuated response (Fig. 6). While, in WT, activation of MAPK signalling was particularly strong with this pathovar, the adapted pathovar Pst induced less activation of both kinases, probably due to effector suppression via AvrPto (Xiang et al., 2008).
Fig. 6.

MAPK signalling in response to 100nM Flg22 treatment or pathogen challenge is more robust in WT than in HGLs. Time course of MAPK (SIPK and WIPK) activation in WTroGFP (A) and cytroGFP HGL (B) after elicitation with 100nM Flg22, or after infection with Psm or Pst. Fifteen micrograms of total protein was loaded per lane for detection of activated SIPK and WIPK. For the loading control, the membrane was stained with amido black.
To explore whether HGLs respond to infection with a further increase in defence gene expression, transcript amounts for PR protein genes were determined at 24 hpi with Pst (strain 11528) or Psm. HGLs displayed a substantial further induction of PR protein genes in response to both pathovars, the effect being even more pronounced for infection with Psm (Fig. 7A; for comparison with non-infected plants, see Fig. 4). Likewise, for WT, the induction of PR protein gene expression was stronger after challenge with the non-adapted pathovar (Psm) compared with the adapted pathovar Pst (Fig. 7B).
Fig. 7.

Upon pathogen challenge, PR protein genes show stronger expression in HGLs compared with WT. (A) Strong upregulation of four PR protein-coding genes at 24 hpi with non-adapted pathovar Psm. (B) Upregulation of the same PR protein-coding genes after infection with the adapted pathovar Pst. Bacterial titre infiltrated into the leaves was 5×10⁵ CFU ml–1. Numbers indicated gene induction relative to expression in WT in the absence of pathogen challenge. Ribosomal protein L25 was used as the reference gene. Results represent mean values of three biological replicates±standard error. Experiments were repeated two times with similar results.
HGLs are less susceptible to adapted and non-adapted pathovars of P. syringae
To explore whether the changed glutathione redox potential in HGLs was of physiological relevance for subsequent defence reactions, the response of transgenic lines to pathogen challenge was analysed at different levels. To monitor defence reactions, an infection procedure via leaf infiltration was employed (inoculum: 108–103 CFU ml–1). Disease symptoms were compared for two adapted Pst strains, and the non-adapted pathovars Psm and Pss. In WT tobacco, Pst causes tobacco wildfire disease, strain Pst ATCC 11528 being highly virulent (Thilmony et al., 1995), whereas Pst ATCC 11527 causes only slowly developing disease symptoms. Conversely, the non-adapted pathovars Psm and Pss are fought off by the tobacco host via a typical HR (Oh et al., 2006).
In WT plants, Pst ATCC 11528 at high titre caused necrosis of the entire infiltrated leaf area, surrounded by spreading chlorosis. In marked contrast, necrotic lesions appeared brighter in HGLs, resembling a HR, and chlorotic areas were spatially more restricted than in WT (Fig. 8A and Supplementary Fig. S4 at JXB online). This deviation from WT was most pronounced in HGL pls10, which displayed the highest accumulation of glutathione (Supplementary Fig. S6A at JXB online). For HGLs, bacterial growth was only transiently reduced when compared with WT: for strain Pst 11528 only at day 1 post-infection (Fig. 8B, lower pannel) and for the less virulent strain Pst 11527 until day 2 post-infection (Supplementary Fig. S5, upper panel).
Fig. 8.

Visible symptoms, time course of bacterial propagation, and HR response in WT and HGLs inoculated with the non-adapted pathovar Psm and the adapted pathovar Pst. (A) Infection symptoms after 7 d in WT tobacco and HGL pls10 in response to different inoculum of P. syringae pathovars (see top panel for infection pattern). Inoculum varied from 108 to 103 CFU ml–1 (for more HGLs, see Supplementary Figs S4 and S5 at JXB online).). (B) Time course of bacterial propagation in infected leaf areas, inoculated with Psm (5×10⁵ CFU ml–1, 50 µl) or Pst 11528 (104 CFU ml–1, 50 µl). Results represent mean values of four biological replicates ± standard deviation. (C) Time course of electrolyte leakage, marker for cell death in HR, monitored as increase in conductivity after infection with 5x 10⁵ CFU ml–1 of the non-adapted Psm or the adapted pathovar Pst. Results represent mean values of three biological replicates ± standard deviation. Student’s t-test was employed to calculate significant difference between WT and HGLs (significant differences marked with asterisks * P<0.05, ** P<0.01). Experiments were repeated twice with similar results.
Upon infection with the non-adapted pathovars Psm and Pss (inoculum: 108 and 107 CFU ml–1, respectively), WT and HGLs all developed lesions of the HR (Fig. 8A and Supplementary Fig. S4); however, HR symptoms were more pronounced in HGLs pls10 and cyt13. Remarkably, bacterial growth remained significantly reduced in all HGLs over the entire 7 d infection period (Fig. 8B, upper panel, and Supplementary Fig. S5, lower panel), indicating a sustained response of HGLs towards bacterial challenge.
Visual inspection of symptom development after infection with Psm revealed that HR lesions occurred faster and were more prominent in HGLs compared with WT. Since HR causes cell death in tobacco (Mysore and Ryu, 2004), electrolyte leakage was monitored as a cell death marker. In HGLs infected with Psm, electrolyte leakage increased significantly at 48 hpi (Fig. 8C, left panel). Remarkably, HGLs also displayed increased electrolyte leakage upon infection with the adapted pathovar Pst; however, this increase was less pronounced. At 72 hpi, electrolyte leakage was 67 and 45% higher for cyt13 and pls10, respectively, compared with WT (Fig. 8C, right panel).
HGLs are primed for SA accumulation and callose deposition
After challenge with the non-adapted P. syringae pathovar, HGLs accumulated more SA and SAG than WT (Fig. 9A), correlating with the stronger HR reaction (Fig. 8A). To dissect the infection process for the adapted pathovar Pst in more detail, accumulation of SA and SAG and expression of ICS1 were monitored (Fig. 9B). In WT, ICS1 expression was strongly upregulated as early as 6 hpi but declined thereafter and remained at a lower level for the following 48h. This time course correlated with an increase in SA only during the first 24h, with no further change until 72 hpi. In marked contrast, in HGL pls10, the initial peak of ICS1 expression at 6 hpi was followed by a second activation at 48 hpi (Fig. 9B), this second activation correlating with a further increase in free SA at 72 hpi. Interestingly, this second phase of SA accumulation coincided temporally with the development of the HR-like symptoms (Fig. 8A) and electrolyte leakage (Fig. 8C). Note that, in comparison with WT, PR1 expression was higher in HGL pls10 during the entire course of infection (Fig. 9B): at 6 hpi, PR1 transcript amount in line pls10 was 2600-fold higher than in WT.
Fig. 9.
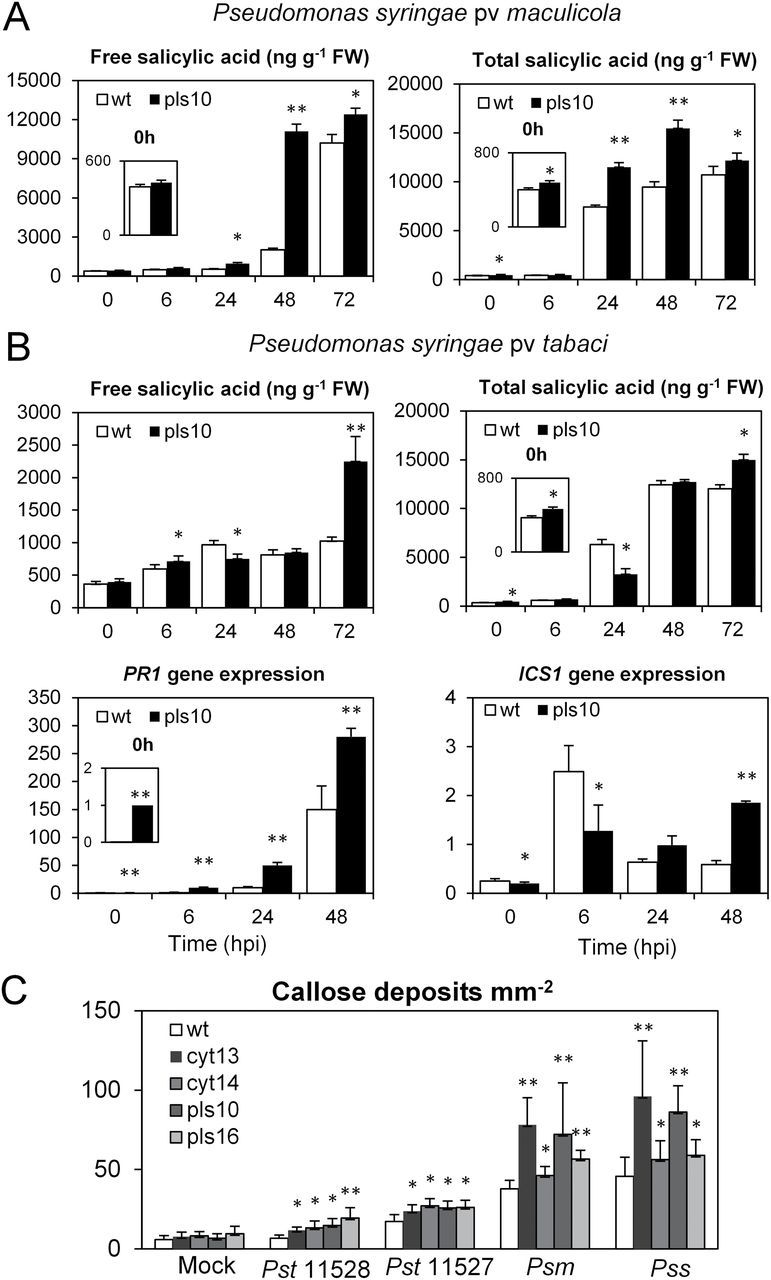
Upon pathogen challenge, HGLs display increased SA accumulation and callose deposition compared with WT. (A) Increase in accumulation of free and total SA after challenge with the non-adapted pathovar Psm in WT compared with HGL pls10. (B) After challenge with the adapted pathovar Pst, HGL pls10 accumulates increased amounts of SA at 72 hpi, temporally correlating with HR. Time courses for ICS1 (bottom panel right) and PR1 expression (bottom panel left) are included. For SA and SAG analysis, results represent mean values of three independent samples±standard deviation. Student’s t-test was employed to calculate significant difference (*P<0.05) between WT and HGL pls10. For gene expression analysis, numbers indicate fold induction in comparison with normalized expression in WT. Ribosomal protein L25 was used as the reference gene. Results represent mean values of three biological replicates±standard error. Experiments were repeated two times with similar results. (C) Callose deposits per mm2 in different HGLs and WT after infection with different P. syringae pathovars. The initial inoculum was 5×10⁵ CFU ml–1; for mock treatment, 10mM MgCl2 was applied. Results represent mean values of 10 independent samples for each line±standard deviation. *P<0.05 and **P<0.01 indicate the level of significance calculated with Student’s t-test.
The observed attenuation of disease symptoms in HGLs suggested that the high glutathione levels (Supplementary Fig. S6B) might also affect callose formation, thereby preventing bacterial spread. Indeed, at 24 hpi, increased callose deposition was observed in HGLs in response to challenge with adapted and non-adapted P. syringae pathovars (Fig. 9C). Particularly high levels of callose deposits were observed when plants were infected with the non-adapted pathovars Psm and Pss. Remarkably, the number of callose deposits in HGLs cyt13 and pls10 was almost doubled compared with WT. The lowest number of callose deposits was detected when plants were infected with the adapted pathovar Pst strain ATCC 11528, whereas during infection with Pst ATCC 11527, a less virulent strain, callose formation was slightly more induced than with ATCC 11528 (Fig. 9C). Note that, in the absence of infection, mock treatment did not cause callose deposition in HGLs, indicating that transgenic lines were primed for callose deposition.
Considering the importance of ROS accumulation and activation in immunity (Torres, 2010), we measured H2O2 accumulation before and after pathogen challenge in WT and HGLs. Remarkably, detection of H2O2 before and after infection did not reveal significant differences between HGLs and WT, except for the transient increase at 1 hpi, when H2O2 levels were slightly lower in HGLs compared with WT (Supplementary Fig. S7 at JXB online), possibly due to rapid quenching by glutathione.
Discussion
This study demonstrated that constitutively upregulated glutathione content as implemented in transgenic tobacco HGLs as well as short-term treatment of WT tobacco with glutathione caused an oxidative shift of the cytosolic glutathione redox potential and resulted in activated MAPK signalling via SIPK and WIPK. This activation indicates a possible redox-regulated mechanism. In HGLs, glutathione-activated MAPK signalling in the absence of pathogens was not accompanied by a change in free SA content but caused an increased expression of several PR genes. Furthermore, the observed oxidative shift in HGLs, combined with high glutathione levels, directly or indirectly improved plant defence upon challenge with adapted or non-adapted P. syringae pathovars. This upgrading of defence responses included further amplification of defence protein expression, callose deposition, SA accumulation, and a HR.
Tobacco HGLs, a tool for exploring the impact of glutathione-based redox signalling on immune response
Several strategies have aimed to increase cellular glutathione content in plants (Noctor et al., 1998; Creissen et al., 1999; Herschbach et al., 2010) in order to explore the impact of high glutathione on plant performance under stress. The introduction of StGCL-GS-expressing tobacco HGLs (Liedschulte et al., 2010) has offered a novel approach to address the effects of increased glutathione accumulation on defence operations in the absence of sulfur-based secondary metabolism (important in the Brassicaceae; see Introduction). Due to expression of the bifunctional StGCL-GS enzyme, glutathione biosynthesis is uncoupled from redox-mediated post-translational control (Liedschulte et al., 2010) and feedback inhibition by glutathione, regulatory processes that—in the absence of stress exposure—keep the endogenous GCL enzyme under tight control (Gromes et al., 2008). This imposed uncoupling of glutathione biosynthesis from its endogenous controls allows accumulation of cellular glutathione to substantially increased levels (Fig. 1 and Supplementary Fig. S6), levels normally observed only upon stress exposure, e.g. oxidative stress caused by ozone, paraquat treatment, or pathogen attack (Vanacker et al., 2000; Bick et al., 2001).
Cellular redox homeostasis in HGLs: evidence for an oxidative shift in the cytosol
Monitoring the glutathione redox potential of leaf epidermal cells from HGLs with the GRX1-roGFP2 cytosolic sensor (Meyer et al., 2007; Schwarzlaender et al., 2008) revealed that, in this cell type, the average glutathione redox potential was less negative compared with control lines. In addition, subcellular patches with an even higher oxidation state were repeatedly observed, pointing to cytosolic microenvironments of different redox potential. The results from quantitative bulk analysis of GSH and GSSG support a pronounced shift towards GSSG in the entire leaf (Fig. 1). Recently, Noctor et al. (2013) suggested that the disulfide form of glutathione may largely be sequestrated in the vacuole. The results presented here indicate that dynamic changes in the cytosolic GSH/GSSG ratio do also occur. While increased GR activities in HGLs reflect a cellular response to the oxidative shift, it remains to be shown whether cytosolic availability of NADPH may have been limiting. The observed redox shift may result from metabolic perturbations, e.g. interference with photorespiration induced by a glutathione synthesis-related decrease in cytosolic glycine levels (Noctor et al., 1998). Interestingly, in HGLs, the expression of the peroxisomal catalase isoform CAT1, corresponding to the CAT2 gene in Arabidopsis (Willekens et al., 1995), is 2-fold increased at the transcript level (data not shown).
While in tobacco HGLs a slightly oxidized cytosol correlated with an improved defence against adapted and non-adapted pathovars of P. syringae, an increase in glutathione redox potential in the glutathione-deficient pad2-1 mutant has been correlated with an impaired defence against pathogens (Dubreuil-Maurizi et al., 2011). This discrepancy may indicate that, in response to pathogen attack, both a shift towards oxidation and an increased glutathione content are required to be realized in tobacco HGLs, whereas in the pad2-1 mutant the low content of glutathione may have compromised cellular defence reactions.
Remarkably, comparable oxidative shifts in cytosolic glutathione redox potential were also observed after short-term treatment of WT tobacco leaf discs with either GSH or GSSG (Fig. 3). These transient shifts in cytosolic glutathione redox potential were of a similar magnitude compared with those observed in HGLs in the absence of pathogen challenge (Fig. 1). This may be explained by rapid oxidation of GSH in aqueous solution (Yamamoto and Ishihara, 1994) and bypassing the oxidizing environment of the apoplast before entering the cells.
In HGLs, the oxidative shift in the cytosol combined with elevated glutathione levels activates MAPK signalling
In the absence of pathogen attack, HGLs displayed an increased activation of SIPK and to a lesser extent of WIPK, accompanied by a significant increase in WIPK transcript and protein (Fig. 2). These constitutive changes in MAPK signalling resembled those observed in WT upon short-term treatment with GSH or GSSG (Fig. 3). The rapid activation of SIPK and WIPK in WT after glutathione treatment indicated redox-mediated regulation. Thus, the oxidative shift in cytosolic redox potential may have caused sulfenylation of cysteine residues in enzymes involved in MAPK signalling that can be glutathionylated with GSH or GSSG (Grek et al., 2013), as in WT leaf discs NEM pre-treatment almost completely prevented activation of both MAPKs. Whether the mechanism involved direct redox control of MAPKs, activation of upstream kinases, and/or inactivation of MAPK phosphatases remains to be shown. A recent study on the tobacco MAPK phosphatase NtMKP1 revealed that its suppression resulted in enhanced activation of WIPK and SIPK after wounding (Oka et al., 2013). While for mammals compelling evidence has been provided for redox-mediated inactivation of a MAPK phosphatase, involving a glutathionylation mechanism (Kim et al., 2012), activation of upstream kinases (MAPKK/K) and inactivation of MAPK phosphatases are not necessarily mutually exclusive. Heart p38α-MAPK, a serine-threonine kinase that is activated by its upstream activator MKK3, responds to multiple stresses including oxidants. In a recent study, it was shown that activation of p38α-MAPK is dependent on redox-sensing cysteines within p38α, namely Cys119 and Cys162, both close to the known MKK3 docking domain, which act as electron donors and form a disulfide bridge with MKK3 (Bassi et al., 2014).
Constitutive expression of PR genes in HGLs supports an SA-independent induction route
In the absence of pathogen challenge, HGLs displayed a substantial increase in the expression of several PR genes and two established markers for PTI in the absence of any change in free SA (Fig. 4). A plausible explanation for the lack of SA increase in HGLs in the absence of infection would be suppression of its accumulation by constitutively active SIPK. A negative impact of WIPK and SIPK on SA accumulation in tobacco has been suggested previously due to an increase in SA levels after silencing of those MAPKs (Seo et al., 2007).
In the absence of pathogen challenge, expression of NPR1 was barely affected in HGLs. Recently, Tsuda et al. (2013) reported that, in Arabidopsis, constitutive MPKK-mediated activation of MAPK3/6 was sufficient to activate most of the SA-responsive genes in a SA-independent manner. As this activation also occurred in the npr1 mutant, induction of defence genes via the MAPK cascade and the NPR1-mediated induction of SA-responsive genes are thought to represent separate signalling routes. The results obtained for tobacco corroborate this observation, in agreement with a SIPK-dependent/SA-independent activation of PR gene expression in the absence of infection.
Since the evidence for two separate routes (MAPK-dependent and SA-dependent) leading to activation of defence genes in HGLs is compelling, it can be assumed that changes in cellular glutathione content or glutathione redox potential will affect both signalling routes via different molecular mechanisms. Activation of NPR1 target genes is known to require NPR1 monomerization prior to entry into the nucleus, phosphorylation at the N-terminal phosphodegron, and subsequent proteasome-mediated turnover (Spoel et al., 2009). More recently, Lindermayr et al. (2010) reported that, in Arabidopsis, NPR1 and TGA1, both redox-controlled regulators of systemic acquired resistance, are subject to S-nitrosylation and S-glutathionylation at S-nitrosoglutathione concentrations in the low micromolar range. Also, it has been shown that conditional activation of SIPK may generate nitric oxide (Asai et al., 2008), and that NPR1 translocation to the nucleus is promoted by nitric oxide (Lindermayr et al., 2010). Thus, it may be speculated that, upon pathogen challenge, activation of MAPK(s) generates nitric oxide, which in the presence of a substantially increased GSH pool leads to S-nitrosoglutathione formation.
In HGLs, improved defence against adapted and non-adapted P. syringae pathovars correlates with amplified oxidative shift and SA accumulation
Positive correlation of increased levels of glutathione and SA has been related to abiotic stress tolerance in several Brassicaceae species (Freeman et al., 2005). Additionally, constitutive SA accumulation in the cpr and dnd1 mutants affected the glutathione pool size (Mateo et al., 2006). Recently, Han et al. (2013) demonstrated that when oxidative stress-induced glutathione accumulation is prevented in a cat2 cad2 double mutant, this resulted in decreased SA content and ICS1 transcript amounts, whereas the single cat2 mutant accumulated substantial levels of SA. Thus, while pronounced oxidative stress causes both induction of glutathione biosynthesis and accumulation of SA, stress-induced formation of glutathione appears to be required for SA accumulation.
Upon challenge with adapted and non-adapted P. syringae pathovars, HGLs mobilized their defences faster and stronger than WT plants. This was accompanied by augmented transcript increases for SA-dependent genes (Fig. 7), expeditious SA accumulation, and more callose depositions (Fig. 9), suggesting a strong SA-dependent defence response upon infection. On the other hand, the strong but transient activation of MAPK signalling observed in WT tobacco upon infection appeared to be attenuated in HGLs (Fig. 6).
In summary, the results indicate that glutathione accumulation per se does not necessarily induce SA accumulation, but that it does so in the presence of pronounced oxidative stress as occurring during pathogen attack. In which way the constitutive MAPK signalling and PR gene expression in HGLs in the absence of pathogens contribute to the improved defence upon pathogen attack remains to be shown. Apparently, a slightly oxidized cytosol, together with an increased total glutathione pool size, benefits faster activation of defence upon infection as shown in a proposed model (Fig. 10). This is in accordance with the recent report of Pastor et al. (2013) who suggested that an augmented defence response after treatment with priming inducer BABA in Arabidopsis thaliana might be associated with an oxidized state. It appears that in our system the primed state has been achieved simply by imposed glutathione production without the involvement of ROS, offering a redox environment suitable for faster activation of downstream reactions in defence.
Fig. 10.

Impact of imposed glutathione accumulation on redox homeostasis in the cytosol and P. syringae-related defence events: a model. In the absence of biotic stress, MAPK and SA signalling pathways are not induced (grey) in the WT plants (A), whereas in HGLs, glutathione accumulation causes an oxidative redox shift in the cytosol, correlating with MAPK activation and defence gene induction (black) without elevation in free SA (B). Upon infection, transient MAPK activation (early response) precedes SA accumulation and defence gene accumulation in WT (late response) (C). This response is amplified in HGLs, causing stronger oxidation of the cytosol compared with WT, and correlating with more prominent accumulation of free SA and PR gene expression (D).
Supplementary data
Supplementary data are available at JXB online.
Supplementary Fig. S1. Ratiometric analysis of WT and HGLs using GRX1-roGFP2 as sensor.
Supplementary Fig. S2. Steady-state transcript levels for additional reference genes ubiquitin and elongation factor 1α.
Supplementary Fig. S3. Raw data fluorescence images of roGFP2 in the cytosol of WT plants after different infiltration treatments.
Supplementary Fig. S4. Disease symptoms in tobacco leaves 7 d after infection with two strains of the adapted pathovar Pst strains ATCC 11528 and 11527 and two non-adapted pathovars (Psm and Pss) in WT compared with all four HGLs under study.
Supplementary Fig. S5. Time course of bacterial propagation in infected areas, inoculated with Pst strain 11527 and Pss.
Supplementary Fig. S6. Glutathione content in tobacco WT and transgenic HGLs.
Supplementary Fig. S7. Hydrogen peroxide detection after infection with the non-adapted pathovar Psm.
Supplementary Table S1. List of primers used in the experiments.
Acknowledgements
We would like to thank Kee Sohn from Sainsbury Laboratory, UK, for providing Pst ATCC 11528 and Wang Hui from Centre for Ecology and Hydrology, UK, for proving the Acinetobacter_lux strain. Special thank is given to Andreas Meyer, University of Bonn, Germany, for providing the roGFP constructs and the MatLab analysis suite. We thank Daniela Bausewein, Stefan Haberland, and Anna Speiser for valuable technical advice. Furthermore, many valuable discussions with Sebastian Wolf, Steffen Greiner, and Markus Wirtz are gratefully acknowledged. SM obtained a PhD scholarship from the Landesgraduiertenförderung (LGFG), State of Baden Württemberg. Support from DFG (SPP1710 Dynamics of Thiol-based Redox Switches in Cellular Physiology, Grant to TR) is gratefully acknowledged.
Glossary
Abbreviations:
- CFU
colony-forming units
- DCFH-DA
dichlorodihydrofluorescein diacetate
- DTT
dithiothreitol
- GSH
reduced glutathione
- GSSG
oxidized glutathione
- HGL
high-glutathione line
- hpi
h post-infection
- HPLC
high-performance liquid chromatography
- HR
hypersensitive response
- MAPK
mitogen-activated protein kinase
- NEM
N-ethylmaleimide
- P/MAMP,
pathogen/microbe-associated molecular patterns
- PR
pathogenesis-related
- Psm
Pseudomonas syringae pv. maculicola
- Pss
Pseudomonas syringae pv. syringae
- Pst
Pseudomonas syringae pv. tabaci
- PTI
pattern-triggered immunity
- ROS
reactive oxygen species
- SA
salicylic acid
- SAG
salicylic acid glucoside
- SIPK
SA-induced protein kinase
- WIPK
wound-induced protein kinase
- WT
wild type.
References
- Asai S, Ohta K, Yoshioka H. 2008. MAPK signaling regulates nitric oxide and NADPH oxidase-dependent oxidative bursts in Nicotiana benthamiana . Plant Cell 20, 1390–1406. [DOI] [PMC free article] [PubMed] [Google Scholar]
- Ball L, Accotto G-P, Bechtold U, et al. 2004. Evidence for a direct link between glutathione biosynthesis and stress defense gene expression in Arabidopsis. Plant Cell Online 16, 2448–2462. [DOI] [PMC free article] [PubMed] [Google Scholar]
- Bassi R, Rudyk O, Burgoyne J, Eaton P, Marber MS. 2014. Can redox-sensitive cysteines in P38A-MAPK modulate activation during stress? Heart 100 (Suppl. 1 ), A2.24445451 [Google Scholar]
- Bick JA, Setterdahl AT, Knaff DB, Chen Y, Pitcher LH, Zilinskas BA, Leustek T. 2001. Regulation of the plant-type 5’-adenylyl sulfate reductase by oxidative stress. Biochemistry 40, 9040–9048. [DOI] [PubMed] [Google Scholar]
- Boller T, Felix G. 2009. A renaissance of elicitors: perception of microbe-associated molecular patterns and danger signals by pattern-recognition receptors. Annual Review of Plant Biology 60, 379–406. [DOI] [PubMed] [Google Scholar]
- Cao H, Bowling SA, Gordon AS, Dong X. 1994. Characterization of an Arabidopsis mutant that is nonresponsive to inducers of systemic acquired resistance. Plant Cell 6, 1583–1592. [DOI] [PMC free article] [PubMed] [Google Scholar]
- Chaouch S, Queval G, Vanderauwera S, Mhamdi A, Vandorpe M, Langlois-Meurinne M, Van Breusegem F, Saindrenan P, Noctor G. 2010. Peroxisomal hydrogen peroxide is coupled to biotic defense responses by ISOCHORISMATE SYNTHASE1 in a daylength-related manner. Plant Physiology 153, 1692–1705. [DOI] [PMC free article] [PubMed] [Google Scholar]
- Chisholm ST, Coaker G, Day B, Staskawicz BJ. 2006. Host–microbe interactions: shaping the evolution of the plant immune response. Cell 124, 803–814. [DOI] [PubMed] [Google Scholar]
- Conrath U. 2011. Molecular aspects of defence priming. Trends in Plant Science 16, 524–531. [DOI] [PubMed] [Google Scholar]
- Creissen G, Firmin J, Fryer M, et al. 1999. Elevated glutathione biosynthetic capacity in the chloroplasts of transgenic tobacco plants paradoxically causes increased oxidative stress. Plant Cell 11, 1277–1292. [DOI] [PMC free article] [PubMed] [Google Scholar]
- DeFraia C, Schmelz E, Mou Z. 2008. A rapid biosensor-based method for quantification of free and glucose-conjugated salicylic acid. Plant Methods 4, 28. [DOI] [PMC free article] [PubMed] [Google Scholar]
- Dubreuil-Maurizi C, Vitecek J, Marty L, Branciard L, Frettinger P, Wendehenne D, Meyer AJ, Mauch F, Poinssot B. 2011. Glutathione deficiency of the Arabidopsis mutant pad2-1 affects oxidative stress-related events, defense gene expression, and the hypersensitive response. Plant Physiology 157, 2000–2012. [DOI] [PMC free article] [PubMed] [Google Scholar]
- Fey V, Wagner R, Brautigam K, Wirtz M, Hell R, Dietzmann A, Leister D, Oelmuller R, Pfannschmidt T. 2005. Retrograde plastid redox signals in the expression of nuclear genes for chloroplast proteins of Arabidopsis thaliana. Journal of Biological Chemistry 280, 5318–5328. [DOI] [PubMed] [Google Scholar]
- Freeman JL, Garcia D, Kim D, Hopf A, Salt DE. 2005. Constitutively elevated salicylic acid signals glutathione-mediated nickel tolerance in Thlaspi nickel hyperaccumulators. Plant Physiology 137, 1082–1091. [DOI] [PMC free article] [PubMed] [Google Scholar]
- Gallois P, Marinho P. 1995. Leaf disk transformation using Agrobacterium tumefaciens-expression of heterologous genes in tobacco. Methods in Molecular Biology 49, 39–48. [DOI] [PubMed] [Google Scholar]
- Geu-Flores F, Moldrup ME, Bottcher C, Olsen CE, Scheel D, Halkier BA. 2011. Cytosolic gamma-glutamyl peptidases process glutathione conjugates in the biosynthesis of glucosinolates and camalexin in Arabidopsis. Plant Cell 23, 2456–2469. [DOI] [PMC free article] [PubMed] [Google Scholar]
- Grek CL, Zhang J, Manevich Y, Townsend DM, Tew KD. 2013. Causes and consequences of cysteine S-glutathionylation. Journal of Biological Chemistry 288, 26497–26504. [DOI] [PMC free article] [PubMed] [Google Scholar]
- Gromes R, Hothorn M, Lenherr ED, Rybin V, Scheffzek K, Rausch T. 2008. The redox switch of γ-glutamylcysteine ligase via a reversible monomer–dimer transition is a mechanism unique to plants. The Plant Journal 54, 1063–1075. [DOI] [PubMed] [Google Scholar]
- Han Y, Chaouch S, Mhamdi A, Queval G, Zechmann B, Noctor G. 2013. Functional analysis of Arabidopsis mutants points to novel roles for glutathione in coupling H2O2 to activation of salicylic acid accumulation and signaling. Antioxidants and Redox Signaling 18, 2106–2121. [DOI] [PMC free article] [PubMed] [Google Scholar]
- Herschbach C, Rizzini L, Mult S, Hartmann T, Busch F, Peuke AD, Kopriva S, Ensminger I. 2010. Over-expression of bacterial γ-glutamylcysteine synthetase (GSH1) in plastids affects photosynthesis, growth and sulphur metabolism in poplar (Populus tremula×Populus alba) dependent on the resulting γ-glutamylcysteine and glutathione levels. Plant, Cell & Environment 33, 1138–1151. [DOI] [PubMed] [Google Scholar]
- Hothorn M, Wachter A, Gromes R, Stuwe T, Rausch T, Scheffzek K. 2006. Structural basis for the redox control of plant glutamate cysteine ligase. Journal of Biological Chemistry 281, 27557–27565. [DOI] [PubMed] [Google Scholar]
- Huang WE, Huang L, Preston GM, Naylor M, Carr JP, Li Y, Singer AC, Whiteley AS, Wang H. 2006. Quantitative in situ assay of salicylic acid in tobacco leaves using a genetically modified biosensor strain of Acinetobacter sp. ADP1. The Plant Journal 46, 1073–1083. [DOI] [PubMed] [Google Scholar]
- Huang WE, Wang H, Zheng H, Huang L, Singer AC, Thompson I, Whiteley AS. 2005. Chromosomally located gene fusions constructed in Acinetobacter sp. ADP1 for the detection of salicylate. Environmental Microbiology 7, 1339–1348. [DOI] [PubMed] [Google Scholar]
- Katagiri F, Thilmony R, He SY. 2002. The Arabidopsis thaliana-Pseudomonas syringae interaction. The Arabidopsis Book , e0039. [DOI] [PMC free article] [PubMed] [Google Scholar]
- Kim HS, Ullevig SL, Zamora D, Lee CF, Asmis R. 2012. Redox regulation of MAPK phosphatase 1 controls monocyte migration and macrophage recruitment. Proceedings of the National Academy of Sciences, USA 109, E2803–E2812. [DOI] [PMC free article] [PubMed] [Google Scholar]
- Lacombe S, Rougon-Cardoso A, Sherwood E, et al. 2010. Interfamily transfer of a plant pattern-recognition receptor confers broad-spectrum bacterial resistance. Nature Biotechnology 28, 365–369. [DOI] [PubMed] [Google Scholar]
- Liedschulte V, Wachter A, Zhigang A, Rausch T. 2010. Exploiting plants for glutathione (GSH) production: uncoupling GSH synthesis from cellular controls results in unprecedented GSH accumulation. Plant Biotechnology Journal 8, 807–820. [DOI] [PubMed] [Google Scholar]
- Lindermayr C, Sell S, Müller B, Leister D, Durner J. 2010. Redox regulation of the NPR1-TGA1 system of Arabidopsis thaliana by nitric oxide. Plant Cell Online 22, 2894–2907. [DOI] [PMC free article] [PubMed] [Google Scholar]
- Liu Y, Jin H, Yang KY, Kim CY, Baker B, Zhang S. 2003. Interaction between two mitogen-activated protein kinases during tobacco defense signaling. The Plant Journal 34, 149–160. [DOI] [PubMed] [Google Scholar]
- Liu Y, Ren D, Pike S, Pallardy S, Gassmann W, Zhang S. 2007. Chloroplast-generated reactive oxygen species are involved in hypersensitive response-like cell death mediated by a mitogen-activated protein kinase cascade. The Plant Journal 51, 941–954. [DOI] [PubMed] [Google Scholar]
- Marty L, Siala W, Schwarzlander M, Fricker MD, Wirtz M, Sweetlove LJ, Meyer Y, Meyer AJ, Reichheld JP, Hell R. 2009. The NADPH-dependent thioredoxin system constitutes a functional backup for cytosolic glutathione reductase in Arabidopsis. Proceedings of the National Academy of Sciences, USA 106, 9109–9114. [DOI] [PMC free article] [PubMed] [Google Scholar]
- Mateo A, Funck D, Mühlenbock P, Kular B, Mullineaux PM, Karpinski S. 2006. Controlled levels of salicylic acid are required for optimal photosynthesis and redox homeostasis. Journal of Experimental Botany 57, 1795–1807. [DOI] [PubMed] [Google Scholar]
- Meyer AJ, Brach T, Marty L, Kreye S, Rouhier N, Jacquot JP, Hell R. 2007. Redox-sensitive GFP in Arabidopsis thaliana is a quantitative biosensor for the redox potential of the cellular glutathione redox buffer. The Plant Journal 52, 973–986. [DOI] [PubMed] [Google Scholar]
- Mhamdi A, Hager J, Chaouch S, et al. 2010. Arabidopsis GLUTATHIONE REDUCTASE1 plays a crucial role in leaf responses to intracellular hydrogen peroxide and in ensuring appropriate gene expression through both salicylic acid and jasmonic acid signaling pathways. Plant Physiology 153, 1144–1160. [DOI] [PMC free article] [PubMed] [Google Scholar]
- Millet YA, Danna CH, Clay NK, Songnuan W, Simon MD, Werck-Reichhart D, Ausubel FM. 2010. Innate immune responses activated in Arabidopsis roots by microbe-associated molecular patterns. Plant Cell 22, 973–990. [DOI] [PMC free article] [PubMed] [Google Scholar]
- Mou Z, Fan W, Dong X. 2003. Inducers of plant systemic acquired resistance regulate NPR1 function through redox changes. Cell 113, 935–944. [DOI] [PubMed] [Google Scholar]
- Mysore KS, Ryu C-M. 2004. Nonhost resistance: how much do we know? Trends in Plant Science 9, 97–104. [DOI] [PubMed] [Google Scholar]
- Nguyen HP, Chakravarthy S, Velásquez AC, McLane HL, Zeng L, Nakayashiki H, Park D-H, Collmer A, Martin GB. 2010. Methods to study PAMP-triggered immunity using tomato and Nicotiana benthamiana . Molecular Plant–Microbe Interactions 23, 991–999. [DOI] [PubMed] [Google Scholar]
- Noctor G, Arisi AC, Jouanin L, Foyer CH. 1998. Manipulation of glutathione and amino acid biosynthesis in the chloroplast. Plant Physiology 118, 471–482. [DOI] [PMC free article] [PubMed] [Google Scholar]
- Noctor G, Mhamdi A, Queval G, Foyer CH. 2013. Regulating the redox gatekeeper: vacuolar sequestration puts glutathione disulfide in its place. Plant Physiology 163, 665–671. [DOI] [PMC free article] [PubMed] [Google Scholar]
- Oh S-K, Lee S, Chung E, Park J, Yu S, Ryu C-M, Choi D. 2006. Insight into Types I and II nonhost resistance using expression patterns of defense-related genes in tobacco. Planta 223, 1101–1107. [DOI] [PubMed] [Google Scholar]
- Oka K, Amano Y, Katou S, Seo S, Kawazu K, Mochizuki A, Kuchitsu K, Mitsuhara I. 2013. Tobacco MAP kinase phosphatase (NtMKP1) negatively regulates wound response and induced resistance against necrotrophic pathogens and lepidopteran herbivores. Molecular Plant–Microbe Interactions 26, 668–675. [DOI] [PubMed] [Google Scholar]
- Parisy V, Poinssot B, Owsianowski L, Buchala A, Glazebrook J, Mauch F. 2007. Identification of PAD2 as a γ-glutamylcysteine synthetase highlights the importance of glutathione in disease resistance of Arabidopsis. The Plant Journal 49, 159–172. [DOI] [PubMed] [Google Scholar]
- Pastor V, Luna E, Ton J, Cerezo M, Garcia-Agustin P, Flors V. 2013. Fine tuning of reactive oxygen species homeostasis regulates primed immune responses in Arabidopsis. Molecular Plant–Microbe Interactions 26, 1334–1344. [DOI] [PubMed] [Google Scholar]
- Pieterse CM, Leon-Reyes A, Van der Ent S, Van Wees SC. 2009. Networking by small-molecule hormones in plant immunity. Nature Chemical Biology 5, 308–316. [DOI] [PubMed] [Google Scholar]
- Rao MV, Lee HI, Davis KR. 2002. Ozone-induced ethylene production is dependent on salicylic acid, and both salicylic acid and ethylene act in concert to regulate ozone-induced cell death. Plant Journal 32, 447–456. [DOI] [PubMed] [Google Scholar]
- Roetschi A, Si-Ammour A, Belbahri L, Mauch F, Mauch-Mani B. 2001. Characterization of an Arabidopsis–Phytophthora pathosystem: resistance requires a functional PAD2 gene and is independent of salicylic acid, ethylene and jasmonic acid signalling. Plant Journal 28, 293–305. [DOI] [PubMed] [Google Scholar]
- Schlaeppi K, Bodenhausen N, Buchala A, Mauch F, Reymond P. 2008. The glutathione-deficient mutant pad2-1 accumulates lower amounts of glucosinolates and is more susceptible to the insect herbivore Spodoptera littoralis . The Plant Journal 55, 774–786. [DOI] [PubMed] [Google Scholar]
- Schwarzlaender M, Fricker MD, Mueller C, Marty L, Brach T, Novak J, Sweetlove LJ, Hell R, Meyer AJ. 2008. Confocal imaging of glutathione redox potential in living plant cells. Journal of Microscopy 231, 299–316. [DOI] [PubMed] [Google Scholar]
- Segonzac C, Feike D, Gimenez-Ibanez S, Hann DR, Zipfel C, Rathjen JP. 2011. Hierarchy and roles of pathogen-associated molecular pattern-induced responses in Nicotiana benthamiana . Plant Physiology 156, 687–699. [DOI] [PMC free article] [PubMed] [Google Scholar]
- Seo S, Katou S, Seto H, Gomi K, Ohashi Y. 2007. The mitogen-activated protein kinases WIPK and SIPK regulate the levels of jasmonic and salicylic acids in wounded tobacco plants. The Plant Journal 49, 899–909. [DOI] [PubMed] [Google Scholar]
- Spoel SH, Mou Z, Tada Y, Spivey NW, Genschik P, Dong X. 2009. Proteasome-mediated turnover of the transcription coactivator NPR1 plays dual roles in regulating plant immunity. Cell 137, 860–872. [DOI] [PMC free article] [PubMed] [Google Scholar]
- Su T, Xu J, Li Y, Lei L, Zhao L, Yang H, Feng J, Liu G, Ren D. 2011. Glutathione-indole-3-acetonitrile is required for camalexin biosynthesis in Arabidopsis thaliana . Plant Cell 23, 364–380. [DOI] [PMC free article] [PubMed] [Google Scholar]
- Tada Y, Spoel SH, Pajerowska-Mukhtar K, Mou Z, Song J, Wang C, Zuo J, Dong X. 2008. Plant immunity requires conformational charges of NPR1 via S-nitrosylation and thioredoxins. Science 321, 952–956. [DOI] [PMC free article] [PubMed] [Google Scholar]
- Thibaud MC, Gineste S, Nussaume L, Robaglia C. 2004. Sucrose increases pathogenesis-related PR-2 gene expression in Arabidopsis thaliana through an SA-dependent but NPR1-independent signaling pathway. Plant Physiology and Biochemistry 42, 81–88. [DOI] [PubMed] [Google Scholar]
- Thilmony RL, Chen Z, Bressan RA, Martin GB. 1995. Expression of the tomato Pto gene in tobacco enhances resistance to Pseudomonas syringae pv tabaci expressing avrPto . Plant Cell 7, 1529–1536. [DOI] [PMC free article] [PubMed] [Google Scholar]
- Torres MA, Dangl JL, Jones JD. 2002. Arabidopsis gp91phox homologues AtrbohD and AtrbohF are required for accumulation of reactive oxygen intermediates in the plant defense response. Proceedings of the National Academy of Sciences, USA 99, 517–522. [DOI] [PMC free article] [PubMed] [Google Scholar]
- Torres MA. 2010. ROS in biotic interactions. Physiologia Plantarum 138, 414–429. [DOI] [PubMed] [Google Scholar]
- Tsuda K, Mine A, Bethke G, Igarashi D, Botanga CJ, Tsuda Y, Glazebrook J, Sato M, Katagiri F. 2013. Dual regulation of gene expression mediated by extended MAPK activation and salicylic acid contributes to robust innate immunity in Arabidopsis thaliana . PLoS Genetics 9, e1004015. [DOI] [PMC free article] [PubMed] [Google Scholar]
- van Loon LC. 1985. Pathogenesis-related proteins. Plant Molecular Biology 4, 111–116. [DOI] [PubMed] [Google Scholar]
- van Wees SC, Chang HS, Zhu T, Glazebrook J. 2003. Characterization of the early response of Arabidopsis to Alternaria brassicicola infection using expression profiling. Plant Physiology 132, 606–617. [DOI] [PMC free article] [PubMed] [Google Scholar]
- Vanacker H, Carver TL, Foyer CH. 2000. Early H2O2 accumulation in mesophyll cells leads to induction of glutathione during the hyper-sensitive response in the barley–powdery mildew interaction. Plant Physiology 123, 1289–1300. [DOI] [PMC free article] [PubMed] [Google Scholar]
- Wi SJ, Ji NR, Park KY. 2012. Synergistic biosynthesis of biphasic ethylene and reactive oxygen species in response to hemibiotrophic Phytophthora parasitica in tobacco plants. Plant Physiology 159, 251–265. [DOI] [PMC free article] [PubMed] [Google Scholar]
- Willekens H, Inzé D, Van Montagu M, van Camp W. 1995. Catalases in plants. Molecular Breeding 1, 207–228. [Google Scholar]
- Xiang T, Zong N, Zou Y, et al. 2008. Pseudomonas syringae effector AvrPto blocks innate immunity by targeting receptor kinases. Current Biology 18, 74–80. [DOI] [PubMed] [Google Scholar]
- Xu J, Xie J, Yan C, Zou X, Ren D, Zhang S. 2014. a A chemical genetic approach demonstrates that MPK3/MPK6 activation and NADPH oxidase-mediated oxidative burst are two independent signaling events in plant immunity. Plant Journal 77, 222–234. [DOI] [PMC free article] [PubMed] [Google Scholar]
- Xu J, Yang KY, Yoo SJ, Liu Y, Ren D, Zhang S. 2014. b Reactive oxygen species in signalling the transcriptional activation of WIPK expression in tobacco. Plant Cell & Environment 37, 1614–1625. [DOI] [PubMed] [Google Scholar]
- Yamamoto T, Ishihara K. 1994. Stability of glutathione in solution. In: Yano T, Matsuno R, Nakamura K, eds. Developments in food engineering . USA: Springer, 209–211. [Google Scholar]
- Zaffagnini M, Bedhomme M, Lemaire SD, Trost P. 2012. The emerging roles of protein glutathionylation in chloroplasts. Plant Science 185–186, 86–96. [DOI] [PubMed] [Google Scholar]
Associated Data
This section collects any data citations, data availability statements, or supplementary materials included in this article.