

Abstract
Objective
Sarcopenic obesity (SO) is associated with poorer physical outcomes and functional status in the older adult. A proinflammatory milieu associated with central obesity is postulated to enhance muscle catabolism. We set out to examine associations of the chemokine monocyte chemoattractant protein-1 (MCP-1) in groups of older adults, with sarcopenia, obesity, and the SO phenotypes.
Methods
A total of 143 community dwelling, well, older adults were recruited. Cross-sectional clinical data, physical performance, and muscle mass measurements were collected. Obesity and sarcopenia were defined using revised National Cholesterol Education Program (NCEP) obesity guidelines and those of the Asian Working Group for Sarcopenia. Serum levels of MCP-1 were measured by enzyme-linked immunosorbent assay (ELISA).
Results
In all, 25.2% of subjects were normal, 15.4% sarcopenic, 48.3% obese, and 11.2% were SO. The SO groups had the lowest appendicular lean mass, highest percentage body fat, and lowest performance scores on the Short Physical Performance Battery and grip strength. The MCP-1 levels were significantly different, with the highest levels found in SO participants (P<0.05).
Conclusion
Significantly raised MCP-1 levels in obese and SO subjects support the theory of chronic inflammation due to excess adiposity. Longitudinal studies will reveal whether SO represents a continuum of obesity causing accelerated sarcopenia and cardiovascular events, or the coexistence of two separate conditions with synergistic effects affecting functional performance.
Keywords: chemokine C-C motif ligand 2 (CCL-2), elderly, sarcopenia
Background
Sarcopenia is defined as an age-related decline in skeletal muscle mass and muscle function (defined by muscle strength or physical performance), resulting in increased risk of adverse outcomes, such as falls, hospital admissions, and mortality.1 Obesity is associated with poor functional status, morbidity, and mortality across all ages. Previous study looking at older people with concurrent sarcopenia and obesity has shown that the two conditions may be pathophysiologically connected and that coexistence of the two conditions confers a worst outcome for physical functioning, with increased rate of functional decline.2
The association between obesity and sarcopenia is postulated to be due to the interplay of multiple factors of inflammation, insulin resistance, nutrition, and physical inactivity. Drawing parallels from the study of arthritis, increased proinflammatory cytokines without a negative energy balance state is associated with muscle loss and increased fat mass.3 Proinflammatory cytokines and leptin secreted by adipocytes and adipose tissue leukocytes exert a direct catabolic effect on muscle cells and also, act indirectly via insulin resistance, inhibiting the anabolic effect of insulin on muscle cells.4
Recent studies have looked at novel inflammatory biomarkers in obesity. In particular, the monocyte chemotactic protein-1 (MCP-1) gene was found to be significantly upregulated in mice models of genetic obesity and in diet-induced obese mice.5 MCP-1 belongs to the small inducible cytokines family and is involved in recruitment of monocytes to sites of injury, infection, and carcinogenesis.
MCP-1 upregulation is triggered by activation of pattern-recognition receptors (PRRs), such as toll-like receptors (TLRs) and nucleotide-binding oligomerization domain-like receptors (NLRs), which recognize pathogens or pathogen-associated molecular patterns (including damaged cell products).6 MCP-1 binds to its receptor, chemokine (C-C motif) receptor 2 (CCR-2), inducing endoplasmic reticulum (ER) stress. This in turn leads to the unfolded protein response (UPR), which subsequently aims to reestablish ER homeostasis, including inducing autophagy to recycle misfolded proteins. If ER stress remains unresolved, apoptosis then occurs. In breast carcinoma, MCP-1 is extensively expressed in breast tumor cells, and this recruits CCR2-expressing monocytes to primary tumors and metastatic sites. A mouse model of CCL2 neutralization showed that metastasis is inhibited due to retention of monocytes in the bone marrow.7 Anti-CCL2 treatment also reduced cancer cell motility and blood vessel leakiness in the tumor.
In obesity, upregulation of MCP-1 is associated with macrophage accumulation and activation in adipose tissues, and insulin resistance. MCP-1 expression is highest in the stromal vascular fraction of white adipose tissue, where macrophages are abundant. Some preadipocytes show moderate increased expression of MCP-1, as well, under the stimulation of TNF-α. In a separate study, MCP-1 levels measured in healthy Japanese subjects found significant associations of MCP-1 levels with age and triglyceride levels.8 To date, there has been no study examining MCP-1 levels in older adults with sarcopenic obesity (SO).
We thus set out to investigate the association of the novel markers of MCP-1 in the SO phenotype compared with the pure sarcopenia and obesity phenotypes.
Methods
Study population and groups
A total of 143 community-dwelling, cognitively intact, well, older adults were consecutively recruited. This was part of a larger longitudinal study (Longitudinal Assessment of Biomarkers for characterisation of early Sarcopenia and predicting frailty and functional decline in community-dwelling Asian older adults Study [GERILABS]). Obesity was defined with the revised National Cholesterol Education Program (NCEP)9-obesity definition of waist circumference (≥90 cm for Asian man and ≥80 cm for Asian women). Sarcopenia was defined using the Asian Working Group for Sarcopenia criteria.1 SO individuals fulfilled both sarcopenia and obesity criteria.
We excluded patients with preexisting inflammatory conditions and current use of immunosuppressants. Ethics approval was obtained from the Domain Specific Review Board of the National Healthcare Group, and written informed consent obtained from the study participant.
Data collection
Demographic and clinical data were obtained. Percentage body fat and lean mass measures were obtained via a dual-energy X-ray absorptiometry system (Discovery™ APEX 13.3; Hologic, Bedford, MA, USA). Appendicular skeletal mass was derived from the summation of muscle mass measurements in the four limbs.
Grip strength was measured using a hydraulic hand dynamometer (North Coast Medical, Inc, Gilroy, CA, USA). Two trials of grip strength were obtained for each hand, with all four trials averaged to yield strength. Gait speed was based on the time to walk 3 m, and the Short Physical Performance Battery (SPPB) was used to measure physical performance.10
Assessment of the participants’ activity was performed using the Frenchay Activity Index (FAI), which is an interviewer administered questionnaire of 15 standardised questions, using a 2–3 point ordinal scale.11 Higher points on the FAI reflects higher activity levels.
Laboratory assays
Venous blood sampling was performed and blood centrifuged at 3,000 rpm for 10 minutes, divided into aliquots, and frozen at −80°C to ensure integrity of the specimens. MCP-1 (DuoSet; R&D Systems, Minneapolis, MN, USA) assays were performed, according to manufacturer’s instructions. All serum samples were measured in duplicate, with the lower detection limit set at 10 pg/mL.
Statistical analysis
Results between the four phenotypes (normal, sarcopenia, obese, and SO) were analyzed using analysis of variance (ANOVA) with Bonferroni correction for all parametric continuous variables, and chi-square test for categorical variables, using the SPSS version 22 and STATA 13.0 statistical programs. We also performed separate correlation analyses between the biomarker levels with body fat and with appendicular lean mass.
Results
Baseline characteristics, anthropometric and functional data
Of the 143 study participants, 36 (25.2%) were normal, 22 (15.4%) were sarcopenic, 69 (48.3%) were obese, and 16 (11.2%) had SO (Table 1). There was a predominance of Chinese ethnicity, with significant sex differences observed. There was no difference in individual cardiac risk factors or composite cardiovascular risk score (total score of 7) for the subgroups. Patients with SO had the highest fat percentage (40.4%), despite only a slightly higher body mass index (BMI). SO subjects had the poorest functional performance on SPPB (9.88±3.16) and gait speed (0.99±0.26 m/s) compared with the other subgroups (Table 1). Sarcopenic adults had the lowest activity level (Frenchay Activity Index), followed by SO subjects, whilst normal subjects were the most active (33.78±5.09 [normal], 29.18±6.13 [sarcopenic], 32.55±4.50 [obese], and 31.63±4.05 [SO]) (P=0.007).
Table 1.
Baseline characteristics, anthropometric and functional performance, and MCP-1 levels among subgroups
| Variable | Overall (n=143) | Normal (n=36) | Sarcopenia (n=22) | Obesity (n=69) | SO (n=16) | P-value |
|---|---|---|---|---|---|---|
| Age (years) | 68.0±8.2 | 66.6±7.7 | 70.2±6.5 | 67.0±7.9 | 72.4±10.9 | 0.36 |
| Male, n (%) | 44 (30.8) | 20 (55.6) | 7 (31.8) | 16 (23.2) | 1 (6.3) | 0.001 |
| Chinese, n (%) | 133 (93.0) | 34 (94.4) | 22 (100) | 61 (88.4) | 16 (100) | 0.456 |
| Hypertension, n (%) | 72 (50.3) | 15 (41.7) | 11 (50) | 37 (53.6) | 9 (56.3) | 0.658 |
| Diabetes mellitus, n (%) | 30 (21.0) | 6 (16.7) | 5 (22.7) | 14 (20.3) | 5 (31.3) | 0.686 |
| Hyperlipidemia, n (%) | 97 (67.8) | 23 (63.9) | 13 (59.1) | 49 (71.0) | 12 (75.0) | 0.632 |
| Ischemic heart disease, n (%) | 3 (2.1) | 0 (0) | 1 (4.5) | 1 (1.4) | 1 (6.3) | 0.414 |
| Previous/current smoker, n (%) | 13 (9.1) | 5 (13.9) | 2 (9) | 4 (5.8) | 2 (12.5) | 0.601 |
| Peripheral vascular disease | 0 | 0 | 0 | 0 | 0 | – |
| Atrial fibrillation, n (%) | 8 (5.4) | 2 (5.6) | 1 (4.5) | 4 (5.5) | 1 (6.3) | 0.997 |
| Stroke, n (%) | 1 (0.699) | 0 | 0 | 0 | 0 | 0.393 |
| Composite vascular risk factors scorea | 1.57±1.19 | 1.34±0.23 | 1.14±0.24 | 1.05±0.13 | 1.94±0.38 | 0.623 |
| Alcohol ingestion, n (%) | 6 (4.2) | 3 (8.3) | 0 | 2 (2.9) | 1 (6.3) | 0.371 |
| Advanced organ failure, n (%) | 1 (0.699) | 0 | 0 | 1 (1.45) | 0 | 0.782 |
| Malignancy, n (%) | 7 (4.9) | 1 (2.9) | 1 (4.5) | 5 (7.2) | 0 | 0.58 |
| Statin use, n (%) | 76 (53.1) | 15 (41.7) | 8 (36.4) | 42 (60.9) | 11 (68.8) | 0.055 |
| Aspirin use, n (%) | 11 (7.7) | 3 (8.3) | 2 (9.1) | 5 (7.2) | 1 (6.3) | 0.986 |
| Anthropometric data and physical performance parameters | ||||||
| Body mass index (kg/m2) | 23.8±3.8 | 21.5±2.2d | 21.0±2.3f | 26.1±3.7 | 22.9±2.1h | 0.00 |
| Waist circumference (cm) | 86.1±8.9 | 79.7±6.7d | 77.8±5.5g | 91.6±7.2f | 87.9±4.1e | 0.00 |
| Percentage body fat, % | 36.3±7.1 | 30.4±5.8d | 33.8±6.0g | 39.0±6.2f | 40.4±5.0e | 0.00 |
| Appendicular lean mass (kg/m2) | 6.33±2.93 | 6.16±0.86 | 5.42±0.74 | 6.97±4.06 | 5.27±0.62 | 0.056 |
| Chair–stand testb (seconds) | 10.17±2.55 | 9.67±1.99 | 9.75±2.66 | 10.60±2.75 | 10.02±2.58 | 0.270 |
| SPPB total | 11.35±1.45 | 11.72±0.57 | 11.64±0.79 | 11.41±1.10 | 9.88±3.16 | 0.000 |
| Gait speed (m/s) | 1.14±0.22 | 1.21±0.20e | 1.10±0.21 | 1.14±0.20 | 0.99±0.26e | 0.006 |
| Average hand grip strength (kg) | 21.85±6.31 | 25.97±5.56c | 17.74±4.14f | 22.46±5.88d | 15.57±3.90e,h | 0.000 |
| Knee-extension strength (kg) | 35.04±8.54 | 37.88±8.26e | 33.85±5.46 | 35.56±8.64h | 28.59±9.16 | 0.003 |
| FAI | 32.27±5.05 | 33.78±5.09 | 29.18±6.13 | 32.55±4.50 | 31.63±4.05 | 0.007 |
| Blood biomarker | ||||||
| MCP-1, pg/mL | 113.9±46.3 | 104.4±35.4 | 96.6±22.3 | 116.2±45.0 | 148.8±74.2e,g | 0.002 |
Notes:
Composite vascular risk factor score = total number of vascular risk factors, including hypertension, diabetes mellitus, hyperlipidemia, ischemic heart disease, smoker, peripheral vascular disease, and stroke (maximum score: 7).
Time taken to stand up from seated position for five stands (FAI).
Post hoc results (with Bonferroni correction) between normal and sarcopenia (P<0.05).
Post hoc results (with Bonferroni correction) between normal and obese (P<0.05).
Post hoc results (with Bonferroni correction) between normal and SO (P<0.05).
Post hoc results (with Bonferroni correction) between sarcopenia and obesity (P<0.05).
Post hoc results (with Bonferroni correction) between sarcopenia and SO (P<0.05).
Post hoc results (with Bonferroni correction) between obese and SO (P<0.05).
Abbreviations: FAI, Frenchay Activity Index; MCP-1, monocyte chemoattractant protein-1; SO, sarcopenic obesity; SPPB, Short Physical Performance Battery.
Serum MCP-1 measurements
Significant differences in MCP-1 were detected, with MCP-1 elevation in SO subjects (104.4±35.4 pg/mL [normal], 96.6±22.3 pg/mL [sarcopenia], 116.2±45.0 pg/mL [obese], and 148.8±74.2 pg/mL [sarcopenic obese]) (P=0.002) (Table 1). These differences remained significant even after age and sex adjustments (P=0.006).
Significant correlation of MCP-1 was noted with body fat (Pearson correlation coefficient 0.195, P=0.02), with no significant correlation between MCP-1 and appendicular lean mass (Pearson correlation coefficient −0.001, P=0.98) (Table 2) (Figure 1A and B).
Table 2.
MCP-1 results and correlations
| Pearson correlation | Correlation coefficient | P-value |
|---|---|---|
| MCP-1 and percentage fat, % | 0.195 | 0.020* |
| MCP-1 and waist circumference, cm | 0.246 | 0.003* |
| MCP-1 and appendicular lean mass, kg/m2 | −0.001 | 0.986 |
| MCP-1 and SPPB | −0.118 | 0.159 |
| MCP-1 and mean hand-grip strength (kg) | −0.130 | 0.121 |
| MCP-1 and mean knee-extension strength (kg) | −0.056 | 0.509 |
Notes:
Correlation is significant at the 0.05 level (two-tailed).
Abbreviations: MCP-1, monocyte chemoattractant protein-1; SPPB, Short Physical Performance Battery.
Figure 1.
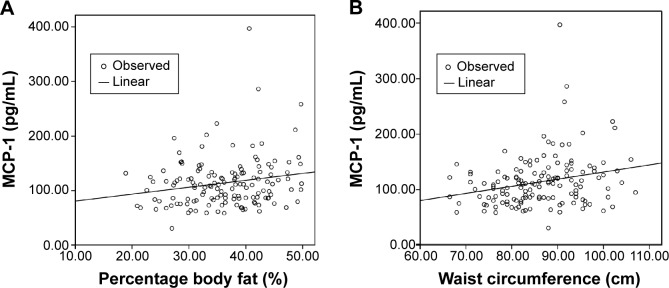
MCP-1 and (A) percentage body fat and (B) waist circumference.
Abbreviation: MCP-1, monocyte chemoattractant protein-1.
Conclusion
Many criticisms have been given with regards to the concept of “obesity paradox” in the older adult, whereby obesity in the elderly confers lower mortality rates from diseases in the elderly, contrary to the increased morbidity and mortality seen with obesity in younger adults.12–14 Arguments against the studies demonstrating the obesity paradox cite the use of BMI to stratify patients. Our study supports the notion that BMI is a poor indicator of excess adiposity in the body and lends credence to the use of waist circumference as a practical surrogate marker of adiposity in the older adult.
This study demonstrates that obesity in the older adult is associated with poorer performance and strength parameters. This finding is independent of sarcopenia and appendicular lean mass. Although obese subjects have higher appendicular lean mass compared with normal subjects, obese subjects in our study had poorer functional and strength measurements than normal subjects, ie, lower gait speed, lower hand grip strength, and knee-extension strength, and lower SPPB scores. This demonstrates that performance and function are not solely dependent on muscle mass. Altered endurance, biomechanics, and muscle function occurring as a result of obesity may contribute to poorer function and performance. Multiplying this effect, obesity coupled with presence of sarcopenia – the SO phenotype – results in further worsening of the performance and strength parameters, as evidenced by our study findings.
Elevated MCP-1 in SO and obesity is a reflection of a proinflammatory state associated with obesity.5 In our study, we demonstrated that sarcopenic obese older adults had markedly elevated MCP-1 levels compared with the sarcopenic-only and obese-only groups. This suggest that a proinflammatory milieu negatively affects muscle strength, performance, and mass, likely due to the combined effects of impaired muscle anabolism due to insulin resistance, and accelerated muscle catabolism. Mice studies have shown that treatment with an insulin-sensitizing drug (rosiglitazone) downregulated macrophage-originated genes, such as MCP-1.15 Further studies are needed to assess whether such therapies targeting MCP-1 or proinflammatory states will retard the onset of SO as well.
In addition, a previous study looking at MCP-1 as a cardiac biomarker demonstrated that patients with acute myocardial infarction (MI) who had baseline plasma MCP-1 levels above the 75th percentile had increased risk of death or recurring MI during the 10-month follow-up period.16 Mice studies also showed that increased MCP-1 levels were associated with an increase in end-diastolic dimensions, seen in cardiac senescence.17 These findings support the utility of MCP-1 as a prognostic marker of cardiovascular outcomes and as a therapeutic target, besides being an indicator of a proinflammatory state, which will be the next stage of the longitudinal aspect of our study.
A limitations of our study was that the sample size was relatively small. As such, although the difference of MCP-1 levels between SO patients and obese patients was large, the difference did not reach statistical significance. In addition, the use of cross-sectional data precludes our current ability to determine whether SO is a sequela of obesity or a coexistence of two separate entities. We postulate that obesity creates a proinflammatory milieu that accelerates muscle catabolism; this offsets muscle anabolism from the loading effect of obesity. Additionally, we plan to correlate these novel biomarker findings with conventional IGF-1 and IL-6 levels, in a larger baseline sample, followed up longitudinally.
SO may represent a distinct phenotype in older adults with performance limitations beyond sarcopenia-related lean mass alone. MCP-1 is significantly raised in SO, suggesting a potential role of inflammatory cytokines in the pathogenic mechanism of SO. These interesting results require further confirmation in longitudinal study and have potential therapeutic implications.
Acknowledgments
We thank Fong Yoke Leng for her assistance in patient recruitment and data collection.
This study was supported by a Lee Foundation grant 2013. MSC is supported by a National Healthcare Group (NHG) Clinician-Scientist Career Scheme (CSCS) grant (number 12002). LT is supported by a NHG CSCS grant (number 13001).
Footnotes
Disclosure
The authors report no conflicts of interest in this work.
References
- 1.Chen LK, Liu LK, Woo J, et al. Sarcopenia in Asia: consensus report of the Asian Working Group for Sarcopenia. J Am Med Dir Assoc. 2014;15(2):95–101. doi: 10.1016/j.jamda.2013.11.025. [DOI] [PubMed] [Google Scholar]
- 2.Baumgartner RN, Wayne SJ, Waters DL, Janssen I, Gallagher D, Morley JE. Sarcopenic obesity predicts instrumental activities of daily living disability in the elderly. Obes Res. 2004;12(12):1995–2004. doi: 10.1038/oby.2004.250. [DOI] [PubMed] [Google Scholar]
- 3.Roubenoff R. Sarcopenic obesity: does muscle loss cause fat gain? Lessons from rheumatoid arthritis and osteoarthritis. Ann N Y Acad Sci. 2000;904:553–557. doi: 10.1111/j.1749-6632.2000.tb06515.x. [DOI] [PubMed] [Google Scholar]
- 4.Roubenoff R, Freeman LM, Smith DE, Abad LW, Dinarello CA, Kehayias JJ. Adjuvant arthritis as a model of inflammatory cachexia. Arthritis Rheum. 1997;40(3):534–539. doi: 10.1002/art.1780400320. [DOI] [PubMed] [Google Scholar]
- 5.Xu H, Barnes GT, Yang Q, et al. Chronic inflammation in fat plays a crucial role in the development of obesity-related insulin resistance. J Clin Invest. 2003;112(12):1821–1830. doi: 10.1172/JCI19451. [DOI] [PMC free article] [PubMed] [Google Scholar]
- 6.Camps J, Rodríguez-Gallego E, García-Heredia A, et al. Paraoxonases and chemokine (C-C motif) ligand-2 in noncommunicable diseases. Adv Clin Chem. 2014;63:247–308. doi: 10.1016/b978-0-12-800094-6.00007-8. [DOI] [PubMed] [Google Scholar]
- 7.Bonapace L, Coissieux MM, Wyckoff J, et al. Cessation of CCL2 inhibition accelerates breast cancer metastasis by promoting angiogenesis. Nature. 2014;515(7525):130–133. doi: 10.1038/nature13862. [DOI] [PubMed] [Google Scholar]
- 8.Inadera H, Egashira K, Takemoto M, Ouchi Y, Matsushima K. Increase in circulating levels of monocyte chemoattractant protein-1 with aging. J Interferon Cytokine Res. 1999;19(10):1179–1182. doi: 10.1089/107999099313127. [DOI] [PubMed] [Google Scholar]
- 9.Executive Summary of the Third Report of the National Cholesterol Education Program (NCEP) Expert Panel on Detection, Evaluation, and Treatment of High Blood Cholesterol in Adults (Adult Treatment Panel III) JAMA. 2001;285(19):2486–2497. doi: 10.1001/jama.285.19.2486. No authors listed. [DOI] [PubMed] [Google Scholar]
- 10.Guralnik JM, Simonsick EM, Ferrucci L, et al. A short physical performance battery assessing lower extremity function: association with self-reported disability and prediction of mortality and nursing home admission. J Gerontol. 1994;49(2):M85–94. doi: 10.1093/geronj/49.2.m85. [DOI] [PubMed] [Google Scholar]
- 11.Schuling J, de Haan R, Limburg M, Groenier KH. The Frenchay Activities Index. Assessment of functional status in stroke patients. Stroke. 1993;24:1173–1177. doi: 10.1161/01.str.24.8.1173. [DOI] [PubMed] [Google Scholar]
- 12.Lainscak M, von Haehling S, Doehner W, Anker SD. The obesity paradox in chronic disease: facts and numbers. J Cachexia Sarcopenia Muscle. 2012;3:1–4. doi: 10.1007/s13539-012-0059-5. [DOI] [PMC free article] [PubMed] [Google Scholar]
- 13.Ferreira I, Stehouwer CD. Obesity paradox or inappropriate study designs? Time for life-course epidemiology. J Hypertens. 2012;30(12):2271–2275. doi: 10.1097/HJH.0b013e32835b4fe0. [DOI] [PubMed] [Google Scholar]
- 14.Strandberg TE, Stenholm S, Strandberg AY, Salomaa VV, Pitkälä KH, Tilvis RS. The “obesity paradox,” frailty, disability, and mortality in older men: a prospective, longitudinal cohort study. Am J Epidemiol. 2013;178(9):1452–1460. doi: 10.1093/aje/kwt157. [DOI] [PubMed] [Google Scholar]
- 15.Xu H, Barnes GT, Yang Q, et al. Chronic inflammation in fat plays a crucial role in the development of obesity-related insulin resistance. J Clin Invest. 2003;112(12):1821–1830. doi: 10.1172/JCI19451. [DOI] [PMC free article] [PubMed] [Google Scholar]
- 16.de Lemos JA, Morrow DA, Sabatine MS, et al. Association between plasma levels of monocyte chemoattractant protein-1 and long-term clinical outcomes in patients with acute coronary syndromes. Circulation. 2003;107(5):690–695. doi: 10.1161/01.cir.0000049742.68848.99. [DOI] [PubMed] [Google Scholar]
- 17.Chiao YA, Dai Q, Zhang J, et al. Multi-analyte profiling reveals matrix metalloproteinase-9 and monocyte chemotactic protein-1 as plasma biomarkers of cardiac aging. Circ Cardiovasc Genet. 2011;4(4):455–462. doi: 10.1161/CIRCGENETICS.111.959981. [DOI] [PMC free article] [PubMed] [Google Scholar]