

Abstract
Background
Phenotypic heterogeneity in autism has long been conjectured to be a major hindrance to the discovery of genetic risk factors, leading to numerous attempts to stratify children based on phenotype to increase power of discovery studies. This approach, however, is based on the hypothesis that phenotypic heterogeneity closely maps to genetic variation, which has not been tested. Our study examines the impact of sub-phenotyping of a well-characterized ASD sample on genetic homogeneity and the ability to discover common genetic variants conferring liability to ASD.
Methods
Genome-wide genotypic data of 2576 families from the Simons Simplex Collection (SSC) were analyzed in the overall sample and phenotypic subgroups defined on the basis of diagnosis, IQ, and symptom profiles. We conducted a family-based association study as well as estimating heritability and evaluating allele scores for each phenotypic subgroup.
Results
Association analyses revealed no genome-wide significant association signal. Sub-phenotyping did not increase power substantially. Moreover, allele scores built from the most associated SNPs, based on the odds ratio in the full sample, predicted case status in subsets of the sample equally well and heritability estimates were very similar for all subgroups.
Conclusions
In genome-wide association analysis of the SSC sample, reducing phenotypic heterogeneity had at most a modest impact on genetic homogeneity. Our results are based on a relatively small sample, one with greater homogeneity than the entire population; if they apply more broadly, they imply that analysis of sub-phenotypes is not a productive path forward for discovering genetic risk variants in ASD.
Keywords: genetics, gwas, autism, phenotype, heterogeneity, power
Introduction
Beyond its core diagnostic features, the presentation of autism spectrum disorder (ASD) often varies widely. Indeed many clinicians and researchers have remarked on its phenotypic heterogeneity and speculated that this heterogeneity is related to genetic variation (1). These observations have led to the conjecture that a means of discovering novel genetic variation underlying liability for ASD is to amass a large sample and subset the sample on phenotypic dimensions (2, 3, 4). The success of this approach relies on a relatively simple relationship between genetic and phenotypic variation. On the other hand, if the relationship were quite complex, so that myriad combinations of genetic variants could lead to similar phenotypic presentation, then this approach to discovery would be unlikely to be more successful than simply analyzing the total, albeit heterogeneous sample.
Such phenotypic sub-setting has successfully led to the identification of genetic variants in neurodevelopmental disorders. The severe developmental regression and stereotypical hand movements that typify Rett syndrome led to the identification of causal mutations in MECP2 (5) and FOXG1 (6). Conversely, identical 3Mb deletions at the 22q11.2 locus lead to extensive phenotypic heterogeneity across a range of neuropsychiatric disorders (7).
The results of several linkage studies in autism support the conjecture that stratifying children based on their phenotype yields genetically more homogeneous subgroups. Notably, for several studies the signal from linkage analysis increased substantially when the phenotype was narrowly defined, either using endophenotypes (8, 9, 10, 11) or dimensions stemming from factor analyses (12, 13, 14). Nonetheless the limited congruence of results from larger samples (15, 16) and from the smaller samples suggests that sub-phenotyping has limited impact on reducing genetic heterogeneity.
In contrast to linkage studies of psychiatric disorders, replicable association findings for common genetic variants are now becoming commonplace. This is especially true for genetic studies of schizophrenia, presumably due in large part to the tens of thousands of samples amassed for study (17, 18, 19). Indeed the number of discoveries and their replication are tightly correlated with sample size and comports with statistical theory of power for factors of small effect – as indeed all common variants affecting liability for schizophrenia appear to be. Aside from sample size, which lags for ASD, the genetics of ASD and schizophrenia have strong parallels. Liability for both appears to trace to common and rare variants, with the balance of liability – at the population level – tilted toward common variants (20, 21).
For ASD there is now sound evidence that common variants, en masse, exert a substantial effect on ASD liability. Heritability of autism attributable to common variants is estimated to be 40-60% (22) and the variance of the phenotype explained by allele scores derived from GWAS results has been shown to be significant (23). Thus, common variants play a major role in the pathophysiology of autism. Yet identifying even a small portion of those variants will be a major challenge for the next few years. Two paths for progress in this venture seem apparent: (1) use phenotypes to define clinical subgroups and thereby identify genetic variants accounting for more of the risk in the subgroup; or (2) genotype more affected and unaffected subjects or trios to increase sample size. While the results of schizophrenia studies suggest the second option is a successful path, the impact of reducing phenotypic heterogeneity on the ability to detect associated common variants remains to be determined.
A number of studies have attempted to identify informative clinical sub-phenotypes to reduce genetic heterogeneity and results from several studies suggest that certain clinical variables do improve statistical power of genetic analyses. Of these phenotypes, overall severity (4), Insistence on Sameness (IS) scores (24, 3), and IQ (10, 25) have been proposed as defining clinical subgroups. Moreover, a recent study has built on the results of factor analyzes of autistic symptoms. Indeed most factor studies suggest that the structure of ASD phenotype is best conceptualized as a dyad of symptoms with distinct social communication and repetitive behavior dimensions (26, 27, 28). Georgiades et al. (2), using a mixture model, find distinct profiles of relative severity of social-communicative impairment and repetitive behaviors. Finally, while not beyond reasonable doubt (29, 30), some studies suggest that DSM-IV categorical diagnosis could relate to more specific genetic liability (23, 31).
While all of the aforementioned studies contain promising results, it is difficult to judge whether using more homogeneous presentations of ASD, as these studies do, truly garner more power or not. Indeed, although this approach is relatively common across the fields within psychiatric genetics, insofar as we are aware there has been no rigorous analysis of whether these approaches generate greater genetic homogeneity and greater power to detect risk loci. Here we take a first step in that direction. We examine how phenotypic subgrouping impacts genetic heterogeneity and the ability to discover common genetics variants affecting risk for ASD. To do so we use the genome-wide genotypic data from the SSC (32) the largest cohort of autism simplex families amassed to date. Phenotypic subgroups are defined on the basis of ASD diagnostic category, IQ, ASD severity, insistence on sameness, and symptom profiles. We then conduct a family-based association study, as well as estimating heritability and evaluating allele scores for each phenotypic subgroup. The results from this study suggest that, in ASD, greater phenotypic homogeneity has only a modest impact on genetic homogeneity and in only a few instances does it appear likely to be a productive path for discovering genetic risk variants.
Method
Genotyping
Individuals from 2576 SSC families were genotyped for a million or more single nucleotide polymorphisms (SNPs) on one of three array versions - Illumina 1Mv1 (330 families), Illumina 1Mv3 Duo (1185 families), or Illumina HumanOmni2.5M (1061 families) - at the Yale Center for Genomic Analysis. Members of each family were analyzed on the same array version.
All individuals had call rates > 96.9% and thus all individuals were retained for analysis. Call rates for SNPs were determined for the 3,045,301 genotyped SNPs on the autosomes and chromosome X, in subsets of SNPs based on which platform produced the genotypes (Table S1). A total of 47,582 SNPs had a non-call rate > 2.5% and were subsequently removed from the analysis. Data were checked for reported sex, familial relationships and duplicates.
Phenotypes
Phenotypes were selected based on the previous research aimed at defining informative subgroups. Eleven groups (Table 1) were defined based on diagnosis, IQ, age at first words, ASD severity, insistence sameness, and symptom profiles. Regression and epilepsy were considered for analysis (33, 34), but were not included because they were relatively uncommon in the SSC cohort.
Table 1. Summary of phenotypic subsets.
| Subgroup | Abbreviated name | Criteria | N cases |
|---|---|---|---|
| Whole sample | All ASD | ASD on both ADI-R and ADOS | 2,575 |
| Restricted autism diagnosis | Autism | ADI-R “autism” & ADOS “autism” | 2,088 |
| Verbal IQ> 60 | High vIQ | Verbal IQ > 60 | 1,880 |
| Higher ADOS ASD symptoms | Severe ASD | Overall ADOS Calibrated Severity Score (CSS) ≥ 8 | 1,200 |
| Higher ADOS RRB symptoms | Severe RBB | ADOS Repetitive and Restrictive Behavior (RRB) CSS ≥ 8 | 1,589 |
| Higher ADOS social affect impairment | Severe SA | ADOS Social AffectCSS ≥ 8 | 1,091 |
| Higher ADI-R circumscribed interests | Sameness1 | ADI-R Circumscribed interests ≥ 2 | 1,474 |
| Higher ADI-R difficulty with change | Sameness2 | ADI-R Difficulty with change≥ 2 | 1,313 |
| Higher sensitivity to noise | Noise | ADI-R Sensitivity to noise ≥ 2 | 1,676 |
| ADOS CSS RRB higher than SA | RBB > SA | ADOS RRB CSS ≥ Social Affect CSS | 1,805 |
| ADOS CSS RRB much higher than SA | RBB ≫ SA | ADOS RRB CSS ≥ Social Affect CSS+2 | 880 |
The first subgroup of the full data was formed by considering only probands with a categorical diagnosis of “autism” based on ADI-R and ADOS (N = 2,088). The second subgroup (N=1,851) included subjects with relatively high verbal IQ (vIQ>61, see supplemental methods). Three more groups targeted inclusion of the most severely impaired children, based on high severity score on i) the total ADOS calibrated severity score (35), ii) the Social Affect (SA) calibrated severity score iii) the Restricted and Repetitive Behavior (RRB) calibrated severity score (36). High severity was defined as a score of 8 or more for each subgroup.
The distribution of the insistence on sameness (IS) score (24, see supplemental methods) was quasi-continuous and relatively symmetric. Three subscores (difficulty with change, sensitivity to noise and circumscribed interests) were used to define three distinct subgroups, whereas the full IS score was used for quantitative trait analysis. A second quantitative trait analysis was performed with age at first words treated as a continuous variable.
Lastly, two subgroups emphasized repetitive behaviors, a common feature of subjects with ASD. The first subgroup included all individuals who had a calibrated ADOS RRB score equal to or superior to SA calibrated ADOS score. A second subgroup was restricted to individuals whose RRB calibrated ADOS score exceeded SA calibrated ADOS score by ≥2.
Genetic association analysis
For family-based association analysis we analyzed only trios from the family (mother, father and proband diagnosed with ASD). Association analyses were performed using an in-house program (37) that implements the conditional logistic regression form of family-based association and by FBAT (38) for analysis of quantitative traits. In all, 20 genome-wide association analyses were performed. Among these 18 included families of all ancestry groups: analysis of the whole sample; 10 subgroups (Table 1); two quantitative trait locus (QTL) analysis of insistence on sameness and age at first words; and parent-of-origin analyses for the entire sample, those subjects with strict autism diagnosis and subjects with higher IQ; and one was based on the European ancestry subset of the full data. A complete listing of the 20 analyses can be found in Table 2. Note that results from SNPs showing strong association, yet with minor allele frequency MAF < 2.5% in parents and over-transmission of the common allele, were not displayed because they most likely represent false positive results.
Table 2. Association analyses models.
| Subgroup | N | Genetic models | |||
|---|---|---|---|---|---|
| additive | paternal | maternal | |||
| Whole sample | 2575 | √ | √ | √ | |
| European Ancestry | 1633 | √ | |||
| Subsets of the whole sample | |||||
| Restricted autism diagnosis | 2088 | √ | √ | √ | |
| Verbal IQ>60 | 1880 | √ | √ | √ | |
| Higher ADOS ASD symptoms | 1200 | √ | |||
| Higher ADOS RRB symptoms | 1589 | √ | |||
| Higher ADOS social affect impairment | 1091 | √ | |||
| Higher ADI-R circumscribed interests | 1474 | √ | |||
| Higher ADI-R difficulty with change | 1313 | √ | |||
| Higher sensitivity to noise | 1676 | √ | |||
| ADOS CSS RRB higher than SA | 1805 | √ | |||
| ADOS CSS RRB much higher than SA | 880 | √ | |||
| IS, QTL (whole sample) | 2575 | √ | |||
| Age at first words QTL (whole sample) | 2575 | √ | |||
Heritability estimates
Heritability was estimated in each subgroup as described elsewhere (22). In brief it was estimated from comparing ASD subjects with 1,663 individuals from HealthABC (39) using the GCTA software (40). The largest ASD sample analyzed comprised of subjects of European Ancestry (N=1633). All other subgroups were subsets of the European sample. To allow direct comparisons we used the same prevalence for ASD (0.01) for each subgroup.
Allele scores
We built on association results to compute a polygenic allele score and estimate the predictive value of this score for case control status, using the method developed by Purcell et al (41). Allele scores were defined based on the GWA signals from the association analysis in the full sample (N = 2,576 families). All SNPs associated with a p-value<0.001 were included in the score computation. Of note, the p-value threshold was lower than in the previous analyses to limit the number of predictors (42). For each autosomal SNP, the SNP-specific component of the score was calculated as the dosage of the risk allele multiplied by the corresponding log of the odds ratio. The allele-score approach requires controls as well as cases. Thus in each family a pseudo-control was generated by comparing the genotype of the parents to that of the proband and assigning the un-transmitted allele of each parent as the alleles for the pseudo-control's genotype. After generating a pseudo-control for each SNP and family, the individual-specific score was calculated by summing over the SNP-specific component values for each individual from the whole sample, using PLINK version 1.07 (41). Last, a logistic regression estimated the predictive value of the allele score for the case/control status.
Results
Association analyses
The association results are split into four categories: genome-wide significant (p <5 × 10⁻⁸); suggestive (p between 5 × 10⁻⁷ and > 5 × 10⁻⁸); unreliable (p < 5 × 10⁻⁷, but with all the hallmarks of genotyping error (43), including MAF < 0.05 and over-transmission of the major allele); and non-significant (p > 5 × 10⁻⁷). Only the genome-wide significant and suggestive findings will be reported in this manuscript. P-values are uncorrected for the 20 association tests performed.
No genome-wide significant SNPs were identified in a GWAS analysis of the complete dataset, or in any of the 18 phenotypic subsets of the data (Table 2). However, seven SNPs, meeting the threshold for suggestive association (p <5 × 10⁻⁷) look promising (Table 3). Among these, 6 SNPs are either located in, or have been shown to affect the expression of four genes involved in DNA integrity maintenance: CTU2, CUEDC2, ZNF365, TOPBP1 (44, 45, 46, 47, 48). Moreover, one of these SNPs (rs1409313) was shown to regulate cerebellum expression of C10orf26 (49), a gene associated with schizophrenia (50).
Table 3. Most associated SNPsa with case status in primary analyses.
| SNP | Chr | Clinical subgroup | P.LRT | OR | L95.OR | U95.OR | GENE | eQTLsb |
|---|---|---|---|---|---|---|---|---|
| rs11641365 | 16 | ADOS CSS RRB much higher than SA | 3.19e-07 | 2.06 | 1.54 | 2.76 | CTU2 | |
| rs2393895 | 10 | Higher ADOS social affect impairment | 2.23e-07 | 1.91 | 1.48 | 2.47 | ZNF365 | |
| rs868914 | 10 | Higher ADOS social affect impairment | 2.48e-07 | 1.68 | 1.37 | 2.07 | ZNF365 | |
| rs1867503 | 3 | ASD paternal model | 4.18e-07 | 1.55 | 1.30 | 1.84 | Regulates TOPBP1 | |
| rs1867504 | 3 | ASD paternal model | 4.18e-07 | 1.55 | 1.30 | 1.84 | Regulates TOPBP1 | |
| rs1409313 | 10 | ASD paternal model | 4.01e-07 | 1.75 | 1.40 | 2.18 | CUEDC2 | Regulates C10orf26 |
| rs4773054 | 13 | ASD paternal model | 5.25e-08 | 2.66 | 1.83 | 3.86 | ||
| rs4773054 | 13 | Autism paternal model | 7.28e-08 | 2.9 | 1.91 | 4.39 |
p<5×10⁻⁷ and MAF>0.05 and positive effect of the rare allele
In cerebellum or parietal cortex according to scan database (www.scandb.org, (49))
Analysis of the impact of sub-phenotyping on association results
Over all SNPs an obvious and anticipated impact of phenotypic subgrouping is to reduce the size of association statistic (one sided z decreases and p-values increase). In general, if subsamples are merely a random subsample of the larger sample, test statistics diminish in a very predictable fashion, specifically as the square root of the sample size for each subsample. In this study, association statistics (one-sided-z) on average diminish as a function of the square root of the sample size (Fig. 1a). The pattern itself is unremarkable because statistical theory shows power has this functional relationship, but what is remarkable is how closely the points adhere to the linear relationship.
Fig. 1.
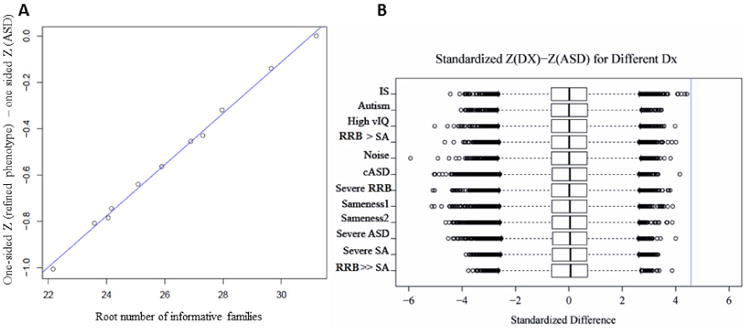
A) Relationship between the number of informative families and the average difference in z statistics for selected SNPs. For SNPs with p-value < 0.01 for association in the full sample, the difference in average z-statistics is calculated as the absolute value of the z-statistic for the full sample minus the absolute value of the z-statistic achieved for the subsample and the average is taken over all qualifying SNPs. The straight line shows the expected relationship for the difference if the samples were drawn at random from the full sample. B) Box plot of difference of one sided z in each phenotypic subset of the whole sample from one sided z score in all ASD. The difference was standardized. The vertical line in the plot is drawn at the one-sided Z -score of 4.58, corresponding to p=0.05/21,351.
Another way to view the influence of phenotypic subgrouping on association between SNP and case status is to examine how the p-value changes from the full sample to that for the subgroup. To examine this effect we conducted secondary analyses and selected a subset of 21,351 SNPs based on the following association results from the whole sample: p-value < 0.01 and OR > 1 if an allele with MAF < 0.025. To compare all subgroups, p-values in each subgroup were transformed into absolute values of the associated Z-scores. The difference between the one sided z score in the subgroup and the one sided z score in the full sample, corresponding to the shift toward association in the subgroup, was standardized (Fig. 1B). We did not observe a significant shift toward association (i.e. a standardized difference >4.58, corresponding to a p-value = 0.05/21351) for any SNP in any subgroup. However, the results of these secondary analyses were suggestive for 11 SNPs. Indeed, these SNPs were associated with case status with a p value < 2× 10⁻⁶ (i.e. significant when correcting for 21351 markers) in at least one of the subgroups analyses and standardized differences among the largest (>2) (Table 4). Among those, 6 SNPs were located in 4 genes (FBXW7, ZNF365, CTU2, PTCHD1), and one (rs3856064 on chromosome 1) was reported (www.scandb.org (49)) to regulate the expression of STX6 gene in parietal cortex. FBXW7 is involved in genome stability, and more specifically checkpoint signaling, through the regulation of cyclin E (51). Although the exact function of PTCHD1 is not known, it is thought to be involved in Hedgehog signaling which regulates the formation of the neural tube and brain (52).
Table 4. SNPs associated with a z-score>4.58 in one of the phenotypic subgroups in secondary analyses*.
| SNP | Chra | Subgroup | Pb | OR | L95%c | U95%d | GENE | eQTLsk |
|---|---|---|---|---|---|---|---|---|
| rs3856064 | 1 | Higher ADI-R SNe | 2.25E-06 | 1.37 | 1.2 | 1.56 | STX6 | |
| rs10021011 | 4 | Higher ADOS SAf impairment | 1.85E-06 | 1.62 | 1.32 | 1.99 | FBXW7 | |
| rs2393895 | 10 | Higher ADOS SAf impairment | 2.23E-07 | 1.91 | 1.48 | 2.47 | ZNF365 | |
| rs868913 | 10 | Higher ADOS SAf impairment | 5.11E-07 | 1.65 | 1.35 | 2.02 | ZNF365 | |
| rs868914 | 10 | Higher ADOS SAf impairment | 2.48E-07 | 1.68 | 1.37 | 2.07 | ZNF365 | |
| SNP12-76144695 | 12 | Higher ADI-R DCg | 1.41E-06 | 9.33 | 2.84 | 30.70 | ||
| rs11641365 | 16 | Extreme RRBh predominance | 3.19E-07 | 2.06 | 1.54 | 2.76 | CTU2 | |
| rs5751278 | 22 | Higher ADI-R CIi | 1.75E-06 | 1.57 | 1.3 | 1.90 | APOBEC3D | |
| rs5758742 | 22 | Higher ADI-R CIi | 5.70E-07 | 1.56 | 1.3 | 1.86 | APOBEC3D | |
| rs5751281 | 22 | Higher ADI-R CIi | 1.50E-06 | 1.56 | 1.31 | 1.93 | APOBEC3D | |
| rs5971115 | X | Restricted autism dxj | 1.67E-06 | 1.6 | 1.31 | 1.94 | PTCHD1 |
Choice of SNPs is based, in part, on the difference between the one sided z score in the subgroup and the one sided z score in the full sample, corresponding to the shift toward association in the subgroup.
Chromosome
p-value for association in the subgroup
Lower bound 95%CI OR
Upperbound 95%CI OR
Sensitivity to noise.
Socio-affective standardized score
Difficulty with change
Repetitive and ritualized behavior
Circumscribed interests
Diagnosis
In cerebellum or parietal cortex, according to scan database (www.scandb.org, (49)
Impact of sub-phenotyping on the genetic architecture of ASD
After examining the impact of sub-phenotyping on association statistics for each SNP, we evaluated its impact on genetic features of the sample as measured through a large number of SNPs, assessed jointly. In particular we investigated how heritability and allele scores changed across subgroups.
Heritability of this sample was previously evaluated by Klei et al. (22). In that study heritability was estimated from samples of European ancestry genotyped on the Illumina 1Mv1 or the Illumina 1Mv3 array. To be consistent with that study, we used the same approach and sample, after removing a small set of families according to the updated SSC participants list (these families being excluded mostly because of withdrawal of consent or additional cases in the simplex family, thereby altering its simplex status). For the ASD sample the estimated heritability was 0.401 (Fig 2, Table S2) and subgroups of this sample were not statistically different from the whole sample or other subsets. Estimated heritability, however, showed a trend toward a higher heritability estimate in the three subgroups defined by an excess of repetitive behaviors.
Fig. 2.
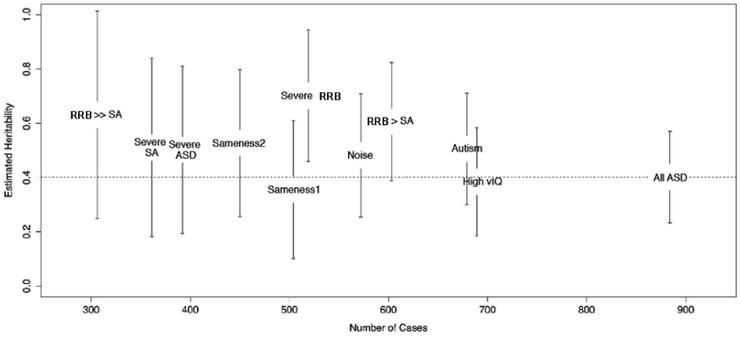
Heritability estimates in each phenotypic subset of the whole sample. All ASD=Whole sample, Autism=Restricted autism diagnosis, High vIQ=Verbal IQ> 60, Severe ASD=Higher ADOS ASD symptoms, Severe RBB=Higher ADOS RRB symptoms, Severe SA=Higher ADOS social affect impairment, Sameness1=Higher ADI-R circumscribed interests, Sameness2=Higher ADI-R difficulty with change, Noise=Higher sensitivity to noise, RBB > SA=ADOS CSS RRB higher than SA, RBB ≫ SA=ADOS CSS RRB much higher than SA.
A total of 2438 SNPs with a MAF > 0.025 showed an association p-value < 0.001 in the full ASD data. The allele score based on this set of SNPs explained around 0.454 the variance in case control status (pseudoR2) based on the whole sample and performed similarly for each subgroup (Fig. 3), indicating that the predictive value of the score does not differ materially amongst these samples. One can take a different approach in which one generates an allele score for each of the samples in Figure 3, yet such an approach yields results indistinguishable from those in Figure 3 (data not shown).
Fig. 3.
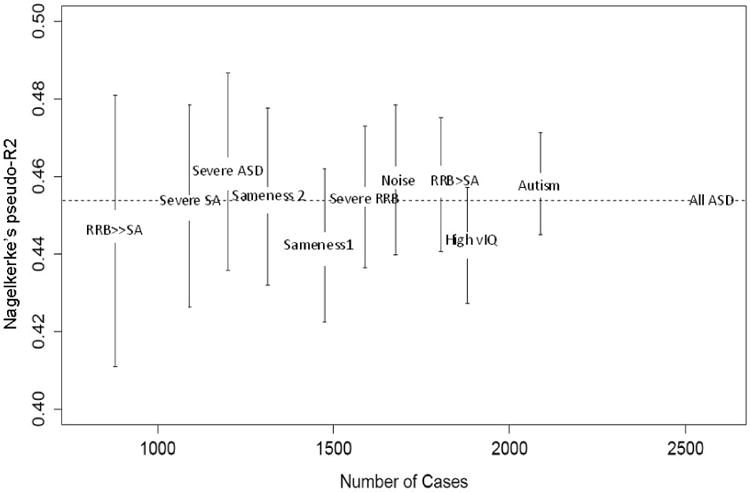
Portion of the variance of each phenotypic subset from the whole sample explained by the allele score computed from the whole sample analysis odds ratios. All ASD=Whole sample, Autism=Restricted autism diagnosis, High vIQ=Verbal IQ> 60, Severe ASD=Higher ADOS ASD symptoms, Severe RBB=Higher ADOS RRB symptoms, Severe SA=Higher ADOS social affect impairment, Sameness1=Higher ADI-R circumscribed interests, Sameness2=Higher ADI-R difficulty with change, Noise=Higher sensitivity to noise, RBB > SA=ADOS CSS RRB higher than SA, RBB ≫ SA=ADOS CSS RRB much higher than SA.
Discussion
A longstanding conjecture regarding the genetics of ASD is that ASD's great phenotypic heterogeneity is a key hindrance to the discovery of genetic factors conferring liability. Consequently, disentangling this heterogeneity has been deemed an essential step toward identification of genetic variants affecting risk (2, 13, 4). The results of this study, however, suggest that this approach cannot ensure success. To the contrary the results suggest that observable clinical variation phenotypic variability does not map closely onto common genetic variation.
The paucity of SNPs that emerge with certain sub-phenotypes suggests that subgrouping based on phenotype does not substantially increase power to detect associated common variants (Fig. 1A). One could argue that this is because sub-phenotyping loses power by reducing the size of the sample and that recruiting larger samples with homogeneous phenotype would lead to the identification of some associated SNPs. However, test statistics closely follow the expected linear relationship with square root of sample size. (Fig. 1A), suggesting that sub-phenotypes are not highly informative for genetic discovery. (Indeed, if sub-phenotypes were highly informative for genetic discovery we would expect some noteworthy deviation from the linear fit observed in Figure 1). Alleles scores, based on a small subset of SNPs, predict case status in the full sample and in subsamples based on various phenotypes (e.g., meeting ASD diagnostic criteria and manifesting repetitive behaviors) equally well. The similarity of the proportion of variance explained among subgroups suggests that subgrouping does not contribute much to our understanding of the genetics of risk for ASD in its various clinical forms. Taken together with the similarity of heritability estimates across subsamples this strongly suggests that subgrouping based on clinical phenotypes does little to modify the genetic architecture of autism risk in each subgroup and does not substantially increase genetic homogeneity. Consistent with these results, sub-phenotyping does not significantly shift one sided z scores toward higher values for any SNP. Remarkably, heritability estimates in the higher IQ group and the full sample show very little difference, even ignoring sampling error suggesting that the architecture of autism risk is similar in high IQ and low IQ populations. Intriguingly, this result appears at odds with the observation of a significant enrichment for de novo loss of function mutations in individuals with low IQ (53). We can not exclude that the relatively small size of the sample of people with low IQ, due to the large fraction of individuals with high IQ in the SSC, could obscur the difference in heritability. However, the results are also consistent with common variants making similar contribution to the ASD phenotype for both groups, while de novo mutations, in general, have a modest impact on risk for ASD and a greater impact on IQ. This interpretation is consistent with the conjecture of Samocha et al. (53). In this regard, when we excluded individuals with a clinically relevant CNV, which are likely to have a substantial impact on IQ (54), it did not substantially change association results (unpublished data).
These results, however, cannot be taken to mean that clinical phenotypes have no impact on power for discovering genetic associations and no underlying genetic basis. At some level they must, but the mapping of genotype and phenotype appears to be almost as complex as that between genotype and ASD itself. Still, examining the results of each subgroup separately raises the possibility that probands with high repetitive behaviors are a slightly more genetically homogeneous group and one worth further exploration. It is noteworthy that several lines of evidence support the existence of a different genetic etiology for RRB and SA symptoms (55, 56). Moreover, while some studies have suggested that the genetic architecture of autism risk slightly differs between sex (57, 58, 59), RRB have been found to be the main symptoms to be differently distributed between sex (60, 27, 59). The SNP which was found to be significantly shifted toward association in the high RRB subgroup, rs11641365, is located in CTU2.
Although no locus reached statistical significance after correcting for genome wide multiple testing in primary analyses, some of the genes that emerge from primary and secondary association analyses (CTU2, CUEDC2, ZNF365, TOPBP1, FBXW7; Tables 3 and 4) raise the possibility of a role for maintenance of genomic integrity in the pathophysiology of autism, a role highlighted in recent sequencing analyses of the 15q13.3 region (61). In addition FBXW7, which targets mTOR for ubiquitination and degradation and cooperates with PTEN (62), plays a key role in neural stem cell differentiation (63), and is required for cerebellar development (64). ZNF365 isoform D regulates the expression of DISC-1, a gene implicated in schizophrenia risk (65, 66). STX6 is a SNARE component (67) and thus may play a role in synaptic transmission. Finally PTCHD1 has been previously implicated in autism and intellectual disability (68, 52, 69, 70, 71). Interestingly the SNP rs5971115 was found to be substantially shifted toward association in the group with strict autistic disorder, which is characterized by a low IQ. However, it is important to underscore that all these association results are exploratory, none are statistically significant, and only additional independent data can determine what role, if any, they play in liability.
While we acknowledge that these results are based on a limited selection of phenotypes - and there still could be phenotypes, including biomarkers, which could be informative - they are in line with the body of work that has led to the single ASD category in DSM-5 classification (29 . They support ASD categorical diagnosis as a valid entity for the search of common variants increasing risk, which is consistent with high heritability estimates for ASD found in most studies (73, 22, 74). There are other limitations to our study, including its sample size, which could always be larger; perhaps the strict simplex nature of the families, which could limit heritable variation (22); somewhat reduced variability of phenotypes like IQ and ASD severity; and use of ASD/ID related behavioral phenotypes as opposed to medical and psychiatric comorbidity. On the other hand, taking the results presented here together with the emerging picture of autism risk architecture regarding for common variants, they suggest that phenotype is the result of the complex combination of a large number of modest allelic effects on each trait. If, as some authors have proposed, we can assume that there is no common variant of substantial effect on the risk of ASD (odds ratio> 1.2), but a great number of common variations with a more modest impact (75), the identification of common risk variants is hindered mainly by sample size and only marginally by clinical heterogeneity even in samples carefully phenotyped to confirm an ASD diagnosis. Thus the results of this study advocate for recruitment of larger cohorts of ASD subjects to identify common variation affecting risk for ASD. Indeed, while GWAS studies in ASD are large relative to earlier candidate gene studies, their sample sizes are still small relative to the majority of the studies in other complex diseases.
Supplementary Material
Acknowledgments
We are grateful to all of the families at the participating Simons Simplex Collection (SSC) sites, as well as the principal investigators (A. Beaudet, R. Bernier, J. Constantino, E. Cook, E. Fombonne, D. Geschwind, R. Goin-Kochel, E. Hanson, D. Grice, A. Klin, D. Ledbetter, C. Lord, C. Martin, D. Martin, R. Maxim, J. Miles, O. Ousley, K. Pelphrey, B. Peterson, J. Piggot, C. Saulnier, M. State, W. Stone, J. Sutcliffe, C. Walsh, Z. Warren, E. Wijsman). We appreciate obtaining access to phenotypic data on the Simons Foundation Autism Research Initiative (SFARI) Base. Approved researchers can obtain the SSC population dataset described in this study (http://sfari.org/resources/sfari-base), by applying at https://base.sfari.org. This work was supported by a grant from the Simons Foundation (SFARI 124827 to the investigators of the SSC Genetic Consortium); NIH R01HD065272 (CL), NIH R01MH089390 (CL), NIH R37 MH057881 (BD), NIMH 5R25MH071584-07 Malison (DMDL), NIMH 5 T32 MH19961-14 Malison (DMDL) and the Fondamental Foundation (PC).
Footnotes
Supplemental information: Yes, with 2 tables and 1 figure
Financial Disclosures: Dr. Cathy Lord receives royalties for the scales of diagnostic instruments for which she's a coauthor; she donates all royalties to autism charities. All other authors report no biomedical financial interests or potential conflict of interest.
Publisher's Disclaimer: This is a PDF file of an unedited manuscript that has been accepted for publication. As a service to our customers we are providing this early version of the manuscript. The manuscript will undergo copyediting, typesetting, and review of the resulting proof before it is published in its final citable form. Please note that during the production process errors may be discovered which could affect the content, and all legal disclaimers that apply to the journal pertain.
References
- 1.Jeste SS, Geschwind DH. Disentangling the heterogeneity of autism spectrum disorder through genetic findings. Nat Rev Neurol. 2014;10:74–81. doi: 10.1038/nrneurol.2013.278. [DOI] [PMC free article] [PubMed] [Google Scholar]
- 2.Georgiades S, Szatmari P, Boyle M, Hanna S, Duku E, Zwaigenbaum L, et al. Investigating phenotypic heterogeneity in children with autism spectrum disorder: a factor mixture modeling approach. J Child Psychol Psychiatry. 2013;54:206–215. doi: 10.1111/j.1469-7610.2012.02588.x. [DOI] [PubMed] [Google Scholar]
- 3.Hus V, Pickles A, Cook EH, Jr, Risi S, Lord C. Using the autism diagnostic interview--revised to increase phenotypic homogeneity in genetic studies of autism. Biol Psychiatry. 2007;61:438–448. doi: 10.1016/j.biopsych.2006.08.044. [DOI] [PubMed] [Google Scholar]
- 4.Veatch OJ, Veenstra-Vanderweele J, Potter M, Pericak-Vance MA, Haines JL. Genetically meaningful phenotypic subgroups in autism spectrum disorders. Genes Brain Behav. 2013;13:276–285. doi: 10.1111/gbb.12117. [DOI] [PubMed] [Google Scholar]
- 5.Amir RE, Van den Veyver IB, Wan M, Tran CQ, Francke U, Zoghbi HY. Rett syndrome is caused by mutations in X-linked MECP2, encoding methyl-CpG-binding protein 2. Nat Genet. 1999;23:185–188. doi: 10.1038/13810. [DOI] [PubMed] [Google Scholar]
- 6.Ariani F, Hayek G, Rondinella D, Artuso R, Mencarelli MA, Spanhol-Rosseto A, et al. FOXG1 is responsible for the congenital variant of Rett syndrome. Am J Hum Genet. 2008;83:89–93. doi: 10.1016/j.ajhg.2008.05.015. [DOI] [PMC free article] [PubMed] [Google Scholar]
- 7.Schneider M, Debbane M, Bassett AS, Chow EW, Fung WL, van den Bree MB, et al. Psychiatric Disorders From Childhood to Adulthood in 22q11.2 Deletion Syndrome: Results From the International Consortium on Brain and Behavior in 22q11.2 Deletion Syndrome. Am J Psychiatry. 2014 doi: 10.1176/appi.ajp.2013.13070864. [DOI] [PMC free article] [PubMed] [Google Scholar]
- 8.Buxbaum JD, Silverman J, Keddache M, Smith CJ, Hollander E, Ramoz N, et al. Linkage analysis for autism in a subset families with obsessive-compulsive behaviors: evidence for an autism susceptibility gene on chromosome 1 and further support for susceptibility genes on chromosome 6 and 19. Mol Psychiatry. 2004;9:144–150. doi: 10.1038/sj.mp.4001465. [DOI] [PubMed] [Google Scholar]
- 9.Buxbaum JD, Silverman JM, Smith CJ, Kilifarski M, Reichert J, Hollander E, et al. Evidence for a susceptibility gene for autism on chromosome 2 and for genetic heterogeneity. Am J Hum Genet. 2001;68:1514–1520. doi: 10.1086/320588. [DOI] [PMC free article] [PubMed] [Google Scholar]
- 10.Liu XQ, Paterson AD, Szatmari P. Genome-wide linkage analyses of quantitative and categorical autism subphenotypes. Biol Psychiatry. 2008;64:561–570. doi: 10.1016/j.biopsych.2008.05.023. [DOI] [PMC free article] [PubMed] [Google Scholar]
- 11.Shao Y, Wolpert CM, Raiford KL, Menold MM, Donnelly SL, Ravan SA, et al. Genomic screen and follow-up analysis for autistic disorder. Am J Med Genet. 2002;114:99–105. doi: 10.1002/ajmg.10153. [DOI] [PubMed] [Google Scholar]
- 12.Cannon DS, Miller JS, Robison RJ, Villalobos ME, Wahmhoff NK, Allen-Brady K, et al. Genome-wide linkage analyses of two repetitive behavior phenotypes in Utah pedigrees with autism spectrum disorders. Mol Autism. 2010;1:3. doi: 10.1186/2040-2392-1-3. [DOI] [PMC free article] [PubMed] [Google Scholar]
- 13.Liu XQ, Georgiades S, Duku E, Thompson A, Devlin B, Cook EH, et al. Identification of genetic loci underlying the phenotypic constructs of autism spectrum disorders. J Am Acad Child Adolesc Psychiatry. 2011;50:687–696 e613. doi: 10.1016/j.jaac.2011.05.002. [DOI] [PMC free article] [PubMed] [Google Scholar]
- 14.Shao Y, Cuccaro ML, Hauser ER, Raiford KL, Menold MM, Wolpert CM, et al. Fine mapping of autistic disorder to chromosome 15q11-q13 by use of phenotypic subtypes. Am J Hum Genet. 2003;72:539–548. doi: 10.1086/367846. [DOI] [PMC free article] [PubMed] [Google Scholar]
- 15.Szatmari P, Paterson AD, Zwaigenbaum L, Roberts W, Brian J, Liu XQ, et al. Mapping autism risk loci using genetic linkage and chromosomal rearrangements. Nat Genet. 2007;39:319–328. doi: 10.1038/ng1985. [DOI] [PMC free article] [PubMed] [Google Scholar]
- 16.Weiss LA, Arking DE, Daly MJ, Chakravarti A. A genome-wide linkage and association scan reveals novel loci for autism. Nature. 2009;461:802–808. doi: 10.1038/nature08490. [DOI] [PMC free article] [PubMed] [Google Scholar]
- 17.Schizophrenia working group of the Psychiatric Genomics Consortium. Biological insights from 108 schizophrenia-associated genetic loci. Nature. 2014;511:421–7. doi: 10.1038/nature13595. [DOI] [PMC free article] [PubMed] [Google Scholar]
- 18.Ripke S, O'Dushlaine C, Chambert K, Moran JL, Kahler AK, Akterin S, et al. Genome-wide association analysis identifies 13 new risk loci for schizophrenia. Nat Genet. 2013;45:1150–1159. doi: 10.1038/ng.2742. [DOI] [PMC free article] [PubMed] [Google Scholar]
- 19.Stefansson H, Ophoff RA, Steinberg S, Andreassen OA, Cichon S, Rujescu D, et al. Common variants conferring risk of schizophrenia. Nature. 2009;460:744–747. doi: 10.1038/nature08186. [DOI] [PMC free article] [PubMed] [Google Scholar]
- 20.Purcell SM, Moran JL, Fromer M, Ruderfer D, Solovieff N, Roussos P, et al. A polygenic burden of rare disruptive mutations in schizophrenia. Nature. 2014;506:185–190. doi: 10.1038/nature12975. [DOI] [PMC free article] [PubMed] [Google Scholar]
- 21.Gaugler T, Klei L, Sanders S, Bodea C, Goldberg AP, Lee AB, Mahajan M, Manaa D, Pawitan Y, Reichert J, Ripke S, Sandin S, Sklar P, Svantesson O, Reichenberg A, Hultman CM, Devlin B, Roeder K, Buxbaum JD. Most genetic risk for autism resides with common variation. Nat Genet. 2014;46:881–5. doi: 10.1038/ng.3039. [DOI] [PMC free article] [PubMed] [Google Scholar]
- 22.Klei L, Sanders SJ, Murtha MT, Hus V, Lowe JK, Willsey AJ, et al. Common genetic variants, acting additively, are a major source of risk for autism. Mol Autism. 2012;3:9. doi: 10.1186/2040-2392-3-9. [DOI] [PMC free article] [PubMed] [Google Scholar]
- 23.Anney R, Klei L, Pinto D, Almeida J, Bacchelli E, Baird G, et al. Individual common variants exert weak effects on the risk for autism spectrum disorder. Hum Mol Genet. 2012;21:4781–4792. doi: 10.1093/hmg/dds301. [DOI] [PMC free article] [PubMed] [Google Scholar]
- 24.Bishop SL, Hus V, Duncan A, Huerta M, Gotham K, Pickles A, et al. Subcategories of restricted and repetitive behaviors in children with autism spectrum disorders. J Autism Dev Disord. 2013;43:1287–1297. doi: 10.1007/s10803-012-1671-0. [DOI] [PMC free article] [PubMed] [Google Scholar]
- 25.Vieland VJ, Hallmayer J, Huang Y, Pagnamenta AT, Pinto D, Khan H, et al. Novel method for combined linkage and genome-wide association analysis finds evidence of distinct genetic architecture for two subtypes of autism. J Neurodev Disord. 2011;3:113–123. doi: 10.1007/s11689-011-9072-9. [DOI] [PMC free article] [PubMed] [Google Scholar]
- 26.Frazier TW, Youngstrom EA, Kubu CS, Sinclair L, Rezai A. Exploratory and confirmatory factor analysis of the autism diagnostic interview-revised. J Autism Dev Disord. 2008;38:474–480. doi: 10.1007/s10803-007-0415-z. [DOI] [PubMed] [Google Scholar]
- 27.Mandy WP, Charman T, Skuse DH. Testing the construct validity of proposed criteria for DSM-5 autism spectrum disorder. J Am Acad Child Adolesc Psychiatry. 2012;51:41–50. doi: 10.1016/j.jaac.2011.10.013. [DOI] [PubMed] [Google Scholar]
- 28.Snow AV, Lecavalier L. Comparing autism, PDD-NOS, and other developmental disabilities on parent-reported behavior problems: little evidence for ASD subtype validity. J Autism Dev Disord. 2011;41:302–310. doi: 10.1007/s10803-010-1054-3. [DOI] [PubMed] [Google Scholar]
- 29.Lord C, Petkova E, Hus V, Gan W, Lu F, Martin DM, et al. A multisite study of the clinical diagnosis of different autism spectrum disorders. Arch Gen Psychiatry. 2012;69:306–313. doi: 10.1001/archgenpsychiatry.2011.148. [DOI] [PMC free article] [PubMed] [Google Scholar]
- 30.Walker DR, Thompson A, Zwaigenbaum L, Goldberg J, Bryson SE, Mahoney WJ, et al. Specifying PDD-NOS: a comparison of PDD-NOS, Asperger syndrome, and autism. J Am Acad Child Adolesc Psychiatry. 2004;43:172–180. doi: 10.1097/00004583-200402000-00012. [DOI] [PubMed] [Google Scholar]
- 31.Salyakina D, Ma DQ, Jaworski JM, Konidari I, Whitehead PL, Henson R, et al. Variants in several genomic regions associated with asperger disorder. Autism Res. 2010;3:303–310. doi: 10.1002/aur.158. [DOI] [PMC free article] [PubMed] [Google Scholar]
- 32.Fischbach GD, Lord C. The Simons Simplex Collection: a resource for identification of autism genetic risk factors. Neuron. 2010;68:192–195. doi: 10.1016/j.neuron.2010.10.006. [DOI] [PubMed] [Google Scholar]
- 33.Nordahl CW, Lange N, Li DD, Barnett LA, Lee A, Buonocore MH, et al. Brain enlargement is associated with regression in preschool-age boys with autism spectrum disorders. Proc Natl Acad Sci U S A. 2011;108:20195–20200. doi: 10.1073/pnas.1107560108. [DOI] [PMC free article] [PubMed] [Google Scholar]
- 34.Tuchman R, Hirtz D, Mamounas LA. NINDS epilepsy and autism spectrum disorders workshop report. Neurology. 2013;81:1630–1636. doi: 10.1212/WNL.0b013e3182a9f482. [DOI] [PMC free article] [PubMed] [Google Scholar]
- 35.Gotham K, Pickles A, Lord C. Standardizing ADOS scores for a measure of severity in autism spectrum disorders. J Autism Dev Disord. 2009;39:693–705. doi: 10.1007/s10803-008-0674-3. [DOI] [PMC free article] [PubMed] [Google Scholar]
- 36.Hus V, Gotham K, Lord C. Standardizing ADOS Domain Scores: Separating Severity of Social Affect and Restricted and Repetitive Behaviors. J Autism Dev Disord. 2012 doi: 10.1007/s10803-012-1719-1. [DOI] [PMC free article] [PubMed] [Google Scholar]
- 37.Crossett A, Kent BP, Klei L, Ringquist S, Trucco M, Roeder K, et al. Using ancestry matching to combine family-based and unrelated samples for genome-wide association studies. Stat Med. 2010;29:2932–2945. doi: 10.1002/sim.4057. [DOI] [PMC free article] [PubMed] [Google Scholar]
- 38.Laird NM, Horvath S, Xu X. Implementing a unified approach to family-based tests of association. Genet Epidemiol. 2000;19 Suppl 1:S36–42. doi: 10.1002/1098-2272(2000)19:1+<::AID-GEPI6>3.0.CO;2-M. [DOI] [PubMed] [Google Scholar]
- 39.Health-ABC http://www.ncbi.nlm.nih.gov/projects/gap/cgibin/study.cgi?studyid=phs000169.v1.p1
- 40.Yang J, Lee SH, Goddard ME, Visscher PM. GCTA: a tool for genome-wide complex trait analysis. Am J Hum Genet. 2010;88:76–82. doi: 10.1016/j.ajhg.2010.11.011. [DOI] [PMC free article] [PubMed] [Google Scholar]
- 41.Purcell SM, Wray NR, Stone JL, Visscher PM, O'Donovan MC, Sullivan PF, et al. Common polygenic variation contributes to risk of schizophrenia and bipolar disorder. Nature. 2009;460:748–752. doi: 10.1038/nature08185. [DOI] [PMC free article] [PubMed] [Google Scholar]
- 42.Tibshirani R. Regression shrinkage and selection via the lasso. J Royal Statist Soc B. 1996;58:267–288. [Google Scholar]
- 43.Gordon D, Heath SC, Liu X, Ott J. A transmission/disequilibrium test that allows for genotyping errors in the analysis of single-nucleotide polymorphism data. Am J Hum Genet. 2001;69:371–380. doi: 10.1086/321981. [DOI] [PMC free article] [PubMed] [Google Scholar]
- 44.Dewez M, Bauer F, Dieu M, Raes M, Vandenhaute J, Hermand D. The conserved Wobble uridine tRNA thiolase Ctu1-Ctu2 is required to maintain genome integrity. Proc Natl Acad Sci U S A. 2008;105:5459–5464. doi: 10.1073/pnas.0709404105. [DOI] [PMC free article] [PubMed] [Google Scholar]
- 45.Kumagai A, Lee J, Yoo HY, Dunphy WG. TopBP1 activates the ATR-ATRIP complex. Cell. 2006;124:943–955. doi: 10.1016/j.cell.2005.12.041. [DOI] [PubMed] [Google Scholar]
- 46.Zhang WN, Zhou J, Zhou T, Li AL, Wang N, Xu JJ, et al. Phosphorylation-triggered CUEDC2 degradation promotes UV-induced G1 arrest through APC/C(Cdh1) regulation. Proc Natl Acad Sci U S A. 2013a;110:11017–11022. doi: 10.1073/pnas.1221009110. [DOI] [PMC free article] [PubMed] [Google Scholar]
- 47.Zhang Y, Park E, Kim CS, Paik JH. ZNF365 promotes stalled replication forks recovery to maintain genome stability. Cell Cycle. 2013b;12:2817–2828. doi: 10.4161/cc.25882. [DOI] [PMC free article] [PubMed] [Google Scholar]
- 48.Zhang Y, Shin SJ, Liu D, Ivanova E, Foerster F, Ying H, et al. ZNF365 promotes stability of fragile sites and telomeres. Cancer Discov. 2013c;3:798–811. doi: 10.1158/2159-8290.CD-12-0536. [DOI] [PMC free article] [PubMed] [Google Scholar]
- 49.Gamazon ER, Zhang W, Konkashbaev A, Duan S, Kistner EO, Nicolae DL, et al. SCAN: SNP and copy number annotation. Bioinformatics. 2010;26:259–262. doi: 10.1093/bioinformatics/btp644. [DOI] [PMC free article] [PubMed] [Google Scholar]
- 50.Consortium TSPG-WASG. Genome-wide association study identifies five new schizophrenia loci. Nat Genet. 2011;43:969–976. doi: 10.1038/ng.940. [DOI] [PMC free article] [PubMed] [Google Scholar]
- 51.Strohmaier H, Spruck CH, Kaiser P, Won KA, Sangfelt O, Reed SI. Human F-box protein hCdc4 targets cyclin E for proteolysis and is mutated in a breast cancer cell line. Nature. 2001;413:316–322. doi: 10.1038/35095076. [DOI] [PubMed] [Google Scholar]
- 52.Noor A, Whibley A, Marshall CR, Gianakopoulos PJ, Piton A, Carson AR, et al. Disruption at the PTCHD1 Locus on Xp22.11 in Autism spectrum disorder and intellectual disability. Sci Transl Med. 2010;2:49ra68. doi: 10.1126/scitranslmed.3001267. [DOI] [PMC free article] [PubMed] [Google Scholar]
- 53.Samocha KE, Robinson EB, Sanders SJ, Stevens C, Sabo A, McGrath LM, et al. A framework for the interpretation of de novo mutation in human disease. 2014 doi: 10.1038/ng.3050. [DOI] [PMC free article] [PubMed] [Google Scholar]
- 54.Stefansson H, Meyer-Lindenberg A, Steinberg S, Magnusdottir B, Morgen K, Arnarsdottir S, et al. CNVs conferring risk of autism or schizophrenia affect cognition in controls. 2014 doi: 10.1038/nature12818. [DOI] [PubMed] [Google Scholar]
- 55.Dworzynski K, Happe F, Bolton P, Ronald A. Relationship between symptom domains in autism spectrum disorders: a population based twin study. J Autism Dev Disord. 2009;39:1197–1210. doi: 10.1007/s10803-009-0736-1. [DOI] [PubMed] [Google Scholar]
- 56.Ronald A, Larsson H, Anckarsater H, Lichtenstein P. A twin study of autism symptoms in Sweden. Mol Psychiatry. 2011;16:1039–1047. doi: 10.1038/mp.2010.82. [DOI] [PubMed] [Google Scholar]
- 57.Iossifov I, Ronemus M, Levy D, Wang Z, Hakker I, Rosenbaum J, et al. De novo gene disruptions in children on the autistic spectrum. Neuron. 2012;74:285–299. doi: 10.1016/j.neuron.2012.04.009. [DOI] [PMC free article] [PubMed] [Google Scholar]
- 58.Robinson EB, Lichtenstein P, Anckarsater H, Happe F, Ronald A. Examining and interpreting the female protective effect against autistic behavior. Proc Natl Acad Sci U S A. 2013;110:5258–5262. doi: 10.1073/pnas.1211070110. [DOI] [PMC free article] [PubMed] [Google Scholar]
- 59.Szatmari P, Liu XQ, Goldberg J, Zwaigenbaum L, Paterson AD, Woodbury-Smith M, et al. Sex differences in repetitive stereotyped behaviors in autism: implications for genetic liability. Am J Med Genet B Neuropsychiatr Genet. 2012;159B:5–12. doi: 10.1002/ajmg.b.31238. [DOI] [PubMed] [Google Scholar]
- 60.Lord C, Schopler E, Revicki D. Sex differences in autism. J Autism Dev Disord. 1982;12:317–330. doi: 10.1007/BF01538320. [DOI] [PubMed] [Google Scholar]
- 61.Ionita-Laza I, Xu B, Makarov V, Buxbaum JD, Roos JL, Gogos JA, et al. Scan statistic-based analysis of exome sequencing data identifies FAN1 at 15q13.3 as a susceptibility gene for schizophrenia and autism. Proc Natl Acad Sci U S A. 2014;111:343–348. doi: 10.1073/pnas.1309475110. [DOI] [PMC free article] [PubMed] [Google Scholar]
- 62.Mao JH, Kim IJ, Wu D, Climent J, Kang HC, DelRosario R, et al. FBXW7 targets mTOR for degradation and cooperates with PTEN in tumor suppression. Science. 2008;321:1499–1502. doi: 10.1126/science.1162981. [DOI] [PMC free article] [PubMed] [Google Scholar]
- 63.Hoeck JD, Jandke A, Blake SM, Nye E, Spencer-Dene B, Brandner S, et al. Fbw7 controls neural stem cell differentiation and progenitor apoptosis via Notch and c-Jun. Nat Neurosci. 2010;13:1365–1372. doi: 10.1038/nn.2644. [DOI] [PubMed] [Google Scholar]
- 64.Jandke A, Da Costa C, Sancho R, Nye E, Spencer-Dene B, Behrens A. The F-box protein Fbw7 is required for cerebellar development. Dev Biol. 2011;358:201–212. doi: 10.1016/j.ydbio.2011.07.030. [DOI] [PubMed] [Google Scholar]
- 65.Hattori T, Baba K, Matsuzaki S, Honda A, Miyoshi K, Inoue K, et al. A novel DISC1-interacting partner DISC1-Binding Zinc-finger protein: implication in the modulation of DISC1-dependent neurite outgrowth. Mol Psychiatry. 2007;12:398–407. doi: 10.1038/sj.mp.4001945. [DOI] [PubMed] [Google Scholar]
- 66.Hennah W, Varilo T, Kestila M, Paunio T, Arajarvi R, Haukka J, et al. Haplotype transmission analysis provides evidence of association for DISC1 to schizophrenia and suggests sex-dependent effects. Hum Mol Genet. 2003;12:3151–3159. doi: 10.1093/hmg/ddg341. [DOI] [PubMed] [Google Scholar]
- 67.Murray RZ, Wylie FG, Khromykh T, Hume DA, Stow JL. Syntaxin 6 and Vti1b form a novel SNARE complex, which is up-regulated in activated macrophages to facilitate exocytosis of tumor necrosis Factor-alpha. J Biol Chem. 2005;280:10478–10483. doi: 10.1074/jbc.M414420200. [DOI] [PubMed] [Google Scholar]
- 68.Filges I, Rothlisberger B, Blattner A, Boesch N, Demougin P, Wenzel F, et al. Deletion in Xp22.11: PTCHD1 is a candidate gene for X-linked intellectual disability with or without autism. Clin Genet. 2011;79:79–85. doi: 10.1111/j.1399-0004.2010.01590.x. [DOI] [PubMed] [Google Scholar]
- 69.Pinto D, Pagnamenta AT, Klei L, Anney R, Merico D, Regan R, et al. Functional impact of global rare copy number variation in autism spectrum disorders. Nature. 2010;466:368–372. doi: 10.1038/nature09146. [DOI] [PMC free article] [PubMed] [Google Scholar]
- 70.Sanders SJ, Ercan-Sencicek AG, Hus V, Luo R, Murtha MT, Moreno-De-Luca D, et al. Multiple recurrent de novo CNVs, including duplications of the 7q11.23 Williams syndrome region, are strongly associated with autism. Neuron. 2011;70:863–885. doi: 10.1016/j.neuron.2011.05.002. [DOI] [PMC free article] [PubMed] [Google Scholar]
- 71.Whibley AC, Plagnol V, Tarpey PS, Abidi F, Fullston T, Choma MK, et al. Fine-scale survey of X chromosome copy number variants and indels underlying intellectual disability. Am J Hum Genet. 2010;87:173–188. doi: 10.1016/j.ajhg.2010.06.017. [DOI] [PMC free article] [PubMed] [Google Scholar]
- 72.Snow AV, Lecavalier L, Houts C. The structure of the Autism Diagnostic Interview-Revised: diagnostic and phenotypic implications. J Child Psychol Psychiatry. 2009;50:734–742. doi: 10.1111/j.1469-7610.2008.02018.x. [DOI] [PubMed] [Google Scholar]
- 73.Bailey A, Le Couteur A, Gottesman I, Bolton P, Simonoff E, Yuzda E, et al. Autism as a strongly genetic disorder: evidence from a British twin study. Psychol Med. 1995;25:63–77. doi: 10.1017/s0033291700028099. [DOI] [PubMed] [Google Scholar]
- 74.Stilp RL, Gernsbacher MA, Schweigert EK, Arneson CL, Goldsmith HH. Genetic variance for autism screening items in an unselected sample of toddler-age twins. J Am Acad Child Adolesc Psychiatry. 2010;49:267–276. doi: 10.1016/j.jaac.2009.11.012. [DOI] [PMC free article] [PubMed] [Google Scholar]
- 75.Devlin B, Melhem N, Roeder K. Do common variants play a role in risk for autism? Evidence and theoretical musings. Brain Res. 2010;1380:78–84. doi: 10.1016/j.brainres.2010.11.026. [DOI] [PMC free article] [PubMed] [Google Scholar]
Associated Data
This section collects any data citations, data availability statements, or supplementary materials included in this article.