

Abstract
The apparent stasis in the evolution of avian chromosomes suggests that birds may have experienced relatively low rates of gene gain and loss in multigene families. To investigate this possibility and to explore the phenotypic consequences of variation in gene copy number, we examined evolutionary changes in the families of genes that encode the α- and β-type subunits of hemoglobin (Hb), the tetrameric α2β2 protein responsible for blood-O2 transport. A comparative genomic analysis of 52 bird species revealed that the size and membership composition of the α- and β-globin gene families have remained remarkably constant during approximately 100 My of avian evolution. Most interspecific variation in gene content is attributable to multiple independent inactivations of the αD-globin gene, which encodes the α-chain subunit of a functionally distinct Hb isoform (HbD) that is expressed in both embryonic and definitive erythrocytes. Due to consistent differences in O2-binding properties between HbD and the major adult-expressed Hb isoform, HbA (which incorporates products of the αA-globin gene), recurrent losses of αD-globin contribute to among-species variation in blood-O2 affinity. Analysis of HbA/HbD expression levels in the red blood cells of 122 bird species revealed high variability among lineages and strong phylogenetic signal. In comparison with the homologous gene clusters in mammals, the low retention rate for lineage-specific gene duplicates in the avian globin gene clusters suggests that the developmental regulation of Hb synthesis in birds may be more highly conserved, with orthologous genes having similar stage-specific expression profiles and similar functional properties in disparate taxa.
Keywords: avian genomics, gene deletion, gene duplication, gene family evolution, hemoglobin, protein evolution
Introduction
Relative to the genomes of mammals, avian genomes are characterized by lower rates of chromosomal evolution and lower levels of structural variation within and among species (Burt et al. 1999; Shetty et al. 1999; Derjusheva et al. 2004; Griffin et al. 2007, 2008; Backstrom et al. 2008; Ellegren 2010, 2013; Zhang et al. 2014). At the nucleotide sequence level, birds have lower substitution rates relative to mammals and squamate reptiles, but they have somewhat higher rates than crocodilians (the sister group to birds, representing the only other extant lineage of archosaurs) and turtles, the sister group to archosaurs (Mindell et al. 1996; Nam et al. 2010; Shaffer et al. 2013; Green et al. 2014). The high level of conserved synteny among avian genomes suggests that birds may have experienced relatively low rates of gene turnover in multigene families. This hypothesis can be tested by characterizing rates and patterns of gene turnover in well-characterized multigene families—such as the globin gene superfamily—that share a high degree of conserved synteny across all amniote lineages.
The α- and β-globin genes encode subunits of the tetrameric α2β2 hemoglobin (Hb) protein, which is responsible for blood-O2 transport in the red blood cells of jawed vertebrates (gnathostomes). The α- and β-globin genes were tandemly linked in the last common ancestor of gnathostomes, a chromosomal arrangement that has been retained in some lineages of ray-finned fishes, lobe-finned fishes, and amphibians (Jeffreys et al. 1980; Hosbach et al. 1983; Gillemans et al. 2003; Fuchs et al. 2006; Opazo et al. 2013; Schwarze and Burmester 2013). In amniote vertebrates, the α- and β-globin genes are located on different chromosomes due to transposition of the proto β-globin gene(s) to a new chromosomal location after the ancestor of amniotes diverged from amphibians (Hardison 2008; Patel et al. 2008; Hoffmann, Storz, et al. 2010; Hoffmann, Opazo, Storz, et al. 2012).
Because the vertebrate Hb genes comprise one of the most intensively studied multigene families from a functional standpoint (Hardison 2001, 2012; Hoffmann, Storz, et al. 2010; Storz, Opazo, et al. 2011; Hoffmann, Opazo, Storz, 2012; Storz et al. 2013; Burmester and Hankeln 2014), the examination of globin gene family evolution provides an opportunity to assess the phenotypic consequences of changes in gene content. Specifically, changes in gene copy number and divergence between paralogs can promote Hb isoform differentiation, which can result in physiologically important modifications of blood-O2 transport and aerobic energy metabolism. Changes in the size and membership composition of the α- and β-globin gene families may produce changes in the developmental regulation of Hb synthesis and may therefore constrain or potentiate functional divergence between Hb isoforms that incorporate the products of paralogous globin genes (Berenbrink et al. 2005; Berenbrink 2007; Opazo et al. 2008a, 2008b; Runck et al. 2009; Hoffmann, Storz, et al. 2010; Storz, Hoffmann, et al. 2011; Storz, Opazo, et al. 2011; Grispo et al. 2012; Damsgaard et al. 2013; Opazo et al. 2013; Storz et al. 2013). Indeed, over a deeper timescale of animal evolution, the co-option and functional divergence of more ancient members of the globin gene superfamily have played a well-documented role in evolutionary innovation (Hoffmann, Opazo, et al. 2010; Blank et al. 2011; Hoffmann, Opazo, Hoogewijs, et al. 2012; Hoffmann, Opazo, Storz, 2012; Hoogewijs et al. 2012; Schwarze and Burmester 2013; Schwarze et al. 2014).
All gnathostome taxa that have been examined to date express structurally and functionally distinct Hb isoforms during different stages of prenatal development (Hardison 2001), and some tetrapod groups coexpress different Hb isoforms during postnatal life. The majority of birds and nonavian reptiles coexpress two functionally distinct Hb isoforms in definitive erythrocytes: HbA (with α-chain subunits encoded by the αA-globin gene) and HbD (with α-chain subunits encoded by the αD-globin gene; fig. 1). In adult birds, HbA and HbD represent major and minor isoforms, respectively, where HbD typically accounts for 10–40% of total Hb (Grispo et al. 2012).
Fig. 1.

Postnatally expressed Hb isoforms in avian red blood cells. The major isoform, HbA (αA2β2), has α-type subunits encoded by the αA-globin gene, and the minor isoform, HbD (αD2β2), has α-type subunits encoded by the αD-globin gene. Both isoforms share identical β-type subunits encoded by the βA-globin gene. The remaining members of the α- and β-globin gene families (αE-, ρ-, βH-, and ε-globin) are not expressed at appreciable levels in the definitive erythrocytes of adult birds. Within each gene cluster, the intergenic spacing is not drawn to scale.
Most bird species have retained each of three tandemly linked α-type globin genes that were present in the last common ancestor of tetrapod vertebrates: 5′-αE-αD-αA-3′ (Hoffmann and Storz 2007; Hoffmann, Storz, et al. 2010; Grispo et al. 2012). The proto αE- and αA-globin genes originated via tandem duplication of an ancestral proto α-globin gene, and αD-globin originated subsequently via duplication of the proto αE-globin gene (Hoffmann and Storz 2007; Hoffmann, Storz, et al. 2010). Both duplication events occurred in the stem lineage of tetrapods after divergence from the ancestor of lobe-finned fishes approximately 370–430 Ma (Hoffmann and Storz 2007). In all tetrapods that have been examined to date, the linkage order of the three α-type globin genes reflects their temporal order of expression during development: αE-globin is exclusively expressed in larval/embryonic erythroid cells derived from the yolk sac, αD-globin is expressed in both primitive and definitive erythroid cells, and αA-globin is expressed in definitive erythroid cells during later stages of prenatal development and postnatal life (Cirotto et al. 1987; Ikehara et al. 1997; Alev et al. 2008, 2009; Storz, Hoffmann, et al. 2011).
Most variation in the size of the avian α-globin gene family is attributable to multiple independent deletions or inactivations of the αD-globin gene (Zhang et al. 2014). Due to consistent differences in O2-binding properties between the HbA and HbD isoforms (Grispo et al. 2012), losses of the αD-globin gene likely contribute to among-species variation in blood-O2 affinity, which has important physiological consequences. In all bird species that have been examined to date, HbD is characterized by a higher O2-binding affinity relative to HbA (Grispo et al. 2012), and it also exhibits other unique properties, such as a propensity to self-associate upon deoxygenation (Cobb et al. 1992; Knapp et al. 1999; Rana and Riggs 2011) which may enhance the cooperativity of O2 binding (Riggs 1998).
Comparative studies of endothermic vertebrates have documented a positive scaling relationship between body mass and blood-O2 affinity (Schmidt-Nielsen and Larimer 1958; Lutz et al. 1974; Bunn 1980), although the pattern is not as clear in birds as it is in mammals (Baumann and Baumann 1977; Lutz 1980). Available data suggest that, in general, the higher the mass-specific metabolic rate of an animal, the higher the partial pressure of O2 (PO2) at which the blood releases O2 to the cells of respiring tissues. This high unloading tension preserves a steep O2 diffusion gradient between capillary blood and perfused tissue, thereby enhancing O2 flux to the tissue mitochondria. Given that relative HbA/HbD expression levels should be an important determinant of blood-O2 affinity, it is of interest to assess whether such expression levels are phylogenetically correlated with body mass. One clear prediction is that avian taxa with especially high mass-specific metabolic rates, like hummingbirds and passerines, have evolved a reduced HbD expression level, which (all else being equal) would produce a reduced blood-O2 affinity.
The main objectives of the present study were to assess the phenotypic consequences of changes in gene copy number, and to assess relationships between rates of gene retention, expression levels, and functional constraint. The specific aims were 1) to characterize patterns of gene turnover and interparalog gene conversion in the α- and β-globin gene clusters of birds, 2) to estimate the number of independent inactivations/deletions of the αD-globin gene during the diversification of birds, 3) to characterize among-species variation in the relative expression of HbA and HbD isoforms, 4) to reconstruct evolutionary changes in HbA/HbD expression levels during the diversification of birds, and 5) to characterize variation in functional constraint among paralogous globin genes. To achieve these aims, we conducted a comparative genomic analysis of the avian α- and β-globin gene clusters in 52 species (supplementary table S1, Supplementary Material online), building on our previous analysis of high-coverage genome assemblies for 22 species (Zhang et al. 2014). We conducted molecular evolution analyses based on globin sequences from a phylogenetically diverse set of 83 bird species, including 50 newly generated sequences from species for which full genome sequences were not available. Finally, using experimental measures of protein expression for 122 bird species, we conducted a phylogenetic comparative analysis to reconstruct evolutionary changes in HbA/HbD isoform abundance.
Results and Discussion
Genomic Structure of the Avian α- and β-Globin Gene Families
To characterize the genomic structure of the avian globin gene clusters, we analyzed contigs from a set of 24 bird species that contained the full complement of α- and β-type globin genes. Our comparative genomic analysis of these 24 species revealed that the size and membership composition of the globin gene families have remained remarkably constant, as most bird species have retained an identical complement of three tandemly linked α-type globin genes (5′-αE-αD-αA-3′) and four tandemly linked β-type globin genes (5′-ρ-βH-βA-ε-3′; fig. 2). In eutherian mammals, in contrast, the α- and β-globin gene clusters have experienced high rates of gene turnover due to lineage-specific duplication and deletion events, resulting in functionally significant variation in globin gene repertoires among contemporary species (Hoffmann et al. 2008a, 2008b; Opazo et al. 2008a; Opazo et al. 2009; Gaudry et al. 2014). In rodents alone, the number of functional α-type globin genes ranges from 2 to 8 (Hoffmann et al. 2008b; Storz et al. 2008) and the number of functional β-type globin genes ranges from 3 to 7 (Hoffmann et al. 2008a). To quantify this apparent difference in the tempo of gene family evolution in birds and mammals, we used a stochastic birth–death model to estimate rates of gene turnover (λ) in the globin gene clusters of 24 bird species and 22 species of eutherian mammals that span a similar range of divergence times. Results of this analysis revealed that the rate of gene turnover in the avian globin gene clusters is roughly two times lower than in eutherian mammals (λ = 0.0013 vs. 0.0023). Available data suggest that the α- and β-globin gene clusters of squamate reptiles have also undergone a high rate of gene turnover relative to homologous gene clusters in birds (Hoffmann, Storz, et al. 2010; Storz, Hoffmann, et al. 2011).
Fig. 2.

Genomic structure of the α- and β-globin gene clusters in 24 bird species. The phylogeny depicts a time-calibrated supertree (see Materials and Methods for details). The 24 species represented in the figure are those for which we have accounted for the full repertoire of α- and β-type globin genes. Truncated genes may have been produced by partial deletion events, but in some cases the apparently truncated coding sequences may represent assembly artifacts.
Inference of Orthologous Relationships and Detection of Interparalog Gene Conversion
To reconstruct phylogenetic relationships and to examine patterns of molecular evolution, we analyzed all available α- and β-type globin sequences from a phylogenetically diverse set of 83 bird species. Phylogeny reconstructions based on coding sequence confirmed that the paralogous α-type globin genes grouped into three well-supported clades and clearly identifiable orthologs of each gene are present in other amniote taxa (fig. 3). Similarly, the phylogeny reconstruction of β-type genes recovered four clades representing the ρ-, βH-, βA-, and ε-globin paralogs (fig. 4). The four avian β-type paralogs are reciprocally monophyletic relative to the β-type globins of other amniotes, indicating that they represent the products of at least three successive rounds of tandem duplication in the stem lineage of birds. The phylogeny revealed several cases of interparalog gene conversion between the embryonic ρ- and ε-globin genes, as documented previously in analyses of the chicken and zebra finch β-globin gene clusters (Reitman et al. 1993; Hoffmann, Storz, et al. 2010). A history of interparalog gene conversion between ρ- and ε-globin is evident in several cases where sequences from genes that are positional homologs of ρ-globin are nested within the clade of ε-globin sequences, and vice versa (fig. 4). For example, ρ- and ε-globin coding sequences of downy woodpecker (Picoides pubescens) were placed sister to one another in what is otherwise a clade of ρ-globin sequences (fig. 4), indicating that the ε-globin gene of this species has been completely overwritten by ρ→ε gene conversion. Additional examples of interparalog gene conversion between the ρ- and ε-globin genes are evident in phylogeny reconstructions with more extensive taxon sampling (supplementary fig. S1, Supplementary Material online).
Fig. 3.

Bayesian phylogeny depicting relationships among avian α-type globin genes based on nucleotide sequence data. Sequences of α-type globin genes from other tetrapod vertebrates (axolotl salamander [Ambystoma mexicanum], western clawed frog [Xenopus tropicalis], anole lizard [Anolis carolinensis], painted turtle [Chrysemys picta], platypus [Ornithorhynchus anatinus], and human [Homo sapiens]) were used as outgroups. Bayesian posterior probabilities are shown for the ancestral nodes of each clade of orthologous avian genes.
Fig. 4.
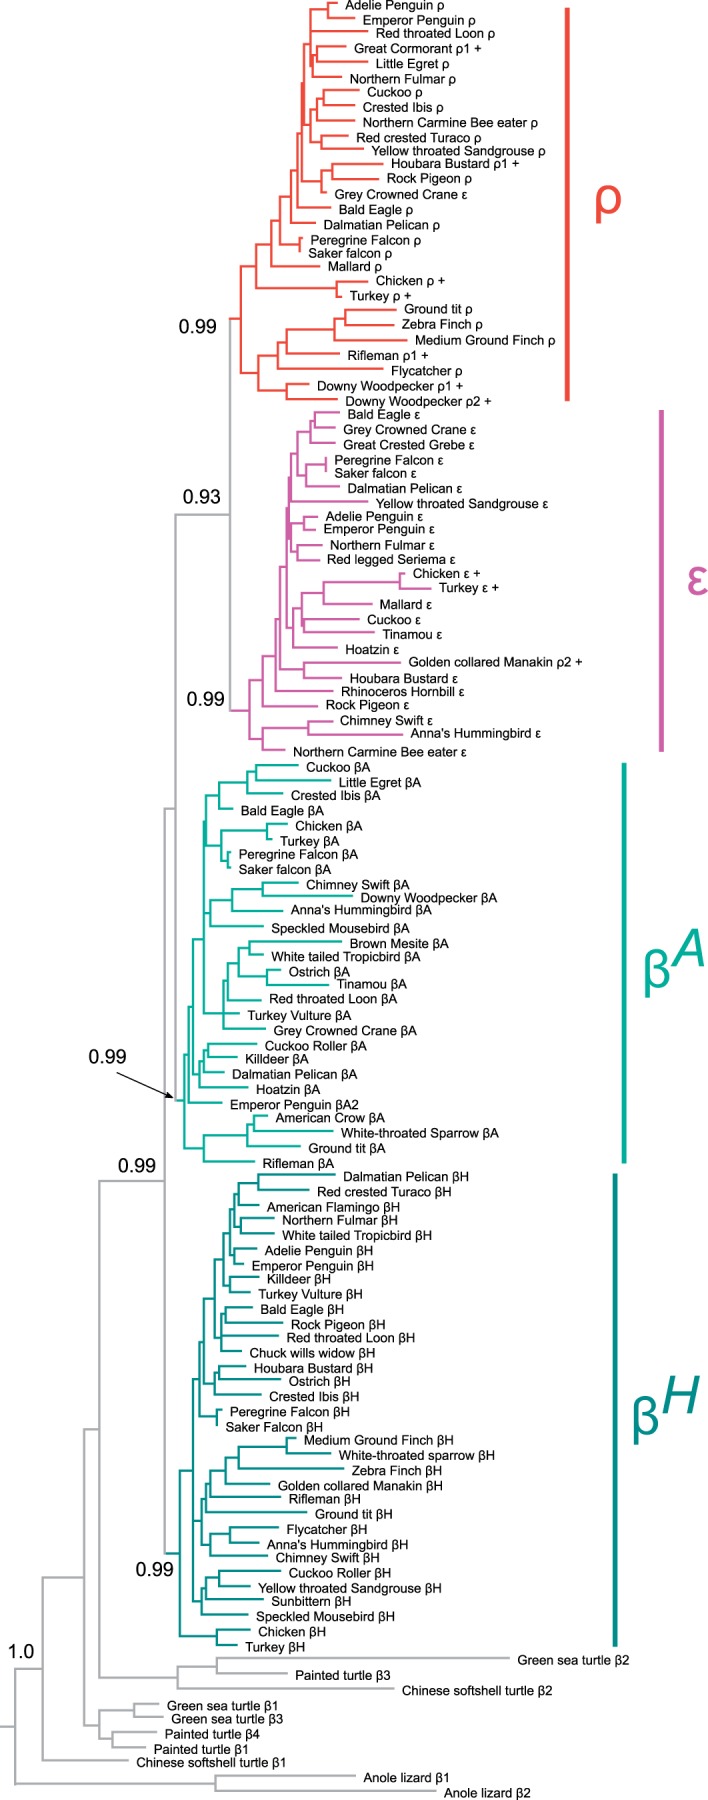
Bayesian phylogeny depicting relationships among avian β-type globin genes based on nucleotide sequence data. Sequences of β-type globin genes from other tetrapod vertebrates (anole lizard [Anolis carolinensis], Chinese softshell turtle [Pelodiscus sinensis], green sea turtle [Chelonia mydas], and painted turtle [Chrysemys picta]) were used as outgroups. Bayesian posterior probabilities are shown for the ancestral nodes of each clade of orthologous avian genes, and for select nodes uniting clades of paralogous genes. Branch-tip labels with '+' symbols denote genes that have been partially overwritten by interparalog gene conversion (see text for details).
In both chicken and zebra finch, the βH-globin gene is expressed at scarcely detectable levels in definitive erythrocytes (Alev et al. 2008, 2009). But whereas the βH-globin gene is quiescent in the primitive erythrocytes of the developing chick embryo (Alev et al. 2008), it is highly expressed during the analogous stage of embryogenesis in zebra finch (Alev et al. 2009). Analyses of chicken β-type genes by Reitman et al. (1993) suggested that the two embryonic genes (ρ and ε) form a reciprocally monophyletic group relative to βH and βA, although recent analyses based on more extensive sequence data recovered the topology (βH(βA(ρ, ε))) (Alev et al. 2009; Hoffmann, Storz, et al. 2010). Results of the Bayesian analysis shown in figure 4 are consistent with these more recent analyses, although posterior probabilities for key nodes varied markedly depending on which alignments were used. Maximum-likelihood analyses did not provide better resolution, as bootstrap support values for key nodes were consistently less than 50%. Likelihood-based topology tests comparing the two best-supported arrangements ((βH,βA) (ρ, ε)) and (βH (βA (ρ, ε))) were not statistically significant (supplementary table S2, Supplementary Material online). Based on available data, we regard the relationship among βH, βA, and the two embryonic β-type globins (ρ, ε) as an unresolved trichotomy.
Gene Turnover in the Avian α- and β-Globin Gene Families
The comparative genomic analysis revealed that most variation in the size of the avian globin gene families is attributable to deletions or inactivations of individual genes from the ancestral repertoire of α- and β-type globins. We documented lineage-specific duplications of the βA-globin gene in several species, including downy woodpecker, crested ibis (Nipponia nippon), and emperor penguin (Aptenodytes forsteri). In both downy woodpecker and crested ibis, the 3′-βA gene copies are clearly pseudogenes (fig. 2). We also identified putatively pseudogenized copies of duplicated ρ- and ε-globin genes in several species (fig. 2).
We found no evidence for lineage-specific gene gains via tandem duplication in the α-globin gene family, although analyses of Hb isoform diversity at the protein level suggest that duplications of postnatally expressed α-type globin genes have occurred in at least two species of Old World vultures: Griffon vulture, Gyps fulvus (Grispo et al. 2012) and Rüppell’s griffon, G. rueppellii (Hiebl et al. 1988). Most variation in gene content in the avian β-globin gene family is attributable to occasional lineage-specific deletions or inactivations of the βH-, ρ-, and ε-globin genes (fig. 2).
In the avian α-globin gene family, most interspecific variation in gene content is attributable to independent deletions or inactivations of the αD-globin gene. In the sample of 24 species for which we have contigs containing complete α-globin gene clusters, parsimony suggests that there were multiple independent inactivations of αD-globin (fig. 2). Specifically, the αD-globin gene appears to have been deleted or otherwise pseudogenized in golden-collared manakin (Manacus vitellinus), little egret (Egretta gazetta), Adelie penguin (Pygoscelis adeliae), emperor penguin (A. forsteri), killdeer (Charadrius vociferus), and hoatzin (Opisthocomus hoazin). Partial deletions of the αD-globin gene in both penguin species were likely inherited from a common ancestor, consistent with evidence that penguins do not express HbD during postnatal life (fig. 5; supplementary table S3, Supplementary Material online). The αD-globin appears to have been deleted in killdeer and pseudogenized in hoatzin. Killdeer (representing Charadriiformes + Gruiformes) and hoatzin (Opisthocomiformes) are sister taxa in our tree, which is based on the total-evidence phylogenomic time-tree of Jarvis et al. (2014). Although this suggests that inactivation of αD-globin occurred in the common ancestor of killdeer and hoatzin, these taxa diverged during a rapid post-KPg radiation and their phylogenetic positions are still poorly resolved even with whole-genome data (Jarvis et al. 2014). Furthermore, the period during which killdeer and hoatzin shared an exclusive common ancestor would have been exceedingly brief, supporting the hypothesis of independent inactivation in each lineage. In light of this uncertainty, parsimony suggests either four or five independent losses of the αD-globin gene in the set of species included in our comparative analysis.
Fig. 5.

Inferred evolutionary changes in relative expression level of the HbD isoform (% of total Hb) during the diversification of birds. Expression data are based on experimental measures of protein abundance in the definitive red blood cells of 122 bird species (n = 1–30 individuals per species, 267 specimens in total). Terminal branches are color-coded according to the measured HbD expression level of each species, and internal branches are color-coded according to maximum-likelihood estimates of ancestral character states. Branch lengths are proportional to time. See Materials and Methods for details regarding the construction of the time-calibrated supertree.
The repeated inactivations of αD-globin in multiple avian lineages are reflective of a broader macroevolutionary trend among tetrapods. Genomic evidence indicates that the αD-globin gene has been independently inactivated or deleted in amphibians and mammals (Cooper et al. 2006; Fuchs et al. 2006; Hoffmann and Storz 2007; Hoffmann et al. 2008b; Hoffmann, Storz, et al. 2010; Hoffmann et al. 2011). Some mammalian lineages have retained an intact, transcriptionally active copy of αD-globin (Goh et al. 2005), but there is no evidence that the product of this seemingly defunct gene is assembled into functionally intact Hbs at any stage of development. The HbD isoform is not expressed in the definitive erythrocytes of crocodilians (Weber and White 1986, 1994; Grigg et al. 1993; Weber et al. 2013), suggesting that the αD-globin gene has been inactivated or deleted in the extant sister group of birds. Alternatively, the crocodilian αD ortholog (if present) may only be expressed during embryonic development, in which case the HbD isoform may have simply gone undetected in studies of red blood cells from adult animals. The fact that the αD-globin gene has been deleted or inactivated multiple times in birds may simply reflect the fact that it encodes the α-type subunit of a minor Hb isoform; it may therefore be subject to less stringent functional constraints than the paralogous αE- and αA-globin genes that encode subunits of major (less dispensable) Hb isoforms that are expressed during embryonic and postnatal development, respectively.
Evolutionary Changes in HbA/HbD Isoform Expression
The assembly of α2β2 Hb tetramers is governed by electrostatic interactions between α- and β-chain monomers and between αβ dimers (Bunn and McDonald 1983; Mrabet et al. 1986; Bunn 1987). For this reason, and also because of possible interparalog variation in mRNA stability, the relative transcript abundance of coexpressed α- and β-type globin genes in hematopoietic cells may not accurately predict the proportional representation of the encoded subunit isoforms in functionally intact, tetrameric Hbs. We therefore directly measured the relative abundance of HbA and HbD isoforms in red cell lysates rather than relying on measures of αA/αD transcript abundance as proxy measures of protein abundance.
Our survey of HbA/HbD expression levels in 122 avian species revealed high variability among lineages (supplementary table S3, Supplementary Material online). HbD accounted for approximately 20–40% of total Hb in the majority of species, but this isoform was altogether absent in all or most representatives of five major avian clades: Aequornithia (core waterbirds; represented by one species of stork, two herons, two pelicans, one cormorant, and two penguins), Columbiformes (represented by six species of pigeons and doves), Coraciiformes (represented by one species of roller), Cuculiformes (represented by three species of cuckoo and one coucal), and Psittaciformes (represented by seven species of parrot from the families Psittacidae and Psittaculidae). On average, HbD expression was also quite low in swifts and hummingbirds (Apodiformes), not exceeding 25% of total Hb in any species. HbD was expressed at very low levels in several species of hummingbirds (mean ± 1 SD): 3.4% ± 1.2 in the wedge-billed hummingbird, Schistes geoffroyi (n = 7 individuals), 3.2% ± 0.7 in the sparkling violetear, Colibri coruscans (n = 7), and 1.6% ± 2.0 in the bronzy Inca, Coeligena coeligena (n = 7; supplementary table S3, Supplementary Material online). In contrast, HbD seldom accounted for less than 25% of total Hb in 42 examined species of passerines (supplementary table S3, Supplementary Material online).
The relative expression level of HbD exhibited strong phylogenetic inertia (fig. 5). Pagel’s lamda (Pagel 1999), which varies from zero (no phylogenetic inertia) to 1.0 (strong phylogenetic inertia) was 0.981 for the percentage of HbD across the avian phylogeny. Blomberg’s K was 0.861 (significantly greater than zero, P < 0.001), indicating that there was less trait similarity among species than expected for a trait evolving under perfect Brownian motion (K = 1). These results indicate that measured HbD expression levels exhibit a statistically significant pattern of phylogenetic conservatism, although the deviation from expectations under Brownian motion could be partly attributable to measurement error or sampling error (Blomberg et al. 2003; Garland et al. 2005).
Body mass exhibited even stronger phylogenetic inertia than HbD expression in the same set of taxa (Pagel’s lambda = 0.999; Blomberg’s K=3.80). Regression analysis using a phylogenetic generalized least-squares model revealed no evidence for an association between body mass and HbD expression (R2 = 0.01, P = 0.62). Thus, if blood-O2 affinity scales inversely with mass-specific metabolic rate in birds, as suggested by Lutz et al. (1974), results of our analysis suggest that the scaling relationship is not attributable to evolutionary changes in HbA/HbD expression levels. Instead, any such relationship must be attributable to evolutionary changes in the inherent oxygenation properties of Hb isoforms and/or changes in intraerythrocytic concentrations of cellular cofactors that allosterically regulate Hb-O2 affinity.
Variation in Functional Constraint among Paralogs
To infer relative levels of functional constraint among the different globin paralogs, we used a codon-based maximum-likelihood approach to measure variation in the ratio of nonsynonymous-to-synonymous substitution rates (ω = dN/dS). For the α-type genes, the model that provided the best fit to the data permitted four independent ω-values: one for each avian paralog and one for all avian outgroup branches (table 1). If rates of gene retention and relative expression levels are positively correlated with the degree of functional constraint, then the clear prediction is that the αD-globin clade will be characterized by a higher ω-value than the αA-globin clade. Consistent with expectations, the estimated ω-value for the αD-globin gene was appreciably higher (0.281 vs. 0.237, respectively; table 1). The exclusively embryonic αE-globin gene was characterized by the lowest ω-value (0.127; table 1). In the case of the β-type globin genes, the model that provided the best fit to the data permitted three independent ω-values for 1) βH and βA, 2) ρ and ε, and 3) all nonavian branches (table 2). Similar to the pattern observed for the α-type genes, the embryonic ρ- and ε-globin genes were characterized by lower ω-values relative to βH- and βA-globin (0.084 vs. 0.100; table 2). Observed patterns for both the α- and β-type globins are consistent with the idea that genes expressed early in development are generally subject to more stringent functional constraints relative to later-expressed members of the same gene family (Goodman 1963).
Table 1.
Maximum-Likelihood Analysis of the Ratio of Nonsynonymous-to-Synonymous Substitution Rates, ω (=dN/dS), in the α-Type Globin Genes of Birds.
| Models | ln L | No. Parameters | Parameter Estimates | Candidate Sites for Positive Selection | Test |
|---|---|---|---|---|---|
| Site models—αE-globin | |||||
| M0 | −3887.294 | 98 | ω0 = 0.154 | NA | |
| M1a | −3759.181 | 99 | ω0 = 0.047 (p0 = 0.84) | NA | |
| ω1 = 1.000 (p1 = 0.16) | |||||
| M2 | −3758.104 | 101 | ω0 = 0.047 (p0 = 0.84) | 53 A (ω = 1.901, P = 0.894) | M2 vs M1a |
| ω1 = 1.000 (p1 = 0.15) | Not Significant | ||||
| ω2 = 2.107 (p2 = 0.01) | |||||
| M3 | −3737.840 | 102 | ω0 = 0.016 (p0 = 0.71) | M3 vs M0 | |
| ω1 = 0.325 (p1 = 0.24) | P << 10−3 | ||||
| ω2 = 1.387 (p2 = 0.05) | |||||
| Site models—αD-globin | |||||
| M0 | −5666.162 | 96 | ω0 = 0.236 | NA | |
| M1a | −5377.678 | 97 | ω0 = 0.080 (p0 = 0.66) | NA | |
| ω1 = 1.000 (p1 = 0.34) | |||||
| M2 | −5358.625 | 99 | ω0 = 0.083 (p0 = 0.64) | 12 P (ω = 2.393, P = 0.576) | M2 vs. M1a |
| ω1 = 1.000 (p1 = 0.30) | 17 G (ω = 2.987, P = 0.788) | P << 10−3 | |||
| ω2 = 3.253 (p2 = 0.06) | 23 L (ω = 3.236, P = 0.880) | ||||
| 29 D (ω = 3.585, P = 1.000**) | |||||
| 48 H (ω = 3.580, P = 0.998**) | |||||
| 49 P (ω = 3.569, P = 0.994**) | |||||
| 63 A (ω = 2.581, P = 0.639) | |||||
| M3 | −5320.501 | 100 | ω0 = 0.016 (p0 = 0.44) | M3 vs. M0 | |
| ω1 = 0.292 (p1 = 0.40) | P << 10−3 | ||||
| ω2 = 1.306 (p2 = 0.16) | |||||
| Site models—αA-globin | |||||
| M0 | −5166.185 | 112 | ω0 = 0.214 | NA | |
| M1a | −4867.244 | 113 | ω0 = 0.050 (p0 = 0.74) | NA | |
| ω1 = 1.000 (p1 = 0.26) | |||||
| M2 | −4837.546 | 115 | ω0 = 0.049 (p0 = 0.73) | 5 N (ω = 4.457, P = 0.872) | M2 vs. M1a |
| ω1 = 1.000 (p1 = 0.24) | 49 H (ω = 5.271, P = 0.788) | P << 10−3 | |||
| ω2 = 4.862 (p2 = 0.03) | 64 A (ω = 4.911, P = 0.880) | ||||
| 115 S (ω = 5.263, P = 1.000**) | |||||
| M3 | −4830.789 | 116 | ω0 = 0.021 (p0 = 0.65) | M3 vs. M0 | |
| ω1 = 0.374 (p1 = 0.21) | P << 10−3 | ||||
| ω2 = 1.216 (p2 = 0.14) | |||||
| Branch models | |||||
| 1ω | −19867.046 | 341 | ω_all branches = 0.200 | NA | |
| 2ω | −19861.435 | 342 | ω_α-type genes = 0.214 | NA | 1ω vs. 2ω |
| ω_other branches = 0.157 | P << 10−3 | ||||
| 4ω | −19831.984 | 344 | ω_αE total group = 0.127 | NA | 2ω vs. 4ω |
| ω_αD total group = 0.281 | P << 10−3 | ||||
| ω_αA total group = 0.237 | |||||
| ω_other branches = 0.158 | |||||
| 7ω | −19831.607 | 347 | ω_αE stem = 0.097 | NA | 4ω vs. 7ω |
| ω_αE crown = 0.128 | Not Significant | ||||
| ω_αD stem = 0.483 | |||||
| ω_αD crown = 0.280 | |||||
| ω_αA stem = 0.152 | |||||
| ω_αA crown = 0.239 | |||||
| ω_other branches = 0.159 | |||||
Table 2.
Maximum-Likelihood Analysis of the Ratio of Nonsynonymous-to-Synonymous Substitution Rates, ω (=dN/dS), in the β-Type Globin Genes of Birds.
| Models | ln L | No. Parameters | Parameter Estimates | Candidate Sites for Positive Selection | Test |
|---|---|---|---|---|---|
| Site models | |||||
| M0 | −13679.145 | 313 | ω0 = 0.102 | NA | |
| M1a | −13223.916 | 314 | ω0 = 0.070 (p0 = 0.905) | NA | |
| ω1 = 1.000 (p1 = 0.095) | |||||
| M2 | −13221.227 | 316 | ω0 = 0.071 (p0 = 0.905) | 4 S (ω = 1.89, P = 0.927) | M2 vs. M1 |
| ω1 = 1.000 (p1 = 0.079) | 43 A (ω = 1.28, P = 0.553) | Not significant | |||
| ω2 = 1.69 (p2 = 0.016) | 55 I (ω = 1.35, P = 0.675) | ||||
| M3 | −13018.598 | 317 | ω0 = 0.022 (p0 = 0.608) | M3 vs. M0 | |
| ω1 = 0.153 (p1 = 0.304) | P << 10−3 | ||||
| ω2 = 0.697 (p2 = 0.088) | |||||
| Branch models | |||||
| 1ω | −13679.145 | 313 | ω0 = 0.103 | NA | |
| 3ω | −13659.727 | 316 | ω0 = 0.192 | NA | 1ω vs. 3ω |
| ω_ρ = ω_ε = 0.084 | P << 0.001 | ||||
| ω_βH = ω_βA = 0.100 | |||||
| 5ω | −13659.190 | 318 | ω0 = 0.192 | 3ω vs. 5ω | |
| ω_ρ = 0.082 | Not significant | ||||
| ω_ε = 0.086 | |||||
| ω_βH = 0.106 | |||||
| ω_βA = 0.094 | |||||
| 9ω | − 13653.580 | 322 | ω0 = 0.188 | 5ω vs. 9ω | |
| ω_ρ stem = 0.244 | P < 0.05 | ||||
| ω_ε stem = 999 | |||||
| ω_βH stem = 0.575 | 3ω vs 9ω | ||||
| ω_βA stem = 361 | Not significant | ||||
| ω_ρ crown = 0.080 | |||||
| ω_ε crown = 0.083 | |||||
| ω_βH crown = 0.093 | |||||
| ω_βA crown = 0.105 | |||||
| Site models—βA-globin | |||||
| M0 | −4248.522 | 123 | ω0 = 0.979 | ||
| M1 | −4117.445 | 124 | ω0 = 0.053 (p0 = 0.877) | ||
| ω1 = 1.000 (p1 = 0.123) | |||||
| M2 | −4113.220 | 126 | ω0 = 0.055 (p0 = 0.876) | 4 T (ω = 3.414, P = 0.954) | M2 vs. M1 |
| ω1 = 1.000 (p1 = 0.109) | 55 L (ω = 3.251, P = 0.952) | P < 0.05 | |||
| ω2 = 3.149 (p2 = 0.014) | |||||
| M3 | −4072.267 | 127 | ω0 = 0.022 (p0 = 0.752) | ||
| ω1 = 0.316 (p1 = 0.226) | |||||
| ω2 = 2.080 (p2 = 0.021) | |||||
Tests of Positive Selection
Likelihood ratio tests (LRTs) revealed significant variation in ω-values among sites in the alignments of each of the avian α-type paralogs (table 1), and results of Bayes empirical Bayes (BEB) analyses suggested evidence for a history of positive selection at several sites, as indicated by site-specific ω-values greater than 1.0 (table 1). Statistical evidence for positive selection at αA64 and αA115 is especially intriguing in light of evidence from site-directed mutagenesis experiments that charge-changing mutations at both sites produce significant changes in the O2 affinity of mouse Hb (Natarajan et al. 2013). LRTs also revealed significant variation in ω-values among sites in the alignment of avian βA-globin sequences, and results of the BEB analysis suggested evidence for a history of positive selection at two sites, β4 and β55 (table 2). Statistical evidence for positive selection at both sites is intriguing in light of evidence from protein-engineering experiments. Site-directed mutagenesis experiments involving mammalian Hbs have documented affinity-altering effects of substitutions at β4 and the adjacent β5 residue position that perturb the secondary structure of the β-chain A-helix (Fronticelli et al. 1995; Tufts et al. 2015). Likewise, site-directed mutagenesis experiments involving recombinant human Hb have documented affinity-enhancing effects of substitutions at β55 that eliminate intradimer (α1β1) atomic contacts (Jessen et al. 1991; Weber et al. 1993). Protein-engineering experiments involving recombinant avian Hbs are needed to probe the functional effects of amino acid substitutions at each of these candidate sites for positive selection.
Physiological Implications
Due to the fact that the HbD isoform (which incorporates products of αD-globin) has a consistently higher O2-affinity than HbA (which incorporates products of αA-globin; [Grispo et al. 2012]), repeated inactivations of the αD-globin gene can be expected to contribute to among-species variation in blood-O2 affinity. To evaluate the phenotypic consequences of αD-globin inactivation in definitive erythrocytes, we compiled standardized data on the oxygenation properties of purified HbA and HbD isoforms from 11 bird species (Grispo et al. 2012; Projecto-Garcia et al. 2013; Cheviron et al. 2014; table 3). In all 11 species, HbD exhibited higher O2-affinity in the presence of allosteric modulators of Hb-O2 affinity: Cl− ions (added as 0.1 M KCl) and inositol hexaphosphate (IHP [a chemical analog of inositol pentaphosphate that is endogenously produced in avian red blood cells], present at saturating or near-saturating concentrations). We compiled in vitro measurements of O2-affinity on purified HbA and HbD isoforms under the same “KCl+IHP” treatment, and we calculated the expected O2-affinity of the composite mixture of HbA and HbD using a weighted average of isoform-specific P50 values (the partial pressure of O2 at which heme is 50% saturated) based on the naturally occurring relative concentrations of the two Hb isoforms in each species. The assumption that the avian HbA and HbD isoforms have additive effects on blood-O2 affinity is validated by experimental studies on the oxygenation properties of isolated isoforms and composite hemolystes (Weber et al. 2004; Grispo et al. 2012). We calculated the expected increase in blood P50 (i.e., reduction in blood-O2 affinity) caused by the complete loss of HbD expression by comparing the predicted P50 of the HbA+HbD composite mixture and the measured P50 of HbA in isolation. Although the P50 of a composite “HbA+HbD” hemolysate is not expected to be identical to the P50 of whole blood (Berenbrink 2006), the loss of HbD expression should produce a commensurate increase in P50 in both cases.
Table 3.
O2 Affinities (P50, torr) and Cooperativity Coefficients (n50) of Purified HbA and HbD Isoforms from 11 Bird Species.
| Species | Hb Isoform | Abundance (%) | P50(KCl+IHP) (torr) | n50 |
|---|---|---|---|---|
| Accipitriformes | ||||
| Griffon vulture, Gyps fulvus | HbA | 66 | 28.84 | 1.98 |
| HbD | 34 | 26.61 | 1.99 | |
| HbA+HbD | 28.08 | 1.98 | ||
| Anseriformes | ||||
| Graylag goose, Anser anser | HbA | 92 | 43.95a | 3.00a |
| HbD | 8 | 29.79a | 2.51a | |
| HbA+HbD | 42.68 | 2.96 | ||
| Apodiformes | ||||
| Amazilia hummingbird, Amazilia amazilia | HbA | 88 | 29.84 | 2.42 |
| HbD | 12 | 23.20 | 2.40 | |
| HbA+HbD | 29.04 | 2.42 | ||
| Green-and-white hummingbird, Amazilia viridicauda | HbA | 89 | 24.24 | 2.07 |
| HbD | 11 | 20.36 | 2.29 | |
| HbA+HbD | 23.81 | 2.09 | ||
| Violet-throated starfrontlet, Coeligena violifer | HbA | 88 | 19.12 | 1.70 |
| HbD | 12 | 17.01 | 2.46 | |
| HbA+HbD | 18.87 | 1.79 | ||
| Giant hummingbird, Patagona gigas | HbA | 78 | 25.86 | 2.49 |
| HbD | 22 | 16.56 | 2.56 | |
| HbA+HbD | 23.81 | 2.51 | ||
| Great-billed hermit, Phaethornis malaris | HbA | 76 | 28.13 | 2.04 |
| HbD | 24 | 24.92 | 2.72 | |
| HbA+HbD | 27.36 | 2.20 | ||
| Galliformes | ||||
| Ring-necked pheasant, Phasianus colchicus | HbA | 54 | 29.51 | 2.55 |
| HbD | 46 | 24.24a | 2.46a | |
| HbA+HbD | 27.09 | 2.51 | ||
| Passeriformes | ||||
| House wren, Troglodytes aedon | HbA | 64 | 25.87 | 2.11 |
| HbD | 36 | 16.28 | 2.36 | |
| HbA+HbD | 22.42 | 2.20 | ||
| Rufous-collared sparrow, Zonotrichia capensis | HbA | 67 | 38.13 | 2.29 |
| HbD | 33 | 20.49 | 2.40 | |
| HbA+HbD | 32.31 | 2.32 | ||
| Struthioformes | ||||
| Ostrich, Struthio camelus | HbA | 79 | 32.73a | 2.85 |
| HbD | 21 | 22.90a | 2.44 | |
| HbA+HbD | 30.67 | 2.76 | ||
Note.—O2 equilibria were measured in 0.1 mM HEPES buffer at pH 7.4 (± 0.01) and 37 °C in the presence of allosteric effectors ([Cl−], 0.1 M; [HEPES], 0.1 M; IHP/Hb tetramer ratio, 2.0 or >20, as indicated; [heme], 0.30–1.00 mM (for details of experimental conditions, see Grispo et al. [37], Projecto-Garcia et al. [80], and Cheviron et al. [81]). P50 and n50 values were derived from single O2 equilibrium curves, where each value was interpolated from linear Hill plots (correlation coefficient r > 0.995) based on four or more equilibrium steps between 25% and 75% saturation. The reported P50 for the HbA+HbD composite hemolysate is the weighted mean P50 of both isoforms in their naturally occurring relative concentrations.
aSaturating IHP/Hb4 ratio (>20).
In hummingbirds, which typically have very low HbD expression (table 2 and fig. 5, supplementary table S3, Supplementary Material online), loss of HbD is predicted to produce a modest increase in blood P50, ranging from +1.3 % for the violet-throated starfrontlet, Coeligena violifer, to +8.6% for the giant hummingbird, Patagona gigas. In contrast, in passerines (which typically have much higher HbD expression levels; table 2 and fig. 5, supplementary table S3, Supplementary Material online), the predicted increase in blood P50 was +15.4% for house wren, Troglodytes aedon, and +18.0% for rufous-collared sparrow, Zonotrichia capensis. The calculations for passerines provide an indication of the magnitude of change in blood-O2 affinity that must have accompanied the quantitative reduction or whole-sale loss of HbD expression in other avian lineages (fig. 5). These results illustrate the potentially dramatic physiological consequences of inactivating the αD-globin gene. Because HbD is also expressed at high levels during prenatal development (Cirotto et al. 1987; Alev et al. 2008, 2009), inactivation or deletion of αD-globin could affect O2-delivery to the developing embryo. Intriguingly, representatives of several taxa (families Cuculidae [cuckoos] and Columbidae [pigeons and doves] and the superfamily Psittacoidea [parrots]) do not appear to express HbD during postnatal life (fig. 5, supplementary table S3, Supplementary Material online), but they have retained αD-globin genes with intact reading frames. In such taxa, HbD may still be expressed during embryonic development, as documented in domestic pigeon (Ikehara et al. 1997).
Conclusions
Our results indicate that recurrent deletions and inactivations of the αD-globin gene entailed significant reductions in blood-O2 affinity in numerous avian lineages—changes that may have been compensated by functional changes in the remaining pre- or postnatally expressed globins. These results provide a concrete example of evolutionary changes in a physiologically important phenotype that were caused by recurrent gene losses.
In mammals, evolutionary changes in globin gene content have given rise to variation in the functional diversity of Hb isoforms that are expressed at different stages of prenatal development (Opazo et al. 2008a, 2008b). For example, duplicate copies of different β-type globin genes have been independently co-opted for fetal expression in anthropoid primates and artiodactyls (Storz, Opazo, et al. 2011; Storz et al. 2013), which demonstrates how gene duplication may provide increased scope for evolutionary innovation because redundant gene copies are able to take on new functions or divide up ancestral functions. In birds, the relative stasis in globin gene family evolution suggests that the developmental regulation of Hb synthesis may be more highly conserved, with orthologous genes having similar stage-specific expression profiles and carrying out similar functions in disparate taxa. In comparison with the globin gene clusters of mammals and squamate reptiles, the general absence of redundant gene duplicates in the avian gene clusters suggests less opportunity for the divergence of paralogs to facilitate the acquisition of novel protein functions and/or expression patterns.
Materials and Methods
Analysis of Globin Gene Family Evolution
The 52 avian genome assemblies that we analyzed were derived from multiple sources (Hillier et al. 2004; Dalloul et al. 2010; Huang et al. 2013; Zhan et al. 2013; Jarvis et al. 2014; Zhang et al. 2014). Details regarding all examined genome assemblies and scaffolds are provided in supplementary table S1, Supplementary Material online. We identified contigs containing α- and β-globin genes in the genome assembly of each species by using BLAST (Altschul et al. 1990) to make comparisons with the α- and β-globin genes of chicken. We then annotated globin genes within the identified gene clusters of each species by using GENSCAN (Burge and Karlin 1997) in combination with BLAST2 (Tatusova and Madden 1999) to make comparisons with known exon sequences, following Hoffmann et al. (Hoffmann, Storz, et al. 2010; Hoffmann et al. 2011). Due to incomplete sequence coverage in the genome assemblies of several species, there were some cases where it was not possible to ascertain the full extent of conserved synteny.
To estimate rates of gene turnover in the globin gene clusters of birds and mammals, we used a stochastic birth–death model of gene family evolution (Hahn et al. 2005), as implemented in the program CAFE v3.1 (Han et al. 2013). As input for the program we used ultrametric trees based on well-resolved phylogenies of birds (Jarvis et al. 2014) and eutherian mammals (Meredith et al. 2011). The analysis was based on data for 24 bird species for which we had complete sequence coverage of the α- and β-globin gene clusters. For comparison, we used genome sequence assemblies for 22 mammal species representing each of the major eutherian lineages, as reported in Zhang et al. (2014). These sets of birds and eutherian mammals span a similar range of divergence times, and therefore provide a good basis for comparing lineage-specific rates of gene family evolution.
Sample Collection
We preserved blood and tissue samples from 250 voucher specimens representing 68 bird species that were collected from numerous localities in South America (supplementary table S4, Supplementary Material online). In addition to the 250 wild-caught, museum-vouchered specimens, we also obtained blood samples from captive individuals representing 17 species. Our proteomic analysis of Hb isoform composition was based on blood samples from a total of 267 specimens (see below).
All wild-caught birds were captured in mist-nets and were then bled and euthanized in accordance with guidelines of the Ornithological Council (Fair and Paul 2010), and protocols approved by the University of New Mexico IACUC (Protocol number 08UNM033-TR-100117; Animal Welfare Assurance number A4023-01). Acquisition and study of Peruvian samples was carried out under permits issued by the management authorities of Peru (76-2006-INRENA-IFFS-DCB, 087-2007-INRENA-IFFS-DCB, 135-2009-AG-DGFFS-DGEFFS, 0199-2012-AG-DGFFS-DGEFFS, and 006-2013-MINAGRI-DGFFS/DGEFFS). For each individual bird, we collected whole blood from the brachial or ulnar vein using heparinized microcapillary tubes. Red blood cells were separated from the plasma fraction by centrifugation, and the packed red cells were then snap-frozen in liquid nitrogen and were stored at −80 °C. We collected liver and pectoral muscle from each specimen as sources of genomic DNA and globin mRNA, respectively. Muscle samples were snap-frozen or preserved using RNAlater and were subsequently stored at −80 °C prior to RNA isolation. Voucher specimens were preserved along with ancillary data and were deposited in the collections of the Museum of Southwestern Biology of the University of New Mexico and the Centro de Ornitología y Biodiversidad (CORBIDI), Lima, Peru. Complete specimen data are available via the ARCTOS online database (supplementary table S4, Supplementary Material online).
Molecular Cloning and Sequencing
To augment the set of globin sequences derived from the genome assemblies and other public databases, we cloned and sequenced the adult globin genes (αA-, αD-, and βA-globin) from 34 additional bird species. We used the RNeasy Mini Kit (Qiagen, Valencia, CA) to isolate total RNA from blood or pectoral muscle. Using a few representative species from each order, we used 5′- and 3′-RACE (rapid amplification of cDNA ends [Invitrogen Life Technologies, Carlsbad, CA]) to obtain cDNA sequence for the 5′- and 3′- untranslated regions (UTRs) of each adult-expressed globin gene. We then aligned the 5′- and 3′-UTRs of each sequenced gene and designed paralog-specific primers. This strategy enabled us to obtain complete cDNA sequences for each globin paralog using the OneStep RT-PCR kit (Qiagen, Valencia, CA). We cloned gel-purified RT-PCR products into pCR4-TOPO vector using the TOPO TA Cloning Kit (Invitrogen Life Technologies, Grand Island, NY), and we then sequenced at least 4–6 colonies per individual. All sequences were deposited in GenBank under the accession numbers KM522867–KM522916.
Phylogenetic Analysis and Assignment of Orthologous Relationships
We used phylogenetic reconstructions to resolve orthology for all annotated globin genes, including truncated sequences. The α- and β-type globin sequences were aligned separately and, when possible, amino acid sequence alignments were based on conceptual translations of nucleotide sequence. All alignments were performed using the L-INS-i strategy from MAFFT v. 6.8 (Katoh and Toh 2008), and phylogenies were estimated using both maximum-likelihood and Bayesian approaches. We used Treefinder (v. March 2011; [Jobb et al. 2004]) for the maximum-likelihood analyses, and MrBayes (Ronquist and Huelsenbeck 2003) for Bayesian estimates of each phylogeny. In the maximum-likelihood analyses, we used the “propose model” routine of Treefinder to select the best-fitting models of nucleotide substitution, with an independent model for each codon position in analyses based on nucleotide sequences. Model selection was based on the Akaike information criterion with correction for small sample size. In the case of MrBayes, we ran six simultaneous chains for 2 × 10⁷ generations, sampling every 2.5 × 10³ generations, using default priors. A given run was considered to have reached convergence once the likelihood scores reached an asymptotic value and the average standard deviation of split frequencies remained less than 0.01. We discarded all trees that were sampled prior to convergence, and we evaluated support for the nodes and parameter estimates from a majority rule consensus of the last 2,500 trees.
For the β-type globin genes, we analyzed four separate sets of sequences: 1) an inclusive data set that included all genes, apparent pseudogenes, and truncated sequences (containing at least one full-length exon) that were derived from the genome assemblies, 2) a data set restricted to genes with full-length coding sequences and intact reading frames, and 3) the set of full-length coding sequences plus 34 βA-globin cDNA sequences from avian taxa that do not currently have fully sequenced genomes. We used each of these data sets to perform likelihood-based topology tests (Shimodaira 2002).
For the β-type globin genes, we inferred orthologous relationships by using an approach that combined the “orthology-by-content” and “orthology-by-context” criteria (Song et al. 2011, 2012). We applied the orthology-by-content criterion to assign genes to the βH, βA, or ρ+ε groups (based on phylogenetic relationships), and we then used the orthology-by-context criterion to assign genes in the latter group as ρ- or ε-globin (based on positional homology).
Molecular Evolution Analysis
To measure variation in functional constraint among the avian α- and β-type globin genes and to test for evidence of positive selection, we estimated ω (=dN/dS, the ratio of the rate of nonsynonymous substitution per nonsynonymous site [dN] to the rate of synonymous substitution per synonymous site [dS] site) using a maximum-likelihood approach (Goldman and Yang 1994) implemented in the CODEML program, v. 4.8 (Yang 2007). In all cases, we used LRTs to compare nested sets of models (Yang 1998). For each alignment, we first compared models that allow ω to vary among codons (M0 vs. M3, M1a vs. M2a). The latter LRT constitutes a test of positive selection, as the alternative model (M2a) allows a subset of sites to have ω > 1, in contrast to the null model (M1a) that only includes site classes with ω < 1. These analyses revealed statistically significant variation in ω among sites in the alignment of βA-globin sequences (table 2), so we then used the BEB approach (Yang et al. 2005) to calculate the posterior probability that a given site belongs to the site class with ω > 1, which suggests a possible history of positive selection.
Characterizing Hb Isoform Composition of Avian Red Blood Cells
We used isoelectric focusing (IEF; PhastSystem, GE Healthcare Bio-Sciences, Piscataway, NJ) to characterize Hb isoform composition in red cell lysates from each of the 267 bird specimens representing 68 species (n = 1–30 individuals per species). After separating native Hbs using precast IEF gels (pH 3–9), red (heme-containing) bands were excised from the gel and digested with trypsin. The resultant peptides were then identified by means of tandem mass spectrometry (MS/MS). Database searches of the resultant MS/MS spectra were performed using Mascot (Matrix Science, v1.9.0, London, UK), whereby peptide mass fingerprints were used to query a custom database of avian α- and β-chain sequences. After separating the HbA and HbD isoforms by native gel IEF and identifying each of the constituent subunits by MS/MS, the relative abundance of the different isoforms in the hemolysates of each individual was quantified densitometrically using Image J (Abramoff et al. 2004).
Supertree Construction
We constructed a time-calibrated supertree of all study species by starting with a backbone provided by a dated, total-evidence phylogeny from Jarvis et al. (2014). This phylogeny was based on nucleotide sequence data derived from 48 whole avian genomes and 19 fossil calibrations. Using recent avian taxonomic classifications, we were able to unambiguously assign each study species to its appropriate branch in the Jarvis et al. (2014) backbone tree. Subtrees for each branch were obtained from the dated supertree of Jetz et al. (2012), which was constructed using the Hackett et al. (2008) backbone. Divergence times in trees from Jetz et al. tended to be older than the ones from Jarvis et al. (2014); we resolved topological or branch-length conflicts by favoring the Jarvis et al. (2014) tree because it was based on far more sequence data. Before grafting time-calibrated subtrees onto the backbone, we uniformly rescaled the subtree branchlengths so that shared nodes were the same age as they were in the backbone (following Sibly et al. 2012).
Comparative Analysis of HbA/HbD Expression Levels
For the comparative analysis of HbA/HbD expression levels, we combined our experimental data for 68 species with published data for an additional 54 species (supplementary table S3, Supplementary Material online), yielding data for a phylogenetically diverse set of 122 species in total. We used the final supertree to conduct comparative analyses under a Brownian motion model of evolution in R v. 2.15.1. Maximum-likelihood estimates of ancestral states for percent expression of HbD were generated using APE (Paradis et al. 2004). Phylogenetic inertia in expression level (percent) of HbD was quantified using Blomberg’s K (Blomberg et al. 2003) and Pagel’s Lambda (Pagel 1999), calculated using GEIGER (Harmon et al. 2008). We compiled body mass data for each species from Museum of Southwestern Biology specimens and Dunning (Dunning 2008), and we tested for an association between body mass and expression level of HbD using a phylogenetic generalized least-squares model as implemented in APE (Paradis et al. 2004). We log-transformed body mass and arcsin-squareroot-transformed HbD percent prior to all analyses.
Supplementary Material
Supplementary figure 1 and tables S1–S4 are available at Molecular Biology and Evolution online (http://www.mbe.oxfordjournals.org/).
Acknowledgments
The authors thank T. Valqui, E. Bautista, and the students and staff of the MSB Bird Division and CORBIDI for assistance with field collections. The authors also thank E. D. Jarvis, M. T. P. Gilbert, and G. Zhang for sharing genomic sequence data, F. B. Jensen and M. F. Bertelsen for providing blood samples of select species, H. Moriyama and K. Williams for assistance with the protein expression experiments, and J. Fjeldså for providing the bird illustrations. They also thank E. D. Jarvis and two anonymous reviewers for helpful comments and suggestions. This work was funded by grants from the National Institutes of Health/National Heart, Lung, and Blood Institute to J.F.S. (R01 HL087216 and HL087216-S1); grants from the National Science Foundation to J.F.S. (IOS-0949931), F.G.H. (EPS-0903787), and C.C.W. (DEB-1146491); a grant from the Biotechnology and Biological Sciences Research Council to M.B. (BB/D012732/1); and a grant from Fondo Nacional de Desarrollo Cientifico y Tecnológico to J.C.O. (FONDECYT 1120032).
References
- Abramoff MD, Magelhaes PJ, Ram SJ. Image processing with image. J Biophoton Int. 2004;11:36–42. [Google Scholar]
- Alev C, McIntyre BAS, Nagai H, Shin M, Shinmyozu K, Jakt LM, Sheng G. βA, the major β-globin in definitive red blood cells, is present from the onset of primitive erythropoiesis in chicken. Dev Dyn. 2008;237:1193–1197. doi: 10.1002/dvdy.21510. [DOI] [PubMed] [Google Scholar]
- Alev C, Shinmyozu K, McIntyre BAS, Sheng G. Genomic organization of zebra finch α and β globin genes and their expression in primitive and definitive blood in comparison with globins in chicken. Dev Genes Evol. 2009;219:353–360. doi: 10.1007/s00427-009-0294-8. [DOI] [PubMed] [Google Scholar]
- Altschul SF, Gish W, Miller W, Myers EW, Lipman DJ. Basic local alignment search tool. J Mol Biol. 1990;215:403–410. doi: 10.1016/S0022-2836(05)80360-2. [DOI] [PubMed] [Google Scholar]
- Backstrom N, Karaiskou N, Leder EH, Gustafsson L, Primmer CR, Qvarnstrom A, Ellegren H. A gene-based genetic linkage map of the collared flycatcher (Ficedula albicollis) reveals extensive synteny and gene-order conservation during 100 million years of avian evolution. Genetics. 2008;179:1479–1495. doi: 10.1534/genetics.108.088195. [DOI] [PMC free article] [PubMed] [Google Scholar]
- Baumann FH, Baumann HR. A comparative study of oxygen transport in bird blood. Respir Physiol. 1977;31:333–343. doi: 10.1016/0034-5687(77)90076-7. [DOI] [PubMed] [Google Scholar]
- Berenbrink M. Evolution of vertebrate haemoglobins: histidine side chains, specific buffer value and Bohr effect. Respir Physiol Neurobiol. 2006;154:165–184. doi: 10.1016/j.resp.2006.01.002. [DOI] [PubMed] [Google Scholar]
- Berenbrink M. Historical reconstructions of evolving physiological complexity: O2 secretion in the eye and swimbladder of fishes. J Exp Biol. 2007;210:1641–1652. doi: 10.1242/jeb.003319. [DOI] [PubMed] [Google Scholar]
- Berenbrink M, Koldkjaer P, Kepp O, Cossins AR. Evolution of oxygen secretion in fishes and the emergence of a complex physiological system. Science. 2005;307:1752–1757. doi: 10.1126/science.1107793. [DOI] [PubMed] [Google Scholar]
- Blank M, Kiger L, Thielebein A, Gerlach F, Hankeln T, Marden MC, Burmester T. Oxygen supply from the bird's eye perspective: globin E is a respiratory protein in the chicken retina. J Biol Chem. 2011;286:26507–26515. doi: 10.1074/jbc.M111.224634. [DOI] [PMC free article] [PubMed] [Google Scholar]
- Blomberg SP, Garland T, Ives AR. Testing for phylogenetic signal in comparative data: behavioral traits are more labile. Evolution. 2003;57:717–745. doi: 10.1111/j.0014-3820.2003.tb00285.x. [DOI] [PubMed] [Google Scholar]
- Bunn HF. Regulation of hemoglobin-function in mammals. Am Zool. 1980;20:199–211. [Google Scholar]
- Bunn HF. Subunit assembly of hemoglobin: an important determinant of hematologic phenotype. Blood. 1987;69:1–6. [PubMed] [Google Scholar]
- Bunn HF, McDonald MJ. Electrostatic interactions in the assembly of haemoglobin. Nature. 1983;306:498–500. doi: 10.1038/306498a0. [DOI] [PubMed] [Google Scholar]
- Burge C, Karlin S. Prediction of complete gene structures in human genomic DNA. J Mol Biol. 1997;268:78–94. doi: 10.1006/jmbi.1997.0951. [DOI] [PubMed] [Google Scholar]
- Burmester T, Hankeln T. Function and evolution of vertebrate globins. Acta Physiol. 2014;211:501–514. doi: 10.1111/apha.12312. [DOI] [PubMed] [Google Scholar]
- Burt DW, Bruley C, Dunn IC, Jones CT, Ramage A, Law AS, Morrice DR, Paton IR, Smith J, Windsor D, et al. The dynamics of chromosome evolution in birds and mammals. Nature. 1999;402:411–413. doi: 10.1038/46555. [DOI] [PubMed] [Google Scholar]
- Cheviron ZA, Natarajan C, Projecto-Garcia J, Eddy DK, Jones J, Carling MD, Witt CC, Moriyama H, Weber RE, Fago A, et al. Integrating evolutionary and functional tests of adaptive hypotheses: a case study of altitudinal differentiation in hemoglobin function in an Andean sparrow, Zonotrichia capensis. Mol Biol Evol. 2014;31:2948–2962. doi: 10.1093/molbev/msu234. [DOI] [PMC free article] [PubMed] [Google Scholar]
- Cirotto C, Panara F, Arangi I. The minor hemoglobins of primitive and definitive erythrocytes of the chicken embryo—evidence for Hemoglobin-L. Development. 1987;101:805–813. doi: 10.1242/dev.101.4.805. [DOI] [PubMed] [Google Scholar]
- Cobb JA, Manning D, Kolatkar PR, Cox DJ, Riggs AF. Deoxygenation-linked association of a tetrameric component of chicken hemoglobin. J Biol Chem. 1992;267:1183–1189. [PubMed] [Google Scholar]
- Cooper SJB, Wheeler D, De Leo A, Cheng JF, Holland RAB, Graves JAM, Hope RM. The mammalian αD-globin gene lineage and a new model for the molecular evolution of α-globin gene clusters at the stem of the mammalian radiation. Mol Phylogenet Evol. 2006;38:439–448. doi: 10.1016/j.ympev.2005.05.014. [DOI] [PubMed] [Google Scholar]
- Dalloul RA, Long JA, Zimin AV, Aslam L, Beal K, Blomberg LA, Bouffard P, Burt DW, Crasta O, Crooijmans RPMA, et al. Multi-platform next-generation sequencing of the domestic turkey (Meleagris gallopavo): genome assembly and analysis. PLoS Biol. 2010;8(9):e1000475. doi: 10.1371/journal.pbio.1000475. [DOI] [PMC free article] [PubMed] [Google Scholar]
- Damsgaard C, Storz JF, Hoffmann FG, Fago A. Hemoglobin isoform differentiation and allosteric regulation of oxygen binding in the turtle, Trachemys scripta. Am J Physiol Regul Integr Comp Physiol. 2013;305:R961–R967. doi: 10.1152/ajpregu.00284.2013. [DOI] [PMC free article] [PubMed] [Google Scholar]
- Derjusheva S, Kurganova A, Habermann F, Gaginskaya E. High chromosome conservation detected by comparative chromosome painting in chicken, pigeon and passerine birds. Chromosome Res. 2004;12:715–723. doi: 10.1023/B:CHRO.0000045779.50641.00. [DOI] [PubMed] [Google Scholar]
- Dunning JBJ. Boca Raton (FL): CRC Press; 2008. CRC Handbook of avian body masses. [Google Scholar]
- Ellegren H. The evolutionary genomics of birds. Ann Rev Ecol Evol Syst. 2013;44:239–259. [Google Scholar]
- Ellegren H. Evolutionary stasis: the stable chromosomes of birds. Trends Ecol Evol. 2010;25:283–291. doi: 10.1016/j.tree.2009.12.004. [DOI] [PubMed] [Google Scholar]
- Fair JM, Paul E. Washington (DC): Ornithological Council; 2010. Guidelines to the use of wild birds in research. [Google Scholar]
- Fronticelli C, Teresa Sana M, Perez-Alvarado GC, Karavitis M, Lu A-L, Brinigar WS. Allosteric modulation by tertiary structure in mammalian Hbs. J. Biol Chem. 1995;270:30588–30592. doi: 10.1074/jbc.270.51.30588. [DOI] [PubMed] [Google Scholar]
- Fuchs C, Burmester T, Hankeln T. The amphibian globin gene repertoire as revealed by the Xenopus genome. Cytogenet Genome Res. 2006;112:296–306. doi: 10.1159/000089884. [DOI] [PubMed] [Google Scholar]
- Garland T, Bennett AF, Rezende EL. Phylogenetic approaches in comparative physiology. J Exp Biol. 2005;208:3015–3035. doi: 10.1242/jeb.01745. [DOI] [PubMed] [Google Scholar]
- Gaudry MJ, Storz JF, Butts GT, Campbell KL, Hoffman FG. Repeated evolution of chimeric fusion genes in the β-globin gene family of laurasiatherian mammals. Genome Biol Evol. 2014;6:1219–1233. doi: 10.1093/gbe/evu097. [DOI] [PMC free article] [PubMed] [Google Scholar]
- Gillemans N, McMorrow T, Tewari R, Wai AWK, Burgtorf C, Drabek D, Ventress N, Langeveld A, Higgs D, Tan-Un K, et al. Functional and comparative analysis of globin loci in pufferfish and humans. Blood. 2003;101:2842–2849. doi: 10.1182/blood-2002-09-2850. [DOI] [PubMed] [Google Scholar]
- Goh SH, Lee YT, Bhanu NV, Cam MC, Desper R, Martin BM, Moharram R, Gherman RB, Miller JL. A newly discovered human α-globin gene. Blood. 2005;106:1466–1472. doi: 10.1182/blood-2005-03-0948. [DOI] [PMC free article] [PubMed] [Google Scholar]
- Goldman N, Yang ZH. Codon-based model of nucleotide substitution for protein-coding DNA sequences. Mol Biol Evol. 1994;11:725–736. doi: 10.1093/oxfordjournals.molbev.a040153. [DOI] [PubMed] [Google Scholar]
- Goodman M. Man's place in the phylogeny of the primates as reflected in serum proteins. In: Washburn S, editor. Classification and human evolution. Chicago (IL): Viking Fund Publications; 1963. pp. 204–230. [Google Scholar]
- Griffin DK, Robertson LB, Tempest HG, Vignal A, Fillon V, Crooijmans RPMA, Groenen MAM, Deryusheva S, Gaginskaya E, Carre W, et al. Whole genome comparative studies between chicken and turkey and their implications for avian genome evolution. BMC Genomics. 2008;9:168. doi: 10.1186/1471-2164-9-168. [DOI] [PMC free article] [PubMed] [Google Scholar]
- Green RE, Braun EL, Armstrong J, Earl D, Nguyen N, Hickey G, Vandewege MW, St John JA, Capella-Gutiérrez S, Castoe TA, et al. Three crocodilian genomes reveal ancestral patterns of evolution among archosaurs. Science. 2014;346:1335. doi: 10.1126/science.1254449. [DOI] [PMC free article] [PubMed] [Google Scholar]
- Griffin DK, Robertson LBW, Tempest HG, Skinner BM. The evolution of the avian genome as revealed by comparative molecular cytogenetics. Cytogenet Genome Res. 2007;117:64–77. doi: 10.1159/000103166. [DOI] [PubMed] [Google Scholar]
- Grigg GC, Wells RMG, Beard LA. Allosteric control of oxygen binding by hemoglobin during embryonic development in the crocodile Crocodylus porosus—the role of red-cell organic phosphates and carbon dioxide. J Exp Biol. 1993;175:15–32. [Google Scholar]
- Grispo MT, Natarajan C, Projecto-Garcia J, Moriyama H, Weber RE, Storz JF. Gene duplication and the evolution of hemoglobin isoform differentiation in birds. J Biol Chem. 2012;287:37647–37658. doi: 10.1074/jbc.M112.375600. [DOI] [PMC free article] [PubMed] [Google Scholar]
- Hackett SJ, Kimball RT, Reddy S, Bowie RCK, Braun EL, Braun MJ, Chojnowski JL, Cox WA, Han K-L, Harshman J, et al. A phylogenomic study of birds reveals their evolutionary history. Science. 2008;320:1763–1768. doi: 10.1126/science.1157704. [DOI] [PubMed] [Google Scholar]
- Hahn MW, De Bie T, Stajich JE, Nguyen C, Cristianini N. Estimating the tempo and mode of gene family evolution from comparative genomic data. Genome Res. 2005;15:1153–1160. doi: 10.1101/gr.3567505. [DOI] [PMC free article] [PubMed] [Google Scholar]
- Han MV, Thomas GWC, Lugo-Martinez J, Hahn MW. Estimating gene gain and loss rates in the presence of genome assembly and annotation error using CAFE 3. Mol Biol Evol. 2013;30:1987–1997. doi: 10.1093/molbev/mst100. [DOI] [PubMed] [Google Scholar]
- Hardison RC. Organization, evolution and regulation of the globin genes. In: Steinberg MH, Forget BG, Higgs DR, Nagel RL, editors. Disorders of hemoglobin: genetics, pathophysiology and clinical management. Cambridge: Cambridge University Press; 2001. pp. 95–115. [Google Scholar]
- Hardison RC. Globin genes on the move. J Biol. 2008;7:35. doi: 10.1186/jbiol92. [DOI] [PMC free article] [PubMed] [Google Scholar]
- Hardison RC. Evolution of hemoglobin and its genes. Cold Spring Harb Perspect Med. 2012;2:a011627. doi: 10.1101/cshperspect.a011627. [DOI] [PMC free article] [PubMed] [Google Scholar]
- Harmon LJ, Weir JT, Brock CD, Glor RE, Challenger W. GEIGER:investigating evolutionary radiations. Bioinformatics. 2008;24:129–131. doi: 10.1093/bioinformatics/btm538. [DOI] [PubMed] [Google Scholar]
- Hiebl I, Weber RE, Schneeganss D, Kosters J, Braunitzer G. High-altitude respiration of birds—structural adaptations in the major and minor hemoglobin components of adult Ruppells griffon (Gryps rueppellii)—a new molecular pattern for hypoxia tolerance. Biol Chem Hoppe-Seyler. 1988;369:217–232. doi: 10.1515/bchm3.1988.369.1.217. [DOI] [PubMed] [Google Scholar]
- Hillier LW, Miller W, Birney E, Warren W, Hardison RC, Ponting CP, Bork P, Burt DW, Groenen MAM, Delany ME, et al. Sequence and comparative analysis of the chicken genome provide unique perspectives on vertebrate evolution. Nature. 2004;432:695–716. doi: 10.1038/nature03154. [DOI] [PubMed] [Google Scholar]
- Hoffmann FG, Opazo JC, Hoogewijs D, Hankeln T, Ebner B, Vinogradov SN, Bailly X, Storz JF. Evolution of the globin gene family in deuterostomes: lineage-specific patterns of diversification and attrition. Mol Biol Evol. 2012;29:1735–1745. doi: 10.1093/molbev/mss018. [DOI] [PMC free article] [PubMed] [Google Scholar]
- Hoffmann FG, Opazo JC, Storz JF. New genes originated via multiple recombinational pathways in the β-globin gene family of rodents. Mol Biol Evol. 2008a;25:2589–2600. doi: 10.1093/molbev/msn200. [DOI] [PMC free article] [PubMed] [Google Scholar]
- Hoffmann FG, Opazo JC, Storz JF. Rapid rates of lineage-specific gene duplication and deletion in the α-globin gene family. Mol Biol Evol. 2008b;25:591–602. doi: 10.1093/molbev/msn004. [DOI] [PubMed] [Google Scholar]
- Hoffmann FG, Opazo JC, Storz JF. Gene cooption and convergent evolution of oxygen transport hemoglobins in jawed and jawless vertebrates. Proc Natl Acad Sci U S A. 2010;107:14274–14279. doi: 10.1073/pnas.1006756107. [DOI] [PMC free article] [PubMed] [Google Scholar]
- Hoffmann FG, Opazo JC, Storz JF. Differential loss and retention of cytoglobin, myoglobin, and globin-E during the radiation of vertebrates. Genome Biol Evol. 2011;3:588–600. doi: 10.1093/gbe/evr055. [DOI] [PMC free article] [PubMed] [Google Scholar]
- Hoffmann FG, Opazo JC, Storz JF. Whole-genome duplications spurred the functional diversification of the globin gene superfamily in vertebrates. Mol Biol Evol. 2012;29:303–312. doi: 10.1093/molbev/msr207. [DOI] [PMC free article] [PubMed] [Google Scholar]
- Hoffmann FG, Storz JF. The αD-globin gene originated via duplication of an embryonic a-like globin gene in the ancestor of tetrapod vertebrates. Mol Biol Evol. 2007;24:1982–1990. doi: 10.1093/molbev/msm127. [DOI] [PubMed] [Google Scholar]
- Hoffmann FG, Storz JF, Gorr TA, Opazo JC. Lineage-specific patterns of functional diversification in the α- and β-globin gene families of tetrapod vertebrates. Mol Biol Evol. 2010;27:1126–1138. doi: 10.1093/molbev/msp325. [DOI] [PMC free article] [PubMed] [Google Scholar]
- Hoogewijs D, Ebner B, Germani F, Hoffmann FG, Fabrizius A, Moens L, Burmester T, Dewilde S, Storz JF, Vinogradov SN, et al. Androglobin: a chimeric globin in metazoans that is preferentially expressed in mammalian testes. Mol Biol Evol. 2012;29:1105–1114. doi: 10.1093/molbev/msr246. [DOI] [PMC free article] [PubMed] [Google Scholar]
- Hosbach HA, Wyler T, Weber R. The Xenopus laevis globin gene family—chromosomal arrangement and gene structure. Cell. 1983;32:45–53. doi: 10.1016/0092-8674(83)90495-6. [DOI] [PubMed] [Google Scholar]
- Huang Y, Li Y, Burt DW, Chen H, Zhang Y, Qian W, Kim H, Gan S, Zhao Y, Li J, et al. The duck genome and transcriptome provide insight into an avian influenza virus reservoir species. Nature Genet. 2013;45:776–783. doi: 10.1038/ng.2657. [DOI] [PMC free article] [PubMed] [Google Scholar]
- Ikehara T, Eguchi Y, Kayo S, Takei H. Isolation and sequencing of two α-globin genes α(A) and α(D) in pigeon and evidence for embryo-specific expression of the α(D)-globin gene. Biochemical and Biophys Res Commun. 1997;234:450–453. doi: 10.1006/bbrc.1997.6667. [DOI] [PubMed] [Google Scholar]
- Jarvis ED, Mirarab S, Aberer AJ, Li B, Houde P, Li C, Ho SYW, Faircloth BC, Nabholz B, Howard JT, et al. Whole genome analyses resolve early branches in the tree of life of modern birds. Science. 2014;346:1320–1331. doi: 10.1126/science.1253451. [DOI] [PMC free article] [PubMed] [Google Scholar]
- Jeffreys AJ, Wilson V, Wood D, Simons JP, Kay RM, Williams JG. Linkage of adult α-globin and β-globin genes in X laevis and gene duplication by tetraploidization. Cell. 1980;21:555–564. doi: 10.1016/0092-8674(80)90493-6. [DOI] [PubMed] [Google Scholar]
- Jessen TH, Weber RE, Fermi G, Tame J, Braunitzer G. Adaptation of bird hemoglobins to high-altitudes—demonstration of molecular mechanism by protein engineering. Proc Natl Acad Sci U S A. 1991;88:6519–6522. doi: 10.1073/pnas.88.15.6519. [DOI] [PMC free article] [PubMed] [Google Scholar]
- Jetz W, Thomas GH, Joy JB, Hartmann K, Mooers AO. The global diversity of birds in space and time. Nature. 2012;491:444–448. doi: 10.1038/nature11631. [DOI] [PubMed] [Google Scholar]
- Jobb G, von Haeseler A, Strimmer K. TREEFINDER: a powerful graphical analysis environment for molecular phylogenetics. BMC Evol Biol. 2004;4:18. doi: 10.1186/1471-2148-4-18. [DOI] [PMC free article] [PubMed] [Google Scholar] [Retracted]
- Katoh K, Toh H. Recent developments in the MAFFT multiple sequence alignment program. Brief Bioinform. 2008;9:286–298. doi: 10.1093/bib/bbn013. [DOI] [PubMed] [Google Scholar]
- Knapp JE, Oliveira MA, Xie Q, Ernst SR, Riggs AF, Hackert ML. The structural and functional analysis of the hemoglobin D component from chicken. J Biol Chem. 1999;274:6411–6420. doi: 10.1074/jbc.274.10.6411. [DOI] [PubMed] [Google Scholar]
- Lutz PL. On the oxygen-affinity of bird blood. Am Zool. 1980;20:187–198. doi: 10.1016/0034-5687(74)90029-2. [DOI] [PubMed] [Google Scholar]
- Lutz PL, Longmuir IS, Schmidt-Nielsen K. Oxygen affinity of bird blood. Respir Physiol. 1974;17:269–275. doi: 10.1016/0034-5687(74)90029-2. [DOI] [PubMed] [Google Scholar]
- Meredith RW, Janečka JE, Gatesy J, Ryder OA, Fisher CA, Teeling EC, Goodbla A, Eizirik E, Simão TLL, Stadler T, et al. Impacts of the Cretaceous terrestrial revolution and KPg extinction on mammal diversification. Science. 2011;334:521–524. doi: 10.1126/science.1211028. [DOI] [PubMed] [Google Scholar]
- Mindell DP, Knight A, Baer C, Huddleston CJ. Slow rates of molecular evolution in birds and the metabolic rate and body temperature hypotheses. Mol Biol Evol. 1996;13:422–426. [Google Scholar]
- Mrabet NT, McDonald MJ, Turci S, Sarkar R, Szabo A, Bunn HF. Electrostatic attraction governs the dimer assembly of human hemoglobin. J Biol Chem. 1986;261:5222–5228. [PubMed] [Google Scholar]
- Nam K, Mugal C, Nabholz B, Schielzeth H, Wolf JBW, Backstrom N, Kunstner A, Balakrishnan CN, Heger A, Ponting CP, et al. Molecular evolution of genes in avian genomes. Genome Biol. 2010;11:R68. doi: 10.1186/gb-2010-11-6-r68. [DOI] [PMC free article] [PubMed] [Google Scholar]
- Natarajan C, Inoguchi N, Weber RE, Fago A, Moriyama H, Storz JF. Epistasis among adaptive mutations in deer mouse hemoglobin. Science. 2013;340:1324–1327. doi: 10.1126/science.1236862. [DOI] [PMC free article] [PubMed] [Google Scholar]
- Opazo JC, Butts GT, Nery MF, Storz JF, Hoffmann FG. Whole-genome duplication and the functional diversification of teleost fish hemoglobins. Mol Biol Evol. 2013;30:140–153. doi: 10.1093/molbev/mss212. [DOI] [PMC free article] [PubMed] [Google Scholar]
- Opazo JC, Hoffmann FG, Storz JF. Differential loss of embryonic globin genes during the radiation of placental mammals. Proc Natl Acad Sci U S A. 2008a;105:12950–12955. doi: 10.1073/pnas.0804392105. [DOI] [PMC free article] [PubMed] [Google Scholar]
- Opazo JC, Hoffmann FG, Storz JF. Genomic evidence for independent origins of β-like globin genes in monotremes and therian mammals. Proc Natl Acad Sci U S A. 2008b;105:1590–1595. doi: 10.1073/pnas.0710531105. [DOI] [PMC free article] [PubMed] [Google Scholar]
- Opazo JC, Sloan AM, Campbell KL, Storz JF. Origin and ascendancy of a chimeric fusion gene: the β/δ-globin gene of paenungulate mammals. Mol Biol Evol. 2009;26:1469–1478. doi: 10.1093/molbev/msp064. [DOI] [PMC free article] [PubMed] [Google Scholar]
- Pagel M. Inferring the historical patterns of biological evolution. Nature. 1999;401:877–884. doi: 10.1038/44766. [DOI] [PubMed] [Google Scholar]
- Paradis E, Claude J, Strimmer K. APE: analyses of phylogenetics and evolution in R language. Bioinformatics. 2004;20:289–290. doi: 10.1093/bioinformatics/btg412. [DOI] [PubMed] [Google Scholar]
- Patel VS, Cooper SJB, Deakin JE, Fulton B, Graves T, Warren WC, Wilson RK, Graves JAM. Platypus globin genes and flanking loci suggest a new insertional model for beta-globin evolution in birds and mammals. BMC Biol. 2008;6:34. doi: 10.1186/1741-7007-6-34. [DOI] [PMC free article] [PubMed] [Google Scholar]
- Projecto-Garcia J, Natarajan C, Moriyama H, Weber RE, Fago A, Cheviron ZA, Dudley R, McGuire JA, Witt CC, Storz JF. Repeated elevational transitions in hemoglobin function during the evolution of Andean hummingbirds. Proc Natl Acad Sci U S A. 2013;110:20669–20674. doi: 10.1073/pnas.1315456110. [DOI] [PMC free article] [PubMed] [Google Scholar]
- Rana MS, Riggs AF. Indefinite noncooperative self-association of chicken deoxy hemoglobin D. Proteins Struct Funct Bioinform. 2011;79:1499–1512. doi: 10.1002/prot.22978. [DOI] [PubMed] [Google Scholar]
- Reitman M, Grasso JA, Blumenthal R, Lewit P. Primary sequence, evolution, and repetitive elements of the Gallus gallus (chicken) β-globin cluster. Genomics. 1993;18:616–626. doi: 10.1016/s0888-7543(05)80364-7. [DOI] [PubMed] [Google Scholar]
- Riggs AF. Self-association, cooperativity and supercooperativity of oxygen binding by hemoglobins. J Exp Biol. 1998;201:1073–1084. doi: 10.1242/jeb.201.8.1073. [DOI] [PubMed] [Google Scholar]
- Ronquist F, Huelsenbeck JP. MrBayes 3: Bayesian phylogenetic inference under mixed models. Bioinformatics. 2003;19:1572–1574. doi: 10.1093/bioinformatics/btg180. [DOI] [PubMed] [Google Scholar]
- Runck AM, Moriyama H, Storz JF. Evolution of duplicated β-globin genes and the structural basis of hemoglobin isoform differentiation in Mus. Mol Biol Evol. 2009;26:2521–2532. doi: 10.1093/molbev/msp165. [DOI] [PMC free article] [PubMed] [Google Scholar]
- Schmidt-Nielsen K, Larimer JL. Oxygen dissociation curves of mammalian blood in relation to body size. Am J Physiol. 1958;195:424–428. doi: 10.1152/ajplegacy.1958.195.2.424. [DOI] [PubMed] [Google Scholar]
- Schwarze K, Burmester T. Conservation of globin genes in the “living fossil” Latimeria chalumnae and reconstruction of the evolution of the vertebrate globin family. Biochim Biophys Acta-Proteins Proteomics. 2013;1834:1801–1812. doi: 10.1016/j.bbapap.2013.01.019. [DOI] [PubMed] [Google Scholar]
- Schwarze K, Campbell KL, Hankeln T, Storz JF, Hoffman FG, Burmester T. The globin gene repertoire of lampreys: convergent evolution of hemoglobin and myoglobin in jawed and jawless vertebrates. Mol Biol Evol. 2014;31:2708–2721. doi: 10.1093/molbev/msu216. [DOI] [PMC free article] [PubMed] [Google Scholar]
- Shaffer HB, Minx P, Warren DE, Shedlock AM, Thomson RC, Valenzuela N, Abramyan J, Amemiya CT, Badenhorst D, Biggar KK, et al. The western painted turtle genome, a model for the evolution of extreme physiological adaptations in a slowly evolving lineage. Genome Biol. 2013;14:R28. doi: 10.1186/gb-2013-14-3-r28. [DOI] [PMC free article] [PubMed] [Google Scholar]
- Shetty S, Griffin DK, Graves JAM. Comparative painting reveals strong chromosome homology over 80 million years of bird evolution. Chromosome Res. 1999;7:289–295. doi: 10.1023/a:1009278914829. [DOI] [PubMed] [Google Scholar]
- Shimodaira H. An approximately unbiased test of phylogenetic tree selection. Syst Biol. 2002;51:492–508. doi: 10.1080/10635150290069913. [DOI] [PubMed] [Google Scholar]
- Sibly RM, Witt CC, Wright NA, Venditti C, Jetz W, Brown JH. Energetics, lifestyle, and reproduction in birds. Proc Natl Acad Sci U S A. 2012;109:10937–10941. doi: 10.1073/pnas.1206512109. [DOI] [PMC free article] [PubMed] [Google Scholar]
- Song G, Hsu C-H, Riemer C, Zhang Y, Kim HL, Hoffmann F, Zhang L, Hardison RC, Green ED, Miller W, et al. Conversion events in gene clusters. BMC Evol Biol. 2011;11:226. doi: 10.1186/1471-2148-11-226. [DOI] [PMC free article] [PubMed] [Google Scholar]
- Song G, Riemer C, Dickins B, Kim HL, Zhang L, Zhang Y, Hsu C-H, Hardison RC, Nisc Comparative Sequencing P, Green ED, et al. Revealing mammalian evolutionary relationships by comparative analysis of gene clusters. Genome Biol Evol. 2012;4:586–601. doi: 10.1093/gbe/evs032. [DOI] [PMC free article] [PubMed] [Google Scholar]
- Storz JF, Hoffmann FG, Opazo JC, Moriyama H. Adaptive functional divergence among triplicated α-globin genes in rodents. Genetics. 2008;178:1623–1638. doi: 10.1534/genetics.107.080903. [DOI] [PMC free article] [PubMed] [Google Scholar]
- Storz JF, Hoffmann FG, Opazo JC, Sanger TJ, Moriyama H. Developmental regulation of hemoglobin synthesis in the green anole lizard Anolis carolinensis. J Exp Biol. 2011;214:575–581. doi: 10.1242/jeb.050443. [DOI] [PMC free article] [PubMed] [Google Scholar]
- Storz JF, Opazo JC, Hoffmann FG. Phylogenetic diversification of the globin gene superfamily in chordates. IUBMB Life. 2011;63:313–322. doi: 10.1002/iub.482. [DOI] [PMC free article] [PubMed] [Google Scholar]
- Storz JF, Opazo JC, Hoffmann FG. Gene duplication, genome duplication, and the functional diversification of vertebrate globins. Mol Phylogenet Evol. 2013;66:469–478. doi: 10.1016/j.ympev.2012.07.013. [DOI] [PMC free article] [PubMed] [Google Scholar]
- Tatusova TA, Madden TL. BLAST 2 SEQUENCES, a new tool for comparing protein and nucleotide sequences. FEMS Microbiol Lett. 1999;174:247–250. doi: 10.1111/j.1574-6968.1999.tb13575.x. [DOI] [PubMed] [Google Scholar]
- Tufts DM, Natarajan C, Revsbech IG, Projecto-Garcia J, Hoffmann FG, Weber RE, Fago A, Moriyama H, Storz JF. Epistasis constrains mutational pathways of hemoglobin adaptation in high-altitude pikas. Mol Biol Evol. 2015;32(2):287–298. doi: 10.1093/molbev/msu311. [DOI] [PMC free article] [PubMed] [Google Scholar]
- Weber RE, Fago A, Malte H, Storz JF, Gorr TA. Lack of conventional oxygen-linked proton and anion binding sites does not impair allosteric regulation of oxygen binding in dwarf caiman hemoglobin. Am J Physiol Regul Integr Comp Physiol. 2013;305:R300–R312. doi: 10.1152/ajpregu.00014.2013. [DOI] [PMC free article] [PubMed] [Google Scholar]
- Weber RE, Jessen TH, Malte H, Tame J. Mutant hemoglobins (α(119)-Ala and β(55)-Ser)—functions related to high-altitude respiration in geese. J Appl Physiol. 1993;75:2646–2655. doi: 10.1152/jappl.1993.75.6.2646. [DOI] [PubMed] [Google Scholar]
- Weber RE, Voelter W, Fago A, Echner H, Campanella E, Low PS. Modulation of red cell glycolysis: interactions between vertebrate hemoglobins and cytoplasmic domains of band 3 red cell membrane proteins. Am J Physiol Regul Integr Comp Physiol. 2004;287:R454–R464. doi: 10.1152/ajpregu.00060.2004. [DOI] [PubMed] [Google Scholar]
- Weber RE, White FN. Oxygen binding in alligator blood related to temperature, diving, and alkaline tide. Am J Physiol. 1986;251:R901–R908. doi: 10.1152/ajpregu.1986.251.5.R901. [DOI] [PubMed] [Google Scholar]
- Weber RE, White FN. Chloride-dependent organic phosphate sensitivity of the oxygenation reaction in crocodilian hemoglobins. J Exp Biol. 1994;192:1–11. doi: 10.1242/jeb.192.1.1. [DOI] [PubMed] [Google Scholar]
- Yang Z. PAML 4: phylogenetic analysis by maximum likelihood. Mol Biol Evol. 2007;24:1586–1591. doi: 10.1093/molbev/msm088. [DOI] [PubMed] [Google Scholar]
- Yang ZH. Likelihood ratio tests for detecting positive selection and application to primate lysozyme evolution. Mol Biol Evol. 1998;15:568–573. doi: 10.1093/oxfordjournals.molbev.a025957. [DOI] [PubMed] [Google Scholar]
- Yang ZH, Wong WSW, Nielsen R. Bayes empirical Bayes inference of amino acid sites under positive selection. Mol Biol Evol. 2005;22:1107–1118. doi: 10.1093/molbev/msi097. [DOI] [PubMed] [Google Scholar]
- Zhan X, Pan S, Wang J, Dixon A, He J, Muller MG, Ni P, Hu L, Liu Y, Hou H, et al. Peregrine and saker falcon genome sequences provide insights into evolution of a predatory lifestyle. Nat Genet. 2013;45:563–566. doi: 10.1038/ng.2588. [DOI] [PubMed] [Google Scholar]
- Zhang G, Li C, Li Q, Li B, Larkin DM, Lee C, Storz JF, Antunes A, Greenwold MJ, Meredith RW, et al. Comparative genomics reveals insights into avian genome evolution and adaptation. Science. 2014;346:1311–1320. doi: 10.1126/science.1251385. [DOI] [PMC free article] [PubMed] [Google Scholar]
Associated Data
This section collects any data citations, data availability statements, or supplementary materials included in this article.