

Abstract
Meiotic chromosome segregation is critical for fertility across eukaryotes, and core meiotic processes are well conserved even between kingdoms. Nevertheless, recent work in animals has shown that at least some meiosis genes are highly diverse or strongly differentiated among populations. What drives this remains largely unknown. We previously showed that autotetraploid Arabidopsis arenosa evolved stable meiosis, likely through reduced crossover rates, and that associated with this there is strong evidence for selection in a subset of meiosis genes known to affect axis formation, synapsis, and crossover frequency. Here, we use genome-wide data to study the molecular evolution of 70 meiosis genes in a much wider sample of A. arenosa. We sample the polyploid lineage, a diploid lineage from the Carpathian Mountains, and a more distantly related diploid lineage from the adjacent, but biogeographically distinct Pannonian Basin. We find that not only did selection act on meiosis genes in the polyploid lineage but also independently on a smaller subset of meiosis genes in Pannonian diploids. Functionally related genes are targeted by selection in these distinct contexts, and in two cases, independent sweeps occurred in the same loci. The tetraploid lineage has sustained selection on more genes, has more amino acid changes in each, and these more often affect conserved or potentially functional sites. We hypothesize that Pannonian diploid and tetraploid A. arenosa experienced selection on structural proteins that mediate sister chromatid cohesion, the formation of meiotic chromosome axes, and synapsis, likely for different underlying reasons.
Keywords: meiosis, evolution, polyploidy
Introduction
Reliable meiotic recombination and chromosome segregation are essential for the persistence of virtually all eukaryotic species. Given that the basic features of meiosis are largely conserved across even wide evolutionary distances (Villeneuve and Hillers 2001; Gerton and Hawley 2005; Mercier and Grelon 2008; Harrison et al. 2010), we might expect that the proteins that coordinate key steps in meiosis should be highly constrained. However, recent studies in animals show that this is not necessarily the case—many meiosis genes, particularly those involved in the prophase I processes of chromosome pairing, DNA repair and homologous recombination, are often surprisingly divergent among populations, and in some cases even variable within them (e.g., Turner et al. 2008; Anderson et al. 2009; Chowdhury et al. 2009; Kong et al. 2014). For example, genes implicated in meiotic DNA repair, homologous recombination, and chromosome segregation show signatures suggestive of adaptive divergence among Drosophila melanogaster populations, as well as between D. melanogaster and D. simulans (Turner et al. 2008; Anderson et al. 2009). Four meiosis-related genes were among those differentiated between mosquito populations along a latitudinal cline (Cheng et al. 2012), and in humans a STRUCTURAL MAINTENANCE OF CHROMOSOMES (SMC) gene involved in sister chromatid cohesion and crossover (CO) regulation shows evidence of having undergone a selective sweep in Chinese populations (Williamson et al. 2007). Although the mechanisms driving adaptive evolution of proteins important for meiosis remain unclear, they can have direct or indirect pleiotropic effects on genome-wide recombination rates and fertility. For instance, variants in several meiosis-related genes in humans have been statistically associated with effects on recombination and fertility. These genes include RAD21L, which encodes part of the sister chromatid cohesion complex and is required for axis formation and synapsis, MSH4 (mutS homolog 4), which encodes a ZMM protein required for CO formation, and RNF212, which encodes another ZMM protein essential for synapsis and recombination (Kong et al. 2008, 2014; Chowdhury et al. 2009; Fledel-Alon et al. 2011). In addition, variation in female genome-wide recombination rates is associated with an inversion, 17q21.31 (Fledel-Alon et al. 2011; Kong et al. 2014), which shows evidence of selection in Europeans (Stefansson et al. 2005; Boettger et al. 2012; Steinberg et al. 2012), though it is still unclear whether the structural variant itself, or a gene within this approximately 1-Mb region, is actually responsible for recombination rate variation. For other systems, it remains unknown whether divergence in meiosis genes is common, or whether this is causally linked with CO variation or other differences in meiosis.
One context in which we might expect selection to drive the evolution of meiosis genes is after whole-genome duplication (WGD), which leads to polyploidy. WGD occurs in all eukaryotic kingdoms and is thought to have contributed to organismal complexity and genomic novelty (Ramsey and Schemske 1998; Otto and Whitton 2000; Soltis et al. 2003; Comai 2005; Rieseberg and Willis 2007; Doyle et al. 2008; Bomblies and Madlung 2014). However, when it initially occurs, WGD poses significant challenges to chromosome segregation in meiosis (e.g., Myers 1945; Gilles and Randolph 1951; Bremer and Bremer-Reinders 1954; Ramsey and Schemske 1998; Comai 2005). In some polyploids, meiotic stability evolves through an increase in pairing partner preferences, whereas in species that retain random segregation of all homologs, lower genome-wide CO rates can promote fertility by reducing the formation of multivalent associations among multiple homologs in meiosis (e.g., Hazarika and Rees 1967; Wolf et al. 1989; Khawaja et al. 1997; Cifuentes et al. 2010; Bomblies and Madlung 2014; Lavania 1986). Autotetraploid Arabidopsis arenosa fits this latter model, as it has diploid-like bivalent formation despite random chromosome pairing, coupled with a significantly lower genome-wide CO rate than its diploid relatives (Comai et al. 2003; Yant et al. 2013). Patterns of genetic differentiation between ploidy levels suggest that the tetraploid lineage experienced strong selection on genes involved in cohesion, axis formation, and synapsis, all of which are implicated in altering genome-wide CO rates (Hollister et al. 2012; Yant et al. 2013). Expression level of one of these genes, ASY1, has also been shown through transgenic work in tetraploid wheat to directly affect CO rates and multivalent formation (Boden et al. 2009).
Here, we sought to better understand the evolution of 70 meiosis genes compared with genome-wide patterns of nucleotide diversity in a much broader sampling of populations of both diploid and autotetraploid A. arenosa. This species is an obligately outcrossing relative of A. thaliana with high genetic diversity (Lind-Halldén et al. 2002; Hollister et al. 2012; Schmickl et al. 2012). There is evidence that gene flow among populations of the same ploidy is high, and the widespread autotetraploids comprise a single lineage (B.A. and K.B. unpublished data), with limited gene flow from the diploid to the tetraploid lineage occurring within the Carpathian Mountains (Jørgensen et al. 2011; Schmickl et al. 2012). We sampled six tetraploid populations from throughout the range, as well as six diploid populations from two adjacent, biogeographically distinct regions: The Carpathian Mountains and the Pannonian Basin. Diploids from the two regions comprise distinct genetic lineages, with Carpathian Mountain diploids more closely related to the tetraploids. We find evidence that selection acted on meiosis genes not only in the tetraploid lineage but also in the diploid populations, extending patterns seen previously in Drosophila, mosquitoes, and humans to plants. We show that amino acid substitutions with large differences in allele frequency only rarely affect strongly conserved sites, or sites predicted to be phosphorylated, sumoylated, or in functional domains; all seven exceptions are unique to the autotetraploid lineage. We also find that even though in each lineage multiple interacting genes are under selection, the derived polymorphisms are rare or absent in related populations. Our results, together with previous findings, paint a picture that a subset of meiosis genes may repeatedly experience selection, though perhaps for different reasons in different lineages.
Results
Sampling and Population Relatedness
To analyze the molecular evolution of meiosis genes in a greater swath of A. arenosa diversity than we sampled previously (Hollister et al. 2012; Yant et al. 2013), we whole genome sequenced pooled samples (PoolSeq) of 165 individuals from 12 populations, 6 of each ploidy (fig. 1A and supplementary table S1, Supplementary Material online). We aligned the sequences to the A. lyrata genome (Hu et al. 2011) using the program STAMPY (Lunter and Goodson 2011) and estimated allele frequency in each pool with SNAPE (Raineri et al. 2012). We analyzed the genetic relatedness of sampled populations using Principal Component Analysis (PCA) with 290,000 high confidence markers. Tetraploids are most closely related to diploids from the Carpathian Mountains (hereafter “Carpathian diploids”) whereas samples from the Pannonian Basin of Slovakia and Hungary, which is a distinct biogeographic region (Molnár et al. 2006; Erdős et al. 2014), form a second more distantly related diploid gene pool (fig. 1B; hereafter “Pannonian diploids”). Using Worldclim data (Hijmans et al. 2005), we confirmed that the “Pannonian” sites we collected from are significantly warmer than sites where Carpathian diploids or tetraploids were collected (supplementary fig. S1, Supplementary Material online). Based on genetic relatedness and ploidy, we classified populations into each of three groups for subsequent analyses: Tetraploids (Tet), Carpathian diploids (C), and Pannonian diploids (P).
Fig. 1.
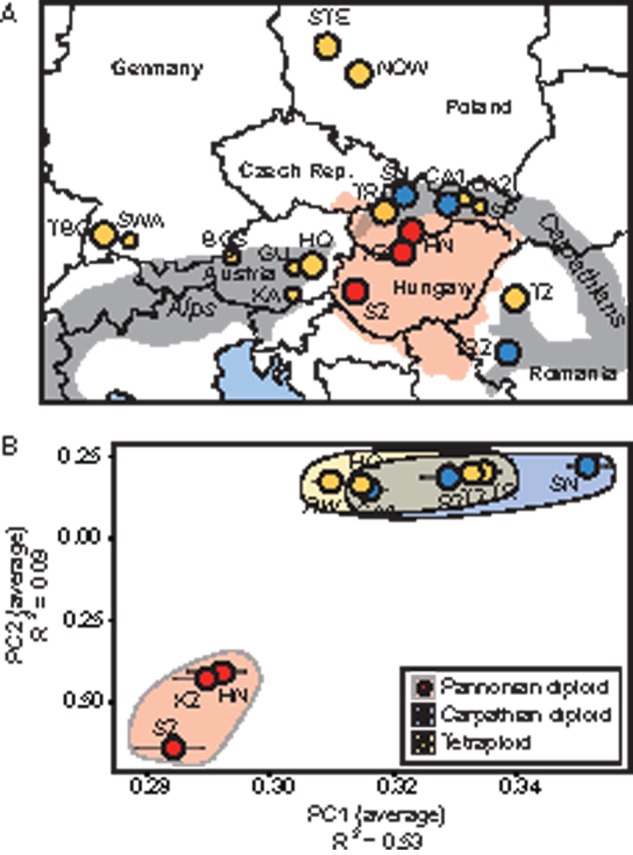
Populations sampled in this study. (A) Population locations. Yellow circles indicate tetraploid populations sampled for PoolSeq data set (large circles), small circles are additional tetraploid populations. Blue circles indicate Carpathian diploids from the Carpathian Mountains. Red circles indicate Pannonian diploid populations from Hungary and Slovakia. Red-shaded area shows the extent of the Pannonian Basin biogeographic zone, and gray-shaded regions indicate alpine biogeographic zones of the Alps and Carpathians. (B) PCA of whole-genome PoolSeq of ten populations. Each circle is an average PC value for an entire population corresponding to the map in panel (A), with the exception of RW, which is a mixed pool of three genetically very similar railway populations, STE, NOW, and TBG. PCA was conducted using 290,000 informative sites present in at least seven of ten populations. To account for missing data in particular genomic regions, we randomly subsampled 50,000 sites 100 times, conducted independent PCAs, and presented the 95% confidence intervals as error bars for each population. GPS coordinates of all populations are given in supplementary table S1, Supplementary Material online.
Differentiation of Meiosis Genes among Three A. arenosa Gene Pools
We tested which (if any) of 70 meiosis genes (Yant et al. 2013) show genome-wide outlier levels of differentiation among lineages using three different measurements. We used FST (Weir and Cockerham 1984), G, a statistic that quantifies raw allelic differentiation accounting for variation in read coverage (Magwene et al. 2011), and DD, which measures the ratio between the difference in allele frequency between populations and diversity within a population to account for the positive relationship between diversity and differentiation (Yant et al. 2013). We identified a total of 9.45 million single nucleotide polymorphisms (SNPs) for the Carpathian and Pannonian diploid contrasts (C × P), 8.71 million SNPs for the Pannonian diploid by tetraploid contrast (P × Tet), and 11.74 million SNPs for the Carpathian diploid by tetraploid contrast (C × Tet). We calculated each statistic for windows spanning 20, 40, or 100 SNPs for comparisons between all pairs of populations (n = 45) as well as between the three groups, and assigned rank scores to each window based on its position in the genome-wide distribution of values for FST, G, and DD (supplementary table S2, Supplementary Material online). Despite variation in coverage between population groups, this had almost no effect on our measurement of genetic diversity (supplementary table S3, Supplementary Material online). We next tested whether any of the 70 meiosis-related genes is enriched, compared with genome-wide background, for windows with outlier values of all three statistics. We identified seven genes (ASY1, ASY3 PDS5, ZYP1a, ZYP1b, SMC1, and SYN1/AtREC8) that each had multiple outlier windows for the three statistics in at least one set of populations (table 1). These results are largely consistent across window sizes (supplementary table S2, Supplementary Material online). For simplicity, we focus on one size class (40 SNP windows) in further analyses. Candidate genes show outlier values for each of the three statistics in comparisons between population pools, but in most cases, not among populations within pools (supplementary fig. S2, Supplementary Material online). All seven genes encode structural proteins that coordinate key events in early prophase including sister chromatid cohesion, axis formation, and crossing over (Hollingsworth et al. 1990; Bai et al. 1999; Panizza et al. 2000; Woltering et al. 2000; Armstrong et al. 2002; Blat et al. 2002; Cai et al. 2003; Higgins et al. 2005; Lam et al. 2005; Kleckner 2006; Sanchez-Moran et al. 2007; Eichinger and Jentsch 2010; Osman et al. 2011; Ferdous et al. 2012).
Table 1.
Genes with Significant Outlier Values for Three Differentiation Statistics.
|
FST |
G |
DD |
||||||||||||||
|---|---|---|---|---|---|---|---|---|---|---|---|---|---|---|---|---|
| Gene | ATG ID | Contr. | Bins/ Gene | Out. Bins | P Val | Max Bin | Max Rnk | Out. Bins | P Val | Max Bin | Max Rnk | Out. Bins | P Val | Min Bin | Min Rnk | Type |
| C × P | 19 | 3 | ** | 0.46 | * | 1 | — | 41.2 | — | 3 | ** | −0.06 | ** | |||
| ASY3 | AT2G46980 | C × Tet | 20 | 17 | **** | 0.58 | *** | 17 | **** | 61.4 | *** | 16 | **** | −0.20 | *** | ALL |
| P × Tet | 14 | 10 | **** | 0.59 | ** | 11 | **** | 64.2 | ** | 9 | **** | −0.10 | *** | |||
| C × P | 23 | 11 | **** | 0.65 | ** | 9 | **** | 88.0 | *** | 8 | **** | −0.09 | *** | |||
| SYN1 | AT5G05490 | C × Tet | 27 | 12 | **** | 0.35 | *** | 16 | **** | 32.5 | *** | 9 | **** | −0.16 | ** | ALL |
| P × Tet | 20 | 9 | **** | 0.81 | **** | 8 | **** | 91.1 | *** | 7 | **** | −0.15 | *** | |||
| C × P | 28 | 1 | — | 0.53 | ** | 1 | — | 56.6 | ** | 1 | — | −0.10 | ** | |||
| SMC1 | AT3G54670 | C × Tet | 33 | 15 | **** | 0.33 | *** | 16 | **** | 46.4 | *** | 15 | **** | −0.24 | *** | 2× |
| P × Tet | 25 | 0 | — | 0.42 | — | 6 | **** | 39.9 | * | 3 | ** | −0.10 | * | |||
| C × P | 25 | 0 | — | 0.40 | — | 2 | — | 44.3 | * | 2 | — | −0.13 | ** | |||
| ASY1 | At1g67370 | C × Tet | 26 | 9 | **** | 0.34 | *** | 10 | **** | 30.0 | ** | 10 | **** | −0.17 | *** | 4× |
| P × Tet | 22 | 3 | ** | 0.53 | *** | 5 | **** | 59.6 | ** | 5 | **** | −0.15 | ** | |||
| C × P | 32 | 0 | — | 0.38 | — | 0 | — | 37.9 | — | 1 | — | −0.10 | ** | |||
| PDS5 | AT1G77600 | C × Tet | 31 | 26 | **** | 0.59 | *** | 27 | **** | 67.2 | *** | 25 | **** | −0.29 | *** | 4× |
| P × Tet | 24 | 3 | ** | 0.56 | ** | 8 | **** | 57.4 | ** | 16 | **** | −0.19 | *** | |||
| C × P | 16 | 0 | — | 0.18 | — | 0 | — | 24.1 | — | 0 | — | −0.04 | — | |||
| ZYP1a | At1g22260 | C × Tet | 12 | 7 | **** | 0.28 | ** | 7 | **** | 37.0 | *** | 6 | **** | −0.13 | ** | 4× |
| P × Tet | 10 | 0 | — | 0.39 | — | 0 | — | 34.2 | — | 0 | — | −0.05 | — | |||
| C × P | 27 | 0 | — | 0.19 | — | 0 | — | 15.9 | — | 0 | — | −0.05 | — | |||
| ZYP1b | At1g22275 | C × Tet | 19 | 17 | **** | 0.52 | *** | 17 | **** | 39.5 | *** | 14 | **** | −0.22 | *** | 4× |
| P × Tet | 14 | 1 | — | 0.46 | * | 2 | * | 42.6 | ** | 5 | **** | −0.14 | ** | |||
Note.—Gene name indicates common name and ATG ID indicates the Arabidopsis thaliana gene ID number (www.arabidopsis.org; last accessed 24 December, 2014). Contr., contrast of population groups where C is Carpathian diploid, P is Pannonian diploid, and Tet is tetraploid. Bins are 40 SNP windows and Bins/Gene indicates how many bins lie in each gene region. “Out. Bins” indicates the number of outlier bins (regions which exceed the 1% genome-wide threshold). “P Val” indicates whether the number of outlier bins per gene is significantly enriched compared with genome-wide expectation where —>0.01, *0.01–0.005, **0.005–0.0005, ***0.0005–0.00001, and ****<0.00001. “Max bin” gives the maximum value of the FST, G, and DD statistic for any bin overlapping the focal gene and “Max Rnk” gives genome wide rank for the bin with symbols as for P value.
The seven high confidence candidates for selection exhibit multiple patterns of differentiation within and between the three population groups. Two genes (ASY3 and SYN1) showed differentiation in all contrasts (table 1 and fig. 2) and reduced diversity in Pannonian diploids and tetraploids, but not Carpathian diploids, a pattern consistent with selection for different polymorphisms in Pannonian diploid and tetraploid lineages (supplementary fig. S3, Supplementary Material online). The alleles targeted by selection in each case were distinct: Regions of reduced diversity in Pannonian diploids and tetraploids do not completely overlap (supplementary fig. S3, Supplementary Material online), there is significantly elevated differentiation between Pannonian diploids and tetraploids (table 1 and fig. 2), and high frequency derived (HFD) polymorphisms are distinct in the two lineages (fig. 3). SMC1 shows significant differentiation between Carpathian diploids and tetraploids, only marginal differentiation between Pannonian diploids and tetraploids (table 1 and supplementary table S2, Supplementary Material online), and reduced genetic diversity in both diploid lineages (supplementary fig. S3, Supplementary Material online). In contrast to ASY3 and SYN1, the same variants in SMC1 seem to have been selected in both lineages (table 1 and fig. 3). Four genes (ASY1, PDS5, ZYP1a, and ZYP1b) showed outlier levels of differentiation between diploids and tetraploids, but not among diploids (table 1 and supplementary table S2, Supplementary Material online; fig. 2 and supplementary fig. S2), and reduced nucleotide diversity only within tetraploids (supplementary fig. S3, Supplementary Material online). All four were previously reported as candidate targets of polyploid-specific selective sweeps in a genome-resequencing study that included a much smaller number of individuals (Yant et al. 2013). For ZYP1, which has two adjacent functionally redundant tandem duplicates (Higgins et al. 2005), we find elevated differentiation (fig. 2) and reduced diversity (supplementary fig. S3, Supplementary Material online) primarily in ZYP1b. Six genes (AT1G27900, MEI1, MSH2, PRD3, SMC3, and SMC6a) had weak patterns of differentiation that were inconsistent among different tests of differentiation and/or did not show patterns suggestive of selection within a specific region or cytotype (supplementary table S2, Supplementary Material online). Fifty-five genes had few or no outlier windows in any of the population pools and two genes did not have enough coverage to be included in analyses (supplementary table S2, Supplementary Material online). In order to quantify the possible problem of missing rare variants inherent in sequencing pools of genomic DNA, we generated and sequenced long-range polymerase chain reaction (lr-PCR) products from a subset of three strongly selected candidate genes (ASY1, ASY3, and ZYP1b) and flanking regions in 113 tetraploids, 21 Carpathian diploids, and 42 Pannonian diploids from 17 populations (supplementary table S1, Supplementary Material online). From this data set, we were able to confirm that similar patterns of population differentiation exist for these genes in both data sets (data not shown). We demonstrate from this also that many (though not all) high frequency polymorphisms characteristic of one lineage are present as rare variants in at least one other lineage (supplementary fig. S4 and table S4, Supplementary Material online). This pattern maybe caused by ancestral segregating variation or polymorphisms that introgressed through more recent gene flow.
Fig. 2.

Plots of DD outlier regions in eight meiosis genes. Plots indicating the spans of 40 SNP windows with outlier ranks (thin lines = 1%, thick lines = 0.1%), with target genes indicated with black arrows and other genes in the region with gray arrows. Blue lines, Carpathian diploid versus tetraploid (C × Tet) contrast; green lines, Pannonian diploid versus tetraploid (P × Tet) contrast; orange lines, Carpathian diploid versus Pannonian diploid (C × P) contrast. DD is calculated for ASY3, SYN1, ZYP1, PDS5 as a function of diversity in Pannonian diploids for C × P, and in tetraploids for C × Tet and P × Tet. DD is calculated for ASY1 as a function of diversity in Carpathian diploids for C × P, and in tetraploids for C × Tet, P × Tet. DD is calculated for SMC1 as a function of diversity in Carpathian diploids in C × P, Carpathian diploids in C × Tet, for Pannonian diploids in P × Tet. Gene models in each region are given as arrows at the bottom of each chart with the meiosis gene of interest in black and labeled.
Fig. 3.

HFD amino acid polymorphisms in meiosis genes in Arabidopsis arenosa. Tetr, tetraploid; C, Carpathian diploid; P, Pannonian diploid. Each gene model is indicated with gray bars, with intron locations indicated by gaps. Functional domains are indicated by blue bars below gene models. The ASY3 region is a portion of the protein known to interact with ASY1. Red lines show sites with unique derived alleles in tetraploids, black with unique derived alleles in Pannonian diploids, green with derived alleles in both Carpathian diploids and tetraploids, and gray indicates other patterns. Numbers indicate highlighted polymorphisms: 1) S367P in SYN1 in Pannonian diploids is predicted to cause loss of serine phosphorylation at S367 and gain of serine phosphorylation at adjacent S366, 2) D454G in SYN1 in tetraploids is predicted to cause loss of phosphorylation at the highly conserved S458, 3) K40E in ASY1 in tetraploids causes a charge switch at a highly conserved amino acid in the HORMA domain adjacent to a Tyrosine predicted by NetPhos to be phosphorylated, 4) Mutation T300I in PDS5 causes loss in tetraploids of a predicted ATM phosphorylation site, 5) two high frequency mutations in PDS5, T335R and A341V, are predicted to cause loss of phosphorylation at Y336 and Y340 in tetraploids, and 6) Q841E in PDS5 in tetraploids is predicted to cause the gain of a sumoylation site centered on residue 839.
High Frequency Amino Acid Changes in Meiosis Genes
We next examined the patterns of HFD amino acid changes relative to the A. lyrata reference genome (Hu et al. 2011). The patterns agree with our prior estimations of which lineages experienced selection. In the two genes that show evidence of selection in Pannonian diploids as well as tetraploids (ASY3 and SYN1), we see distinct sets of HFD amino acid changes (>0.5 allele frequency differences among populations) in Pannonian diploids and tetraploids, whereas Carpathian diploids have sequences very similar to A. lyrata (fig. 3 and supplementary table S5, Supplementary Material online). For both genes, the Pannonian diploid and tetraploid lineages each have numerous distinct HFD amino acid changes (fig. 3). Of the four SMC1 HFD amino acids, three (V614I, L706Q, and K911R) are shared between the Carpathian and Pannonian diploid lineages and one (E795D) is restricted to the Carpathian lineage (fig. 3 and supplementary table S5, Supplementary Material online). For ASY1, PDS5, ZYP1a, and ZYP1b, the majority of HFD nonsynomous changes are unique to the tetraploid lineage (fig. 3 and supplementary table S5, Supplementary Material online).
We next examined whether HFD amino acid changes in five proteins under selection (SYN1, ASY3, ASY1, PDS5, and SMC1) affect sites that are conserved in angiosperms and/or whether they are located in known protein functional domains. We excluded ZYP1a and ZYP1b as the duplication of these genes in the genus makes alignment and SNP conservation calls ambiguous. We analyzed alignments of the closest homologs of these five genes from 31 plant species. Out of 113 HFD differences across the five genes and three population groups in A. arenosa, only seven affect strongly conserved (>85% identity across all sampled species) amino acids (supplementary table S6, Supplementary Material online). All of these are tetraploid-specific: One is in the DNA-binding HORMA domain of ASY1 (K40E), two in ASY3 (T265I and L268V), two in PDS5 (S242F and S527Y), and two in SMC1 (F595S and Q923K) (fig. 3). Several HFD changes alter charged amino acids (D, E, K, and R). Some genes have relatively few charge-altering HFD sites (4/23 in PDS5, 4/20 in SYN1, 1/10 in SMC1, and 9/42 in ASY3), whereas ASY1 has a larger fraction (3/7). In two cases charge switches completely between negative and positive residues, rather than from charged to uncharged, once in the tetraploid allele of PDS5 (E949K), and once in the HORMA domain of ASY1 in tetraploids (K40E).
We also asked whether any HFD amino acid polymorphisms map to known functional domains. The HORMA and SWIRM domains in ASY1 have one and two HFD amino acid changes each, respectively (fig. 3). ASY1 and ASY3 are known to interact with one another, and one of the domains necessary for this interaction has been mapped in A. thaliana to the C-terminal tail of ASY3 (Ferdous et al. 2012). Though ASY3 is riddled with 42 HFD amino acid differences among population pools, not one of these falls within this ASY1-interaction domain (fig. 3). The core of the sister chromatid cohesin complex comprised three structural proteins (SYN1, SMC1, and SMC3), which form a ring enclosing and stabilizing the sister chromatids (Cai et al. 2003; Haering et al. 2004). In the yeast homolog of SYN1, Rec8, the N and C terminal domains bind SMC1 and SMC3 (Haering et al. 2002). These domains are recognizable in the Arabidopsis homologs and both domains lack HFD amino acid differences among A. arenosa populations.
Finally, as many of the meiosis proteins we found under selection are regulated by phosphorylation and sumoylation (e.g., Spirek et al. 2009; Eichinger and Jentsch 2010; Watts and Hoffmann 2011; Voelkel-Meiman et al. 2013; Zhang et al. 2014), we asked whether any of the HFDs in either Pannonian diploids or tetraploids might affect sites important for this. We mapped sites with four phosphorylation predictors and one sumoylation predictor. In only some cases do predicted phosphorylation sites overlap among different predictors; therefore, we limited ourselves to 43 “high confidence” sites across five proteins that were predicted to be phosphorylated by at least three of the programs (supplementary table S7, Supplementary Material online). High confidence phosphorylation and sumoylation sites generally do not differ among A. arenosa populations, but there are three exceptions, all of which are predicted to cause losses of phosphorylation sites in tetraploids: The nearly fixed tetraploid-specific mutation D454G is predicted to cause loss of phosphorylation at S458 in SYN1, and two predicted tyrosine phosphorylation sites in PDS5 (Y336 and Y340) are predicted to be inactivated by two nearby mutations that are nearly fixed in tetraploids (T335R and A341V; fig. 3). The two PDS5 tyrosine sites are not well conserved across angiosperms, but S458 in SYN1 is nearly perfectly conserved (in 26/28 homologous sequences). In no case is a predicted sumoylation site destroyed by HFD amino acid changes in any A. arenosa lineage, but the Q841E mutation found in the tetraploid allele of PDS5 is predicted to introduce a new weak sumoylation site.
Discussion
The core processes of meiosis are conserved across eukaryotes (Villeneuve and Hillers 2001; Gerton and Hawley 2005; Mercier and Grelon 2008; Harrison et al. 2010). Nevertheless, there is growing evidence from studies in animals that there is a surprising degree of diversity in genes that encode structural proteins essential for key meiotic functions, including chromosome pairing, repair, and crossing over (e.g., Williamson et al. 2007; Turner et al. 2008; Anderson et al. 2009; Cheng et al. 2012). As we previously found evidence that tetraploid A. arenosa experienced selection on meiosis genes (Hollister et al. 2012; Yant et al. 2013), here we studied the molecular evolution of 70 meiosis genes in both diploid and tetraploid lineages in more detail. We sampled six populations from the single autotetraploid lineage as well as six diploid populations. Among diploids, we find that those from the Carpathian Mountains are much more closely related to the autotetraploids than those from the adjacent, but biogeographically distinct Pannonian Basin.
We found seven meiosis genes with strong signatures suggestive of selection in at least one A. arenosa lineage. Three meiosis genes showed evidence that selection acted on them in diploid lineages, and two of these (ASY3 and SYN1) underwent independent selective sweeps targeting different alleles in both Pannonian diploids and in tetraploids. The finding of selection on meiosis genes in diploid A. arenosa parallels previous observations made in insects that a subset of meiosis genes involved in chromosome alignment, synapsis, and crossing-over can be strongly differentiated among populations (Turner et al. 2008; Anderson et al. 2009; Cheng et al. 2012). What drives the evolution of meiosis functioning proteins when the basic functions of meiosis are conserved across eukaryotes remains uncertain. However, as we discuss below, there are several hypotheses that may explain these patterns.
One possibility is that divergence is functionally neutral and is favored not because of selection on meiotic processes themselves. In this scenario, divergence is driven by coevolution such that a mutation in one protein that rises in frequency (either due to drift or selection) will cause selection for compensatory mutations in interacting partners to reoptimize protein complexes or interactions. This process can drive rapid divergence of multiple genes encoding members of protein complexes (e.g., Castillo-Davis et al. 2004; Takahashi et al. 2014). There is empirical evidence that such coevolutionary dynamics could be important for meiosis proteins. Several proteins with core functions in DNA repair and homologous recombination show molecular signatures suggestive of coevolution in fungi and animals (e.g., Clark et al. 2013). Furthermore, in natural strains of Saccharomyces cereviseae, allelic divergence in two interacting DNA repair proteins, MLH1 and PMS1, yields complexes that are fully functional in their native genomic context, but when brought together in hybrids, the alternate derived alleles cannot properly interact in heteromeric complexes, and very high mutation rates result (Heck et al. 2006; Demogines et al. 2008). In another study, expression of a wild-type RAD52 protein from Kluyveromyces lactis in S. cereviseae disrupts the interaction of the native RAD52 with its partner RAD51 and impairs DSB repair and recombination (Milne and Weaver 1993). As the proteins we found have high rates of differentiation between A. arenosa lineages interact to coordinate a common process, it is possible that coevolution could drive the divergence we observe in interacting proteins between populations, whether or not there is direct selection for alterations in core meiotic processes.
An additional explanation, not mutually exclusive to coevolutionary divergence, is that there may also be direct selection on genome-wide CO rates. Theoretical models suggest that higher recombination rates can promote adaptability of populations by increasing the likelihood that beneficial mutations are fixed and deleterious variants removed (e.g., Otto and Barton 1997; Marais and Charlesworth 2003; Roze and Barton 2006). Related to this is the possibility is that higher CO rates can be favored in order to suppress meiotic drivers (e.g., Haig and Grafen 1991). There is no information on CO frequency in the Pannonian diploids, so we cannot assess whether this hypothesis may explain the divergence in ASY3 and SYN1 between diploid lineages.
For the autotetraploid A. arenosa lineage, direct selection on CO rates may have occurred in association with the genome duplication in this lineage. Reductions in CO number, ideally to one per chromosome, can contribute to meiotic stability in autopolyploids by preventing the formation of multivalent associations among the multiple homologs, which correlate negatively with fertility (e.g., Hazarika and Rees 1967; Wolf et al. 1989; Khawaja et al. 1997; Cifuentes et al. 2010; Bomblies and Madlung 2014; Lavania). Like many other naturally occurring autotetraploids, A. arenosa has reduced CO numbers relative to its diploid progenitor (Comai et al. 2003; Yant et al. 2013). The genes we found here and previously (Hollister et al. 2012; Yant et al. 2013) to have evidence of selection in tetraploids (ASY1, ASY3, PDS5, ZYP1, SYN1) encode structural proteins that together coordinate key events in early prophase including sister chromatid cohesion, axis formation, and synapsis (Hollingsworth et al. 1990; Bai et al. 1999; Panizza et al. 2000; Woltering et al. 2000; Armstrong et al. 2002; Blat et al. 2002; Cai et al. 2003; Higgins et al. 2005; Lam et al. 2005; Kleckner 2006; Sanchez-Moran et al. 2007; Eichinger and Jentsch 2010; Osman et al. 2011; Ferdous et al. 2012). Importantly, these proteins are all directly or indirectly involved in coordinating CO formation (Hollingsworth et al. 1990; Woltering et al. 2000; Armstrong et al. 2002; Higgins et al. 2005; Sanchez-Moran et al. 2007; Osman et al. 2011; Ferdous et al. 2012). Transgenic modulation of expression levels suggests that at least one of these genes (ASY1) can affect CO rates and the frequency of multivalent formation in tetraploid wheat (Boden et al. 2009). We thus hypothesize that selection on meiosis genes in the tetraploid A. arenosa lineage may reflect the need to reduce CO rates to prevent multivalents and promote fertility in a tetraploid genomic context. Whether the observation that more genes and more amino acids at conserved sites are differentiated in the tetraploid, relative to the diploid lineage translates to a greater effect on meiosis in this lineage will be interesting to test.
For the Pannonian diploid lineage, there is an additional possibility, also not mutually exclusive with aforementioned hypotheses. The Pannonian diploids are from a distinct biogeographic region (Molnár et al. 2006; Erdös et al. 2014) that Worldclim data show is significantly warmer than surrounding mountain habitats of the tetraploids and the Carpathian diploids. Meiosis is known to be acutely sensitive to temperature in natural populations of both plants and animals, and this is particularly true of the very processes controlled by the genes that are strongly differentiated between A. arenosa lineages (axis formation, synapsis and CO regulation) (Wilson 1959a; Nebel and Hackett 1961; Buss and Henderson 1988; Henderson 1988; Loidl 1989; Bilgir et al. 2013). Elevated temperatures, sometimes of just a few degrees above normal, can lead to failures of synapsis and associated CO formation (Wilson 1959b, 1959a; Nebel and Hackett 1961; Shaw 1974; Buss and Henderson 1988; Henderson 1988; Loidl 1989; Bilgir et al. 2013). Importantly, the threshold temperatures at which meiosis becomes unstable, and the degree of sensitivity to temperature, are known to vary among wild populations and this variation has a genetic basis in at least some cases (e.g., Wilson 1959b; Riley et al. 1966; Shaw 1974; Buss and Henderson 1988; Francis et al. 2007). Taken together, these findings raise the interesting possibility that as populations colonize novel habitats or as global climate change alters the temperature in native habitats, there may be selection to stabilize the physical structures and protein interactions critical for meiotic axis formation, synapsis, and CO regulation. Whether temperature can be a driver of divergence in meiosis genes remains to be tested.
Whether the underlying causes of selection on meiosis genes in the two A. arenosa lineages we studied are different remains to be seen. If both diploid and tetraploid lineages are under selection for example for reduced CO rates, then it would be unsurprising that similar sets of genes are targeted. However, if the underlying causes are different, the observation that overlapping functional classes, and in two cases, distinct alleles of the same genes, are strongly differentiated among lineages could suggest that there are relatively few ways in which meiotic stabilization can be achieved by natural selection when the system is faced with challenges. As similarly sampled genome scans with molecular follow-up studies become available in this and other species, it will be interesting to ask whether the same sets of genes or functional classes are repeatedly under selection in tetraploid and/or diploid lineages and what the causal selective factors are.
Materials and Methods
Plant Material
We grew plants from first-generation seeds collected from wild populations in June/July of 2010 and 2012 (supplementary table S1, Supplementary Material online). We grew plants in growth chambers (Conviron MTPC144) under 18-h days, with 12 °C night temperatures and 18–22 °C day temperatures. We extracted DNA from individuals using a modified CTAB protocol as previously described (Hollister et al. 2012; Yant et al. 2013).
Sequencing and Variant Identification
PoolSeq Data set
We conducted pooled whole-genome resequencing from 12 populations, including 3 Pannonian diploid populations, 3 Carpathian diploid populations, and 6 tetraploid populations. We sampled 8–26 individuals from each population (supplementary table S1, Supplementary Material online) and pooled equal quantities of DNA for each individual in a population. For each pool, we prepared a barcoded DNA library for sequencing using adapter and primer combinations modified from (Peterson et al. 2012). We sequenced all ten libraries to a minimum of 11× coverage on three Illumina HiSeq lanes (supplementary table S8, Supplementary Material online). Three very closely related railway tetraploid populations (STE, TBG, and NOW) had lower than expected coverage (1.3–8.3×) compared with the other populations and we thus pooled these into a single population. We aligned reads to the A. lyrata genome (Hu et al. 2011) using the program STAMPY (Lunter and Goodson 2011). We used raw read number to call allele frequency with SNAPE (Raineri et al. 2012) to calculate a maximum-likelihood estimate of allele frequency, accounting for variation in read quality and coverage. For a site to be included in our analyses of population differentiation, we required a minimum of 15× coverage per population and a maximum coverage of 100×. We next created an additional data filtration step to exclude loci at which reads mapped from potentially paralogous loci as follows: Using eight diploid whole-genome sequences (Yant et al. 2013), we identified loci with erroneously mapped reads at annotated genes or intergenic segments (no longer than 2 kb) in which all eight diploids were heterozygous at more than two sites within the defined region. We excluded these loci from all downstream analyses, as it is unlikely for all eight diploids from two distinct populations to be heterozygous at three or more sites within a gene or intergenic segment according to Hardy–Weinberg equilibrium. We used only diploid genomes for this analysis in order to prevent ascertainment bias against potentially diploidized loci in the autotetraploids. We use this filtered data set in our pairwise population analyses; the number of sites and SNPs for each analysis is provided in supplementary table S9, Supplementary Material online. For a site to be included in our analysis of population group differentiation, coverage must exceed 25×. After this filtering we identified a total of 9.45 million SNPs for the Carpathian and Pannonian diploid contrasts (C × P), 8.71 million SNPs for the Pannonian diploid by tetraploid contrast (P × Tet), and 11.74 million SNPs for the Carpathian diploid by tetraploid contrast (C × Tet).
lr-PCR Data Set
To sequence ASY1, ASY3, and ZYP1 from a larger set of individuals, we amplified the genes by lr-PCR using Phusion High Fidelity DNA Polymerase (New England Biolabs) from 42 Pannonian diploids, 21 Carpathian diploids, and 113 tetraploids. We used primers spanning the genes and adjacent intergenic regions conserved between A. arenosa and A. thaliana to generate products of 7.1 kb for ASY1, 17 kb for ASY3, and 9.5 kb for ZYP1b. We pooled PCR product, barcoded each sample as in Peterson et al. (2012), and then sequenced all products together. We aligned reads to the A. lyrata genome (Hu et al. 2011) using STAMPY (Lunter and Goodson 2011), and called polymorphisms using GATK (McKenna et al. 2010), following GATK “Best Practices” protocols.
Population Relatedness and Differentiation
We conducted a PCA on variant sites that exceed the minimum 15× coverage in at least seven of ten populations (290,000 sites), randomly subsampled this data set to 50,000 sites 100 times, and conducted PCA on each subsampled data set. As these data sets contain missing data, we conducted the PCA using a probabilistic model to estimate missing values in the “ppca” program in the R package pcaMethods (Stacklies et al. 2007).
We assessed the degree of differentiation between populations using three different statistics: FST (Weir and Cockerham 1984), G (Magwene et al. 2011), and DD (Yant et al. 2013). We calculate FST as πB − πW/πB (Weir and Cockerham 1984); πW is the within-population expected heterozygosity, 2p(1 − p), where p is the frequency of the reference allele within a population. πB is the between-population heterozygosity and is calculated using the same formula except that here p is the weighted average allele frequency in both populations. In order to compare heterozygosity between cytotypes, we calculate the “gametic heterozygosity” of tetraploid populations (Moody et al. 1993). Gametic heterozygosity of an autotetraploid population and the homozygosity of a diploid population each define the probability that a pair of homologous sites, randomly drawn without replacement from a randomly selected individual, is identical (Moody et al. 1993). We also calculate a related measure of population differentiation that accounts for the amount of genetic diversity in a particular genomic window, the DD statistic, as the residual deviation from a linear regression fit to the relationship between differentiation (pi − pj) and diversity in one population (πWi) where p is the frequency of the reference allele in population i or j and πWi is the expected heterozygosity in population i (Yant et al. 2013). For each pairwise population contrast, we also calculate the reciprocal DD statistic, DD′ as taking the residual value from a linear regression fit to pi − pj and πWj. A large difference between DD and DD′, a result of low heterozygosity in one population relative to the other, suggests a selective sweep may have occurred in one population. Because our goal is to identify candidate selective sweeps, we report the larger of these two values for a particular genomic interval. Finally, we calculate the G statistic as a measure of population differentiation weighted by coverage at each site in each population. The G statistic is: 2 × Σni ln(ni/nexp) where, ni is observed allele count, i is each allele state at a particular site, and nexp is the expected allele count assuming no difference in allele frequency between populations (Magwene et al. 2011). We excluded all sites where nexp is less than 2.
We calculated each measure of differentiation between all possible pairs of populations (n = 45) and for the three population pools identified in the PCA analysis: Carpathian diploids, Pannonian diploids, and tetraploids. For pooled population data sets, we increased our filtering stringency so coverage at a site had to exceed 20× and the minor allele frequency of a putative SNP across populations had to exceed 0.01. We measured each statistic in 20, 40, and 100 SNP bins and assessed the significance of each window by its location in the genome-wide rank distribution for each independent population comparison.
For each of the 70 meiosis functioning proteins, we measured the total number of SNP bins that reside within ±2 kb of gene start/end sites. We next measured the number of gene-specific bins which reside in 1% tail of the genome-wide distribution of FST, G, and DD, and determined whether the number of outlier bins in a single gene is enriched compared the genome wide background using a one-sided hypergeometric distribution (Rivals et al. 2007).
Determining Protein Orthologs
We collected amino acid sequences for the meiosis genes we analyzed for conservation from 31 flowering plant species from phytozome (www.phytozome.com; last accessed 24 December, 2014). We included Oryza sativa, Brachypodium distachyon, Panicum virgatum, Setaria italica, Sorghum bicolor, Zea mays, Aquilegia coerulea, Vitis vinifera, Populus trichocarpa, Linum usitatissimum, Manihot esculenta, Ricinus communis, Medicago truncatula, Glycine max, Prunus persica, Malus domestica, Fragaria vesca, Phaseolus vulgaris, Eucalyptus grandis, Citrus clementina, Citrus sinensis, Theobroma cacao, Gossypium raimondii, A. lyrata, A. thaliana, Capsella rubella, Thellungiella halophila, Brassica rapa, Mimulus guttatus, Solanum lycopersicum, and Solanum tuberosum. We used InParanoid to search for orthologs between species using the BLOSSUM62 matrix with similarity cutoff score of 40 bits, a confidence score greater than 0.05, a sequence overlap cutoff of 0.5, and a group merging cutoff 0.5. The sequences of the 70 meiotic proteins (Yant et al. 2013) from A. thaliana were searched against the proteomes from each species to find orthologs, if present. Commonly, multiple orthologs were found to match the query sequence, in which case only the reciprocal best hits were taken as the ortholog matches to simplify further analysis. The sets of orthologous protein sequences were aligned using MUSCLE (Edgar 2004). We visualized and annotated the conserved domain information in Genious (v7.1) (Kearse et al. 2012) with domain assignments collected from the Arabidopsis genome annotation (TAIR; www.arabidopsis.org; last accessed 24 December, 2014).
Phosphorylation and Sumoylation Scans
To identify candidate sumoylation sites, we used GPS-Sumo (http://sumosp.biocuckoo.org; last accessed 24 December, 2014). To identify candidate phosphorylation sites, we used four different servers and limited ourselves to sites that were identified in at least three of them. We used: NetPhos 2.0 (Blom et al. 1999), DiPhos (http://www.dabi.temple.edu/disphos/information.html#links; last accessed 24 December, 2014), Scansite3 (Obenauer et al. 2003), and P3DB (Zanzoni et al. 2007). We used the A. lyrata reference sequences for each gene to identify candidate sites, and then altered this sequence with known high frequency changes from either Pannonian diploids or tetraploids to ask whether these changes affect the predicted modifications at identified sites.
Bioclimatic Differentiation
We used the Worldclim data set to find bioclimatic data for all diploid and tetraploid populations (Hijmans et al. 2005). We extracted bioclimatic data at the finest resolution of the Worldclim data set, 30 s × 30 s (∼1 km2) cells using the R package “raster” (Hijmans et al. 2005). We conducted a PCA of all 19 bioclimatic variables in the data set as well as a subset of five temperature associated bioclimatic variables: Temperature for the warmest month, warmest quarter (three month period), driest quarter, annual temperature, and seasonality (standard deviation in weekly measurements of temperature compared with mean annual temperature). We present temperature-specific habitat differentiation (supplementary table S1 and fig. S1, Supplementary Material online), although we find similar levels of differentiation between Carpathian and Pannonian diploid populations in both data sets (results not shown). We tested whether there is a significant effect of population group on each bioclimatic variable using the GLM procedure in R (v. 2.15.1).
Supplementary Material
Supplementary tables S1–S9 and figures S1–S3 are available at Molecular Biology and Evolution online (http://www.mbe.oxfordjournals.org/).
Acknowledgments
The authors thank Nancy Kleckner, Dan Hartl, and members of the Hartl and Bomblies labs for helpful advice and discussions, and Levi Yant for helpful comments on the manuscript. They also thank Dina Benayad-Cherif for help with sequencing. This work was supported by an NRSA postdoctoral fellowship from the National Institute of Health (NIH 5F32GM105293) to K.W., and a Harvard University Milton Fund Award and a MacArthur Fellowship to K.B.
References
- Anderson JA, Gilliland WD, Langley CH. Molecular population genetics and evolution of Drosophila meiosis genes. Genetics. 2009;181:177–185. doi: 10.1534/genetics.108.093807. [DOI] [PMC free article] [PubMed] [Google Scholar]
- Armstrong SJ, Caryl AP, Jones GH, Franklin FCH. Asy1, a protein required for meiotic chromosome synapsis, localizes to axis-associated chromatin in Arabidopsis and Brassica. J Cell Sci. 2002;115:3645–3655. doi: 10.1242/jcs.00048. [DOI] [PubMed] [Google Scholar]
- Bai X, Peirson BN, Dong F, Xue C, Makaroff CA. Isolation and characterization of SYN1, a RAD21-like gene essential for meiosis in Arabidopsis. Plant Cell. 1999;11:417–430. doi: 10.1105/tpc.11.3.417. [DOI] [PMC free article] [PubMed] [Google Scholar]
- Bilgir C, Dombecki CR, Chen PF, Villeneuve AM, Nabeshima K. Assembly of the synaptonemal complex is a highly temperature-sensitive process that is supported by PGL-1 during Caenorhabditis elegans meiosis. G3. 2013;3:585–595. doi: 10.1534/g3.112.005165. [DOI] [PMC free article] [PubMed] [Google Scholar]
- Blat Y, Protacio RU, Hunter N, Kleckner N. Physical and functional interactions among basic chromosome organizational features govern early steps of meiotic chiasma formation. Cell. 2002;111:791–802. doi: 10.1016/s0092-8674(02)01167-4. [DOI] [PubMed] [Google Scholar]
- Blom N, Gammeltoft S, Brunak S. Sequence and structure-based prediction of eukaryotic protein phosphorylation sites. J Mol Biol. 1999;294:1351–1362. doi: 10.1006/jmbi.1999.3310. [DOI] [PubMed] [Google Scholar]
- Boden SA, Langridge P, Spangenberg G, Able JA. TaASY1 promotes homologous chromosome interactions and is affected by deletion of Ph1. Plant J. 2009;57:487–497. doi: 10.1111/j.1365-313X.2008.03701.x. [DOI] [PubMed] [Google Scholar]
- Boettger LM, Handsaker RE, Zody MC, McCarroll SA. Structural haplotypes and recent evolution of the human 17q21.31 region. Nat Genet. 2012;44:881–885. doi: 10.1038/ng.2334. [DOI] [PMC free article] [PubMed] [Google Scholar]
- Bomblies K, Madlung A. Polyploidy in the Arabidopsis genus. Chromosome Res. 2014;22:117–134. doi: 10.1007/s10577-014-9416-x. [DOI] [PubMed] [Google Scholar]
- Bremer G, Bremer-Reinders DE. Breeding of tetraploid rye in the Netherlands. I. Methods and cytological observations. Euphytica. 1954;3:49–63. [Google Scholar]
- Buss ME, Henderson SA. The effects of elevated temperature on chiasma formation in Locusta migratoria. Chromosoma. 1988;97:235–246. [Google Scholar]
- Cai X, Dong F, Edelmann RE, Makaroff CA. The Arabidopsis SYN1 cohesin protein is required for sister chromatid arm cohesion and homologous chromosome pairing. J Cell Sci. 2003;116:2999–3007. doi: 10.1242/jcs.00601. [DOI] [PubMed] [Google Scholar]
- Castillo-Davis CI, Kondrashov FA, Hartl DL, Kulathinal RJ. The functional genomic distribution of protein divergence in two animal phyla: coevolution, genomic conflict, and constraint. Genome Res. 2004;14:802–811. doi: 10.1101/gr.2195604. [DOI] [PMC free article] [PubMed] [Google Scholar]
- Cheng C, White BJ, Kamdem C, Mockaitis K, Costantini C, Hahn MW, Besansky NJ. Ecological genomics of Anopheles gambiae along a latitudinal cline: a population-resequencing approach. Genetics. 2012;190:1417–1432. doi: 10.1534/genetics.111.137794. [DOI] [PMC free article] [PubMed] [Google Scholar]
- Chowdhury R, Bois PRJ, Feingold E, Sherman SL, Cheung VG. 2009. Genetic analysis of variation in human meiotic recombination. PLoS Genet. 5:e1000648. [DOI] [PMC free article] [PubMed] [Google Scholar]
- Cifuentes M, Grandont L, Moore G, Chèvre AM, Jenczewski E. Genetic regulation of meiosis in polyploid species: new insights into an old question. New Phytol. 2010;186:29–36. doi: 10.1111/j.1469-8137.2009.03084.x. [DOI] [PubMed] [Google Scholar]
- Clark NL, Alani E, Aquadro CF. Evolutionary rate covariation in meiotic proteins results from fluctuating evolutionary pressure in yeasts and mammals. Genetics. 2013;193:529–538. doi: 10.1534/genetics.112.145979. [DOI] [PMC free article] [PubMed] [Google Scholar]
- Comai L. The advantages and disadvantages of being polyploid. Nat Rev Genet. 2005;6:836–846. doi: 10.1038/nrg1711. [DOI] [PubMed] [Google Scholar]
- Comai L, Tyagi AP, Lysak MA. FISH analysis of meiosis in Arabidopsis allopolyploids. Chromosome Res. 2003;11:217–226. doi: 10.1023/a:1022883709060. [DOI] [PubMed] [Google Scholar]
- Demogines A, Wong A, Aquadro C, Alani E. 2008. Incompatibilities involving yeast mismatch repair genes: a role for genetic modifiers and implications for disease penetrance and variation in genomic mutation rates. PLoS Genet. 4:e1000103. [DOI] [PMC free article] [PubMed] [Google Scholar]
- Doyle JJ, Flagel LE, Paterson AH, Rapp RA, Soltis DE, Soltis PS, Wendel JF. Evolutionary genetics of genome merger and doubling in plants. Annu Rev Genet. 2008;42:443–461. doi: 10.1146/annurev.genet.42.110807.091524. [DOI] [PubMed] [Google Scholar]
- Edgar RC. MUSCLE: multiple sequence alignment with high accuracy and high throughput. Nucleic Acids Res. 2004;32:1792–1797. doi: 10.1093/nar/gkh340. [DOI] [PMC free article] [PubMed] [Google Scholar]
- Eichinger CS, Jentsch S. Synaptonemal complex formation and meiotic checkpoint signaling are linked to the lateral element protein Red1. Proc Natl Acad Sci U S A. 2010;107:11370–11375. doi: 10.1073/pnas.1004248107. [DOI] [PMC free article] [PubMed] [Google Scholar]
- Erdős L, Tölgyesi C, Horzse M, Tolnay D, Hurton Á, Schulcz N, Körmöczi L, Lengyel A, Bátori Z. Habitat complexity of the Pannonian forest-steppe zone and its nature conservation implications. Ecol Complex. 2014;17:107–118. [Google Scholar]
- Ferdous M, Higgins JD, Osman K, Lambing C, Roitinger E, Mechtler K, Armstrong SJ, Perry R, Pradillo M, Cuñado M, et al. Interhomolog crossing-over and synapsis in Arabidopsis meiosis are dependent on the chromosome axis protein AtASY3. PLoS Genet. 2012;8:e1002507. doi: 10.1371/journal.pgen.1002507. [DOI] [PMC free article] [PubMed] [Google Scholar]
- Fledel-Alon A, Leffler EM, Guan Y, Stephens M, Coop G, Przeworski M. 2011. Variation in human recombination rates and its genetic determinants. PLoS One 6:e20321. [DOI] [PMC free article] [PubMed] [Google Scholar]
- Francis KE, Lam SY, Harrison BD, Bey AL, Berchowitz LE, Copenhaver GP. Pollen tetrad-based visual assay for meiotic recombination in Arabidopsis. Proc Natl Acad Sci U S A. 2007;104:3913–3918. doi: 10.1073/pnas.0608936104. [DOI] [PMC free article] [PubMed] [Google Scholar]
- Gerton JL, Hawley RS. Homologous chromosome interactions in meiosis: diversity amidst conservation. Nat Rev Genet. 2005;6:477–487. doi: 10.1038/nrg1614. [DOI] [PubMed] [Google Scholar]
- Gilles A, Randolph LF. Reduction of quadrivalent frequency in autotetraploid maize during a period of ten years. Am J Bot. 1951;38:12–17. [Google Scholar]
- Haering CH, Löwe J, Hochwagen A, Nasmyth K. Molecular architecture of SMC proteins and the yeast cohesin complex. Mol Cell. 2002;9:773–788. doi: 10.1016/s1097-2765(02)00515-4. [DOI] [PubMed] [Google Scholar]
- Haering CH, Schoffnegger D, Nishino T, Helmhart W, Nasmyth K, Löwe J. Structure and stability of cohesin's Smc1-kleisin interaction. Mol Cell. 2004;15:951–964. doi: 10.1016/j.molcel.2004.08.030. [DOI] [PubMed] [Google Scholar]
- Haig D, Grafen A. Genetic scrambling as a defence against meiotic drive. J Theor Biol. 1991;153:531–558. doi: 10.1016/s0022-5193(05)80155-9. [DOI] [PubMed] [Google Scholar]
- Harrison CJ, Alvey E, Henderson IR. Meiosis in flowering plants and other green organisms. J Exp Bot. 2010;61:2863–2875. doi: 10.1093/jxb/erq191. [DOI] [PubMed] [Google Scholar]
- Hazarika MH, Rees H. Genotypic control of chromosome behaviour in rye. X. Chromosome pairing and fertility in autotetraploids. Heredity. 1967;22:317–322. [Google Scholar]
- Heck JA, Argueso JL, Gemici Z, Reeves RG, Bernard A, Aquadro CF, Alani E. Negative epistasis between natural variants of the Saccharomyces cerevisiae MLH1 and PMS1 genes results in a defect in mismatch repair. Proc Natl Acad Sci U S A. 2006;103:3256–3261. doi: 10.1073/pnas.0510998103. [DOI] [PMC free article] [PubMed] [Google Scholar]
- Henderson SA. Four effects of elevated temperature on chiasma formation in the locust Schistocerca gregaria. Heredity. 1988;60:387–401. [Google Scholar]
- Higgins JD, Sanchez-Moran E, Armstrong SJ, Jones GH, Franklin FCH. The Arabidopsis synaptonemal complex protein ZYP1 is required for chromosome synapsis and normal fidelity of crossing over. Genes Dev. 2005;19:2488–2500. doi: 10.1101/gad.354705. [DOI] [PMC free article] [PubMed] [Google Scholar]
- Hijmans RJ, Camerson SE, Parra JL, Jones PG, Jarvis A. Very high resolution interpolated climate surfaces for global land areas. Int J Climatol. 2005;25:1965–1978. [Google Scholar]
- Hollingsworth NM, Goetsch L, Byers B. The HOP1 gene encodes a meiosis-specific component of yeast chromosomes. Cell. 1990;61:73–84. doi: 10.1016/0092-8674(90)90216-2. [DOI] [PubMed] [Google Scholar]
- Hollister JD, Arnold BJ, Svedin E, Xue KS, Dilkes BP, Bomblies K. 2012. Genetic adaptation associated with genome-doubling in autotetraploid Arabidopsis arenosa. PLoS Genet. 8:e1003093. [DOI] [PMC free article] [PubMed] [Google Scholar]
- Hu TT, Pattyn P, Bakker EG, Cao J, Cheng J-F, Clark RM, Fahlgren N, Fawcett JA, Grimwood J, Gundlach H, et al. The Arabidopsis lyrata genome sequence and the basis of rapid genome size change. Nat Genet. 2011;43:476–481. doi: 10.1038/ng.807. [DOI] [PMC free article] [PubMed] [Google Scholar]
- Jørgensen MH, Ehrich D, Schmickl R, Koch MA, Brysting AK. Interspecific and interploidal gene flow in Central European Arabidopsis (Brassicaceae) BMC Evol Biol. 2011;11:346. doi: 10.1186/1471-2148-11-346. [DOI] [PMC free article] [PubMed] [Google Scholar]
- Kearse M, Moir R, Wilson A, Stones-Havas S, Cheung M, Sturrock S, Buxton S, Cooper A, Markowitz S, Duran C, et al. Geneious Basic: an integrated and extendable desktop software platform for the organization and analysis of sequence data. Bioinformatics. 2012;28:1647–1649. doi: 10.1093/bioinformatics/bts199. [DOI] [PMC free article] [PubMed] [Google Scholar]
- Khawaja H, Sybenga J, Ellis JR. Chromosome pairing and chiasma formation in autopolyploids of different Lathyrus species. Genome. 1997;40:937–944. doi: 10.1139/g97-120. [DOI] [PubMed] [Google Scholar]
- Kleckner N. Chiasma formation: chromatin/axis interplay and the role(s) of the synaptonemal complex. Chromosoma. 2006;115:175–194. doi: 10.1007/s00412-006-0055-7. [DOI] [PubMed] [Google Scholar]
- Kong A, Thorleifsson G, Frigge ML, Masson G, Gudbjartsson DF, Villemoes R, Magnusdottir E, Olafsdottir SB, Thorsteinsdottir U, Stefansson K, et al. Common and low-frequency variants associated with genome-wide recombination rate. Nat Genet. 2014;46:11–16. doi: 10.1038/ng.2833. [DOI] [PubMed] [Google Scholar]
- Kong A, Thorleifsson G, Stefansson H, Masson G, Helgason A, Gudbjartsson DF, Jonsdottir GM, Gudjonsson SA, Sverrison S, Thorlacius T, et al. Sequence variants in the RNF212 gene associate with genome-wide recombination rate. Science. 2008;319:1398–1401. doi: 10.1126/science.1152422. [DOI] [PubMed] [Google Scholar]
- Lam WS, Yang X, Makaroff CA. Characterization of Arabidopsis thaliana SMC1 and SMC3: evidence that AtSMC3 may function beyond chromosome cohesion. J Cell Sci. 2005;118:3037–3048. doi: 10.1242/jcs.02443. [DOI] [PubMed] [Google Scholar]
- Lavania UC. High bivalent frequencies in artificial autopolyploids of Hyoscyamus muticus L. Can J Genet Cytol. 1986;28:7–11. [Google Scholar]
- Lind-Halldén C, Halldén C, Säll T. Genetic variation in Arabidopsis suecica and its parental species A. arenosa and A. thaliana. Hereditas. 2002;136:45–50. doi: 10.1034/j.1601-5223.2002.1360107.x. [DOI] [PubMed] [Google Scholar]
- Loidl J. Effects of elevated temperature on meiotic chromosome synapsis in Allium ursinum. Chromosoma. 1989;97:449–458. [Google Scholar]
- Lunter G, Goodson M. Stampy: a statistical algorithm for sensitive and fast mapping of Illumina sequence reads. Genome Res. 2011;21:936–939. doi: 10.1101/gr.111120.110. [DOI] [PMC free article] [PubMed] [Google Scholar]
- Magwene PM, Willis JH, Kelly JK. 2011. The statistics of bulk segregant analysis using next generation sequencing. PLoS Comput Biol. 7:e1002255. [DOI] [PMC free article] [PubMed] [Google Scholar]
- Marais G, Charlesworth B. Genome evolution: recombination speeds up adaptive evolution. Curr Biol. 2003;13:R68–R70. doi: 10.1016/s0960-9822(02)01432-x. [DOI] [PubMed] [Google Scholar]
- McKenna A, Hanna M, Banks E, Sivachenko A, Cibulskis K, Kernytsky A, Garimella K, Altshuler D, Gabriel S, Daly M, et al. The Genome Analysis Toolkit: a MapReduce framework for analyzing next-generation DNA sequencing data. Genome Res. 2010;20:1297–1303. doi: 10.1101/gr.107524.110. [DOI] [PMC free article] [PubMed] [Google Scholar]
- Mercier R, Grelon M. Meiosis in plants: ten years of gene discovery. Cytogenet Genome Res. 2008;120:281–290. doi: 10.1159/000121077. [DOI] [PubMed] [Google Scholar]
- Milne GT, Weaver DT. Dominant negative alleles of RAD52 reveal a DNA repair/recombination complex including Rad51 and Rad52. Genes Dev. 1993;7:1755–1765. doi: 10.1101/gad.7.9.1755. [DOI] [PubMed] [Google Scholar]
- Molnár G, Timár CS, Ferencz C, Székely B, Lichtenberger J, Sallai K. Land surface temperature (LST) estimations in the Pannonian Basin using MODIS satellite data. Geophys Res Abstr. 2006;8:06588. [Google Scholar]
- Moody ME, Mueller LD, Soltis DE. Genetic variation and random drift in autotetraploid populations. Genetics. 1993;134:649–657. doi: 10.1093/genetics/134.2.649. [DOI] [PMC free article] [PubMed] [Google Scholar]
- Myers WM. Meiosis in autotetraploid Lolium perenne in relation to chromosomal behavior in autopolyploids. Bot Gaz. 1945;106:304–316. [Google Scholar]
- Nebel BR, Hackett EM. Synaptinemal complexes (cores) in primary spermatocytes of mouse under elevated temperature. Nature. 1961;190:467–468. doi: 10.1038/190467a0. [DOI] [PubMed] [Google Scholar]
- Obenauer JC, Cantley LC, Yaffe MB. Scansite 2.0: proteome-wide prediction of cell signaling interactions using short sequence motifs. Nucleic Acids Res. 2003;31:3635–3641. doi: 10.1093/nar/gkg584. [DOI] [PMC free article] [PubMed] [Google Scholar]
- Osman K, Higgins JD, Sanchez-Moran E, Armstrong SJ, Franklin FCH. Pathways to meiotic recombination in Arabidopsis thaliana. New Phytol. 2011;190:523–544. doi: 10.1111/j.1469-8137.2011.03665.x. [DOI] [PubMed] [Google Scholar]
- Otto SP, Barton NH. The evolution of recombination: removing the limits to natural selection. Genetics. 1997;147:879–906. doi: 10.1093/genetics/147.2.879. [DOI] [PMC free article] [PubMed] [Google Scholar]
- Otto SP, Whitton J. Polyploid incidence and evolution. Annu Rev Genet. 2000;34:401–437. doi: 10.1146/annurev.genet.34.1.401. [DOI] [PubMed] [Google Scholar]
- Panizza S, Tanaka T, Hochwagen A, Eisenhaber F, Nasmyth K. Pds5 cooperates with cohesin in maintaining sister chromatid cohesion. Curr Biol. 2000;10:1557–1564. doi: 10.1016/s0960-9822(00)00854-x. [DOI] [PubMed] [Google Scholar]
- Peterson BK, Weber JN, Kay EH, Fisher HS, Hoekstra HE. 2012. Double digest RADseq: an inexpensive method for de novo SNP discovery and genotyping in model and non-model species. PLoS One 7:e37135. [DOI] [PMC free article] [PubMed] [Google Scholar]
- Raineri E, Ferretti L, Esteve-Codina A, Nevado B, Heath S, Pérez-Enciso M. SNP calling by sequencing pooled samples. BMC Bioinformatics. 2012;13:239. doi: 10.1186/1471-2105-13-239. [DOI] [PMC free article] [PubMed] [Google Scholar]
- Ramsey J, Schemske D. Neopolyploidy in flowering plants. Annu Rev Ecol Syst. 1998;33:589–639. [Google Scholar]
- Rieseberg L, Willis J. Plant speciation. Science. 2007;317:910–914. doi: 10.1126/science.1137729. [DOI] [PMC free article] [PubMed] [Google Scholar]
- Riley R, Darlington CD, Lewis KR. Genotype-environmental inter-action affecting chiasma frequency in Triticum aestivum. Chromosomes Today. 1966;1966:57–65. [Google Scholar]
- Rivals I, Personnaz L, Taing L, Potier M-C. Enrichment or depletion of a GO category within a class of genes: which test? Bioinformatics. 2007;23:401–407. doi: 10.1093/bioinformatics/btl633. [DOI] [PubMed] [Google Scholar]
- Roze D, Barton NH. The Hill-Robertson effect and the evolution of recombination. Genetics. 2006;173:1793–1811. doi: 10.1534/genetics.106.058586. [DOI] [PMC free article] [PubMed] [Google Scholar]
- Sanchez-Moran E, Santos JL, Jones GH, Franklin FCH. ASY1 mediates AtDMC1-dependent interhomolog recombination during meiosis in Arabidopsis. Genes Dev. 2007;21:2220–2233. doi: 10.1101/gad.439007. [DOI] [PMC free article] [PubMed] [Google Scholar]
- Schmickl R, Paule J, Klein J, Marhold K, Koch MA. 2012. The evolutionary history of the Arabidopsis arenosa complex: diverse tetraploids mask the Western Carpathian center of species and genetic diversity. PLoS One 7:e42691. [DOI] [PMC free article] [PubMed] [Google Scholar]
- Shaw DD. Genetic and environmental components of chiasma control. 3. Genetic analysis of chiasma frequency variation in two selected lines of Schistocerca gregaria Forsk. Chromosoma. 1974;46:365–374. doi: 10.1007/BF00331627. [DOI] [PubMed] [Google Scholar]
- Soltis DE, Soltis PS, Tate JA. Advances in the study of polyploidy since Plant speciation. New Phytol. 2003;161:173–191. [Google Scholar]
- Spirek M, Estreicher A, Csaszar E, Wells J, McFarlane RJ, Watts FZ, Loidl J. SUMOylation is required for normal development of linear elements and wild-type meiotic recombination in Schizosaccharomyces pombe. Chromosoma. 2009;119:59–72. doi: 10.1007/s00412-009-0241-5. [DOI] [PubMed] [Google Scholar]
- Stacklies W, Redestig H, Scholz M, Walther D, Selbig J. pcaMethods: a bioconductor package providing PCA methods for incomplete data. Bioinformatics. 2007;23:1164–1167. doi: 10.1093/bioinformatics/btm069. [DOI] [PubMed] [Google Scholar]
- Stefansson H, Helgason A, Thorleifsson G, Steinthorsdottir V, Masson G, Barnard J, Baker A, Jonasdottir A, Ingason A, Gudnadottir VG, et al. A common inversion under selection in Europeans. Nat Genet. 2005;37:129–137. doi: 10.1038/ng1508. [DOI] [PubMed] [Google Scholar]
- Steinberg KM, Antonacci F, Sudmant PH, Kidd JM, Campbell CD, Vives L, Malig M, Scheinfeldt L, Beggs W, Ibrahim M, et al. Structural diversity and African origin of the 17q21.31 inversion polymorphism. Nat Genet. 2012;44:872–880. doi: 10.1038/ng.2335. [DOI] [PMC free article] [PubMed] [Google Scholar]
- Takahashi Y, Nagata N, Kawata M. Antagonistic selection factors induce a continuous population divergence in a polymorphism. Heredity. 2014;112:391–398. doi: 10.1038/hdy.2013.117. [DOI] [PMC free article] [PubMed] [Google Scholar]
- Turner TL, Levine MT, Eckert ML, Begun DJ. Genomic analysis of adaptive differentiation in Drosophila melanogaster. Genetics. 2008;179:455–473. doi: 10.1534/genetics.107.083659. [DOI] [PMC free article] [PubMed] [Google Scholar]
- Villeneuve AM, Hillers KJ. Whence meiosis? Cell. 2001;106:647–650. doi: 10.1016/s0092-8674(01)00500-1. [DOI] [PubMed] [Google Scholar]
- Voelkel-Meiman K, Taylor LF, Mukherjee P, Humphryes N, Tsubouchi H, MacQueen AJ. 2013. SUMO localizes to the central element of synaptonemal complex and is required for the full synapsis of meiotic chromosomes in budding yeast. PLoS Genet. 9:e1003837. [DOI] [PMC free article] [PubMed] [Google Scholar]
- Watts FZ, Hoffmann E. SUMO meets meiosis: an encounter at the synaptonemal complex. Bioessays. 2011;33:529–537. doi: 10.1002/bies.201100002. [DOI] [PubMed] [Google Scholar]
- Weir BS, Cockerham CC. Estimating F-statistics for the analysis of population structure. Evolution. 1984;38:1358. doi: 10.1111/j.1558-5646.1984.tb05657.x. [DOI] [PubMed] [Google Scholar]
- Williamson SH, Hubisz MJ, Clark AG, Payseur BA, Bustamante CD, Nielsen R. Localizing recent adaptive evolution in the human genome. PLoS Genet. 2007;3:e90. doi: 10.1371/journal.pgen.0030090. [DOI] [PMC free article] [PubMed] [Google Scholar]
- Wilson JY. Temperature effect on chiasma frequency in the bluebell endymion nonscriptus. Chromosoma. 1959a;10:337–354. [Google Scholar]
- Wilson JY. Chiasma frequency in relation to temperature. Genetica. 1959b;29:290–303. [Google Scholar]
- Wolf PG, Soltis PS, Soltis DE. Tetrasomic inheritance and chromosome pairing behaviour in the naturally occurring autotetraploid Heuchera grossulariifolia (Saxifragaceae) Genome. 1989;32:655–659. [Google Scholar]
- Woltering D, Baumgartner B, Bagchi S, Larkin B, Loidl J, de los Santos T, Hollingsworth NM. Meiotic segregation, synapsis, and recombination checkpoint functions require physical interaction between the chromosomal proteins Red1p and Hop1p. Mol Cell Biol. 2000;20:6646–6658. doi: 10.1128/mcb.20.18.6646-6658.2000. [DOI] [PMC free article] [PubMed] [Google Scholar]
- Yant L, Hollister JD, Wright KM, Arnold BJ, Higgins JD, Franklin FCH, Bomblies K. Meiotic adaptation to genome duplication in Arabidopsis arenosa. Curr Biol. 2013;23:2151–2156. doi: 10.1016/j.cub.2013.08.059. [DOI] [PMC free article] [PubMed] [Google Scholar]
- Zanzoni A, Ausiello G, Via A, Gherardini PF, Helmer-Citterich M. Phospho3D: a database of three-dimensional structures of protein phosphorylation sites. Nucl Acids Res. 2007;35:D229–D231. doi: 10.1093/nar/gkl922. [DOI] [PMC free article] [PubMed] [Google Scholar]
- Zhang L, Wang S, Yin S, Hong S, Kim KP, Kleckner N. Topoisomerase II mediates meiotic crossover interference. Nature. 2014;511:551–556. doi: 10.1038/nature13442. [DOI] [PMC free article] [PubMed] [Google Scholar]
Associated Data
This section collects any data citations, data availability statements, or supplementary materials included in this article.