Abstract
Magnetic Particle Imaging (MPI) is a novel non-invasive biomedical imaging modality that uses safe magnetite nanoparticles as tracers. Controlled synthesis of iron oxide nanoparticles (NPs) with tuned size-dependent magnetic relaxation properties is critical for the development of MPI. Additional functionalization of these NPs for other imaging modalities (e.g. MRI and fluorescent imaging) would accelerate screening of the MPI tracers based on their in vitro and in vivo performance in pre-clinical trials. Here, we conjugated two different types of poly-ethylene-glycols (NH2-PEG-NH2 and NH2-PEG FMOC) to monodisperse carboxylated 19.7nm NPs by amide bonding. Further, we labeled these NPs with Cy5.5 near infra-red fluorescent (NIRF) molecules. Bi-functional PEG (NH2-PEG-NH2) resulted in larger hydrodynamic size (~98nm vs. ~43nm) of the tracers, due to interparticle crosslinking. Formation of such clusters impacted the multimodal imaging performance and pharmacokinetics of these tracers. We found that MPI signal intensity of the tracers in blood depends on their plasmatic clearance pharmacokinetics. Whole body mice MPI/MRI/NIRF, used to study the biodistribution of the injected NPs, showed primary distribution in liver and spleen. Biodistribution of tracers and their clearance pathway was further confirmed by MPI and NIRF signals from the excised organs where the Cy5.5 labeling enabled detailed anatomical mapping of the tracers.in tissue sections. These multimodal MPI tracers, combining the strengths of each imaging modality (e.g. resolution, tracer sensitivity and clinical use feasibility) pave the way for various in vitro and in vivo MPI applications.
1. Introduction
Magnetic Particle Imaging (MPI), a real-time tomographic imaging technique based on imaging magnetic nanoparticle tracers [1], is potentially useful for a wide range of biomedical applications such as cardiovascular imaging, cancer diagnosis and stem cell tracking [2-4]. The theoretically predicted spatial resolution (sub-mm) and tracer mass sensitivity (~ nanograms) of MPI, position it as a versatile and competitive medical imaging technique in comparison with other established whole body imaging modalities such as Magnetic Resonance Imaging (MRI) and Positron Emission Tomography (PET) [4, 5]. MPI signal is only generated from the superparamagnetic tracers without any signal interference from the surrounding diamagnetic tissue [6]. MPI images are derived from these positive contrast images that are tissue-depth independent [3]. Iron oxide nanoparticles (NPs) are the most preferred materials for MPI tracers due to their low toxicity, biodegradability and a history of clinical use demonstrated in a wide range of approved applications as MRI contrast agents [2, 7, 8] and blood iron supplements for patients with anemia [9].
In spite of these promising characteristics, MPI is still at an early stage in its development. In order to expedite its clinical translation, further development in both imaging hardware and tracer optimization are required [4, 6]. For example, we have shown before that the nature (Néel or Brownian) and rate of magnetic relaxation of the NPs in response to the AC magnetic fields applied in MPI scanners play a significant role in determining the resolution and signal intensity in MPI [10-12]. These relaxation mechanisms depend on the core size, monodispersity and the molecular coatings of the NPs [6, 13].
Following these initial findings, we reported a significant improvement in signal resolution and intensity using highly monodisperse NPs synthesized by a controlled thermal decomposition method, which were subsequently coated with a co-polymer of polyethylene glycol (PEG) and poly(maleic anhydride-alt-1-octadecene) (PMAO) [14, 15]. However, surface modification of these monodispersed MPI tracers is required to incorporate functionalities that enable a wide range of MPI image guided therapeutic applications [16, 17]. In particular, active surface functional groups such as amines (-NH2), carboxyls (-COOH) or thiols (-SH) can be used for conjugation of various antibodies and peptides (e.g. for targeting cancer cells [18, 19]), cationic polymers (e.g. for improved stem cells labeling [20]) or labeling of the NPs with reporter molecules of other imaging modalities (e.g. fluorescent [21] or PET [22]).
Here, we show that the addition of other imaging modalities (e.g. NIRF and MRI) to optimized MPI tracers not only enhances their imaging functionality but also helps to monitor their in vivo biodistribution and clearance more accurately. First, we used a combination of ligand exchange and PEG conjugation to make monodisperse amine functionalized MPI tracers. Then, we conjugated Cy5.5 NIRF molecules to these functional groups and evaluated their in vitro and in vivo imaging efficiency as multimodal (MPI/MRI/NIRF) contrast agents. We also show that implementation of a proper NPs surface functionalization approach can improve their multimodal imaging performance and prolong their blood half-lives. Labeling MPI tracers with NIRF molecules, which have a higher tissue penetration depth than other fluorescent molecules [23, 24], provides details of their anatomical biodistribution and intracellular pathways that will enable future cellular MPI applications [25]. Here, cross-section images of the reticuloendothelial system (RES) organs using NIRF revealed the local distribution of these tracers in each organ. The T2 MRI relaxivity of the NPs was also used for quantitative assessment of the biodistribution of these NPs.
Designing such multimodal MPI/MRI/NIRF imaging contrast agents should help open new areas for fluorescent or MRI guided application of MPI in molecular imaging. MPI's clinical safety, cost effectiveness and imaging efficacy make it a promising tool for primary diagnosis of tumors, lesions or plaques. Addition of optical imaging modalities to MPI tracers further expands their scope of applications; for instance, optically labeled MPI tracers can be used as tumor or lesion paints, which can help delineate pre-operatively detected areas from the surrounding healthy tissues using portable fluorescent detectors [26, 27]. Thus, physicians in surgery rooms can safely remove only the affected areas. The pharmacokinetic and biodistribution results presented here will help expedite the development of a new generation of MPI tracers for a wide range of intracellular in vitro and in vivo MPI applications.
2. Materials and methods
2.1. Synthesis of Cy5.5 labeled MPI tracers
All the reagents were purchased from Sigma-Aldrich (St. Louis, MO), unless mentioned specifically. The iron (III) oleate precursor, prepared according to a previously reported method [28, 29], was purified and dissolved (18 wt.%) in 1-octadecene. Briefly, iron (III) oleate was thermally decomposed at 320°C in the presence of excess oleic acid (1:18 molar ratio) [13, 30] and aged for 24h in an argon atmosphere. We used a ligand exchange approach to functionalize the surface of the NPs with carboxyl (-COOH) groups [16, 31, 32]. To purify the synthesized NPs and remove the reaction by-products, we added 10mL of the NPs to 40mL of a 1:1 (v/v) mixture of methanol and chloroform and sonicated the mixture for about 3min. The NPs were precipitated using a strong magnet. We repeated these purification steps three times and dried the purified NPs in vacuum. Purified NPs (~35mg) were then dispersed in 40mL toluene, 50μL 3-(triethoxysilyl) propyl succinic anhydride (TSP, Gelest, US) was added to it at 80°C and refluxed at 105°C for 12h under argon. The modified NPs were then purified and dispersed in 7mL tetrahydrofuran (THF).
TSP-coated NPs were further conjugated with either bi-functional (NH2-PEG-NH2) or hetero-functional (NH2-PEG-FMOC) PEG molecules (MW 5kDa, Laysan Bio, US) following the modification of our previously reported method for conjugation of bisamine PEG to carboxylated NPs (Scheme 1(a) and (b)) [16]. Briefly, 170mg PEG was dissolved in 9mL THF and added to the NPs solution. Previous reports have shown that the succinic anhydride group of TSP-coated NPs can hydrolyze and generate free carboxylic acid groups;[32] thus, 80mg of dicyclohexyl carbodiimide (DCC) coupling agent was added to facilitate amide bond formation between the carboxylic acid-functionalized NPs and amine-terminated PEG molecules. The reaction vial was filled with argon, sealed and sonicated for 16h at 50°C. The PEG conjugated NPs were washed three times with excess hexane (50mL) and separated each time using a strong magnet. The final PEG-coated NPs were dried in vacuum and dispersed in 3mL sodium bicarbonate buffer (0.1M NaHCO3, pH 8.2). A 20% solution of piperidine in N,N-dimethylformamide (DMF) solution was added to the NPs to release the FMOC protected amine groups on the surface of the NPs functionalized with hetero-functional PEG [33]. Size exclusion chromatography columns filled with s-200 Sephacryl™ gel (GE Healthcare Life Sciences, US) were used as the final purification step using 1x PBS as the eluent. The average number of the active amine groups on the surface of NPs was determined using N-succinimidyl 3-(2-pyridyldithio)-propionate (SPDP) assay [32, 34].
Scheme 1.
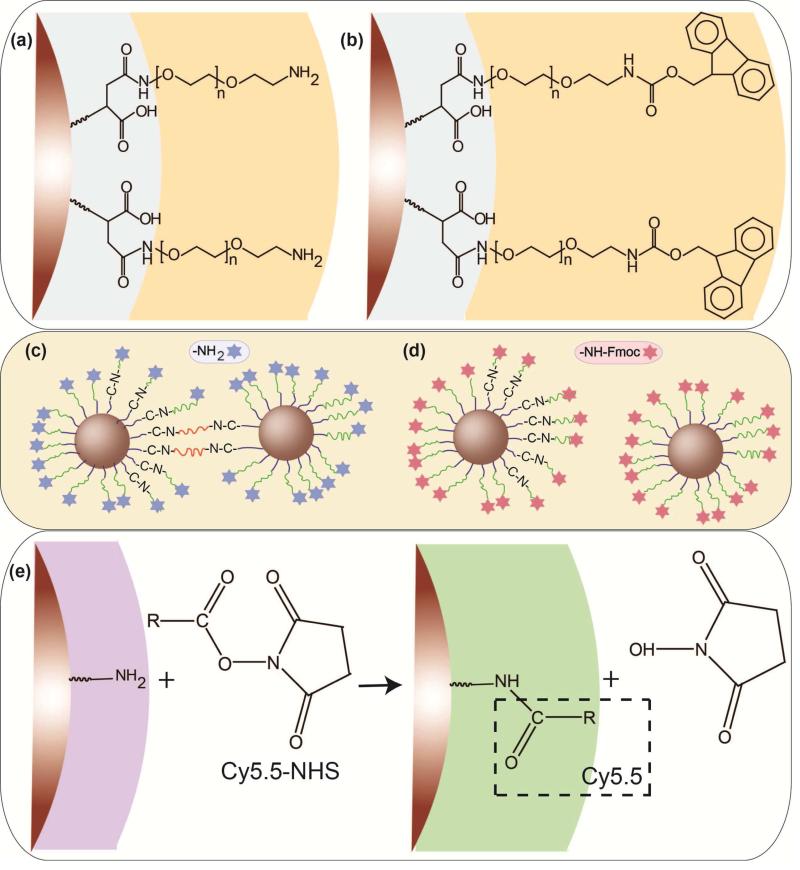
Two different surface modifications of the NPs by formation of an amide bonding between the amine groups on the PEG backbone and carboxyl groups on the surface of the silanized NPs: (a) conjugation of the bi-functional (NH2-PEG-NH2) and (b) hetero-functional (NH2-PEG-FMOC) PEG molecules. (c) Potential inter-particle bridging of some fraction of nanoparticles when bi-functional PEG is used for coating in comparison with (d) individually dispersed NPs modified with hetero-functional PEG. (e) Conjugation of amine-reactive Cy5.5 NHS ester to amine-functionalized NPs.
Cy5.5 NHS ester (amine reactive, C44H46CN3O4) near infra-red fluorescence molecules (Lumiprobe, US) were conjugated to the amine groups of the NPs using the protocol recommended by the manufacturer. The emission and excitation wavelengths of these NIRF molecules were 673 and 707nm, respectively, with a fluorescence quantum yield of 0.2. Briefly, 1mg of the dye was dissolved in fresh DMF and added to the degassed aqueous solutions of the NPs (5mg). The vials were wrapped with aluminum foil and shaken overnight. The un-reacted dye molecules were removed using S-200 columns.
2.2. Characterization of the NIRF labeled MPI tracers
We used an Inductively Coupled Plasma Atomic Emission Spectrophotometer (ICPAES, Jarrell Ash 955, US) to determine the iron concentration in each NPs solution. Dynamic Light Scattering (DLS, Zetasizer Nano, Malvern Instruments, UK) was used to measure the hydrodynamic size of the NPs. High Resolution Transmission Electron Microscope (TEM, FEI TecnaiTM G2 F20, 200 KeV, US), equipped with a Gatan CCD camera was used for analysis of the core size and morphology of the NPs. Using a room temperature Vibrating Sample Magnetometer (VSM, Lakeshore, US) we measured the magnetization, m(H), behavior of the NPs. Further, using Chantrell fitting to the magnetization curves, we determined the median core size of a statistically-significant number (100μL, ~2.65mg Fe/mL) of the NPs [35]. Weight losses of the samples were also studied after freeze-drying of the water-dispersed NPs using a thermo-gravimetric analysis system (TG, Perkin-Elmer, US). We also used a Bruker Vertex 70 Fourier transform infra-red (FTIR) spectrometer equipped with an attenuated total reflectance (ATR) unit for analysis of the surface coating of the freeze-dried NPs.
We used our home-built Magnetic Particle Spectrometer (MPS, f0 = 25kHz and μ0Hmax = 20mT) to measure the zero-dimension performance of the MNP tracers and predict their imaging characteristics in 2D and 3D MPI scanners. The details of these MPS measurement parameters can be found in our previous reports [13, 15, 36]. To measure the Cy5.5 fluorescence signal of the NPs, 50μL of the NPs with different concentrations were added to 96-well clear bottom plates and the plates were scanned using an Odyssey NIRF instrument (LI-COR, US), using the 700nm channel with excitation and emission wavelengths of 685 and 705nm.
2.3. Animal experiments
Female CD-1 mice (25-35g, 8 weeks old) were purchased from Charles River Laboratories and used for the in vivo studies. We used 36 mice for blood circulation studies and 9 mice for biodistribution studies. All the animal studies were reviewed and approved by the Institutional Animal Care and Use Committee (IACUC) of the University of Washington. All the animal study data are expressed as mean ± standard deviation (SD).
2.4. Pharmacokinetics studies
Anesthetized mice were injected with NPs (100μL, 2mg Fe/mL) through their tail veins. Blood samples were collected retro-orbitally at ~ 0 (immediately after injection), 5, 10, 15, 20, 30, 45 and 60 mins after injection. The blood samples were stored in anticoagulant EDTA coated vials and then transferred into 100 μL polycarbonate capsules for VSM and MPS studies. Two samples were collected from each mouse, after which the animals were euthanized immediately. Three blood samples were prepared for each blood-draw time point. The VSM and MPS measurements were repeated three times for each sample and the results were averaged. In most of the measurements the standard deviation values were very small and not observable on the presented graphs. The average saturation magnetization obtained from the VSM and the average signal intensity determined from the MPS measurements were compared with the standard calibration lines generated from the NPs prior to injection to assess the amount of the NPs in the blood after normalization to mouse weight (kg). The average amounts of the NPs in blood samples were plotted versus post-injection time and the blood circulation half-life was determined from the exponential decay curve generated for each type of NPs. The half-lives determined from VSM (static magnetic field) and MPS (AC magnetic field, f0 = 25kHz) were compared to check the consistency of the results.
2.5. Blood phantoms imaging
For MPI imaging of the blood samples, 100μL of the blood was transferred into polycarbonate capsules and placed in the center of the centrifuge tubes as shown in Fig. S1. MPI images of the blood phantoms were acquired with the projection Field Free Line (FFL) MPI scanner at UC Berkeley [37, 38] operating with a magnetic field gradient strength of 2.4 T/m along x- and z-axes. The y-axis of the instrument, which corresponds to the direction of the FFL, has a significantly smaller magnetic field gradient strength of 0.08 T/m. The samples were translated along the z-axis of the imager using a single-axis translation stage (Velmex, US). Images of the blood phantoms were taken with a field of view (FOV) of 4 cm x 6 cm and acquisition time of 12 seconds. The maximum intensity of the images was then extracted for analysis.
For T2-weighted MRI imaging, the blood samples were mixed (1:1 volume ratio) with 2wt.% solution of agarose in water and cooled down in the refrigerator to 4°C to solidify. Agarose is usually considered as a tissue equivalent material for similar MRI analyses [39]. We used a 14T (600MHz) vertical bore Magnetic Resonance Spectrometer (Bruker). T2 weighted images of the blood samples were acquired by Bruker MSME T2 protocol (12 echo times; TR/TE=4000/6.28...12×6.28). ImageJ and MATLAB software were used to generate the colorized R2 images of the blood samples drawn at different times from their reciprocal T2 images.
For NIRF imaging, 50μL of the blood drawn at different post-injection times were added to wells of a 96-well clear-bottom plate and the plate was then scanned on the Odyssey NIRF scanner similar to NPs measurements.
2.6. Biodistribution studies
For biodistribution studies, mice were injected with 100μL, 1mg Fe/mL of the NPs. Three mice were used to test each type of NPs and the results were compared with control mice injected with sterile PBS (1x). Axial T2 MRI images of the mice (25 axial slices of the abdominal region, each 1mm thick) were acquired before injection and 24 and 72 hours after injection of the NPs. Using ImageJ software we determined the change in R2 values (ΔR2) in the liver, spleen and kidneys before and after injection of the NPs and calculated the amount of the NPs in each organ as follows [15]:
| (1) |
where, r2 is the NPs T2 relaxivity (mMFe−1.s−1) and C is the NPs concentration (mM Fe) in each organ. To determine the T2 relaxivity of the NPs, we mixed (1:1 volume ratio) of various concentration of the NPs (0, 2.5, 5, 10, 20 and 40μg Fe/mL) with 2wt.% agarose gel. The R2 images were generated using the same parameters described for blood phantoms. Relaxation times (r2) of the NPs were determined using the slope of their linear plot of R2 values versus iron concentration [15, 40].
NIRF images of the mice and excised organs were acquired using the in vivo imaging system (IVIS, Caliper Life Sciences, US) equipped with the Living Image software package. Images were acquired using a high lamp level (excitation and emission wavelengths of 640 and 680 nm, respectively, exposure time of 1 second and f-step at f4). MPI images of the mice were acquired using the same scanner described for blood phantom imaging, with a FOV of 4 cm x 12 cm and acquisition time of 16 seconds. For ex vivo MPS analysis, organs sections with determined weights were placed inside the 0.5mL vials and analyzed using our home-built MPS with a drive frequency, f0=25kHz. The resulting data were then normalized to tissue weight.
For histology analyses, we sacrificed the mice 72 hours after injection of the NPs and fixed the harvested organs in 10% formalin and then embedded them in paraffin. Tissue sections were then imaged following hematoxylin & eosin (H&E) and Prussian Blue (PB) staining. For ex-vivo NIRF imaging of the tissue sections, formalin fixed tissues were placed into sucrose solution (30%) at 4°C until the tissues sank. Then, the tissues were transferred to optimum cutting temperature (OCT) compound and sectioned (12μm thickness) after freezing. The sections were then imaged using the Odyssey scanner, similar to the NPs and blood phantom analyses described above.
3. Results and discussions
3.1. Synthesis and evaluation of the multimodal MPI tracers
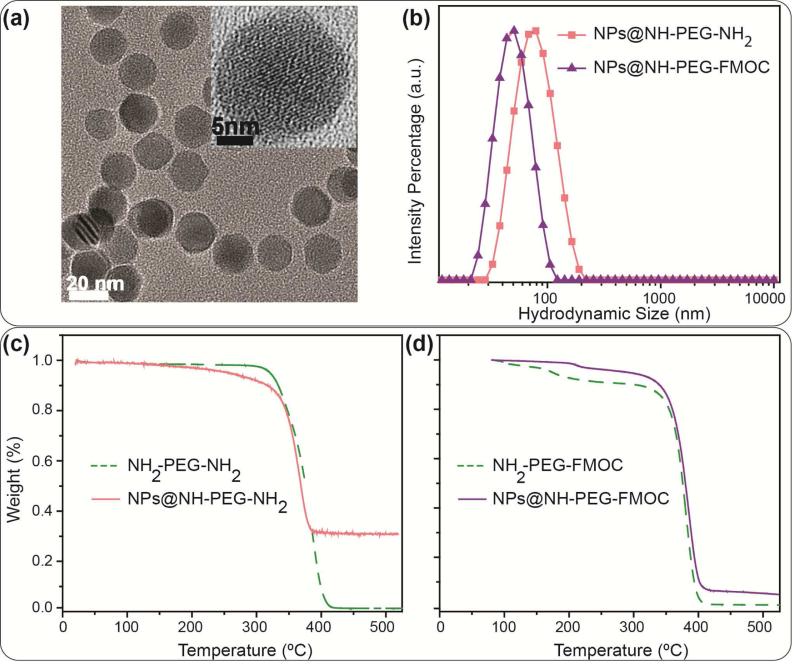
Structural, magnetic and MPS results of the two types of the NPs are summarized in Table 1. We have shown before that a well-controlled synthesis is required to synthesize monodisperse iron oxide NPs with enhanced performance as MPI tracers in comparison with other commercially available NPs such as Resovist and Feridex [1, 15]. Here, we used thermal decomposition of iron oleate in the presence of oleic acid to make highly monodisperse oleic acid capped NPs in organic solvents with the median core size of 19.7nm (standard deviation: 0.267). This core size was calculated using Chantrell fitting to the NPs magnetization curve and matched well with the TEM results (Fig. 1a) [35]. These NPs were carboxylated using a previously reported ligand exchange method[16, 31, 32]. Two PEG derivatives (bi-functional NH2-PEG-NH2 and hetero-functional NH2-PEG-FMOC) with the same PEG to NPs molar ratios were conjugated to these NPs by the formation of an amide bond between the terminating amine groups (-NH2) of the polymers and carboxyl groups (-COOH) on the surface of the silanized NPs (Scheme 1). FMOC protected amine groups were de-protected by addition of a 20% piperidine in DMF solution. Finally, amine-reactive Cy5.5 NHS ester NIRF molecules were conjugated to the amine-functionalized NPs (Scheme 1e).
Table 1.
Structural, magneto/optical and blood circulation characteristics of the two different NPs.
| Coating | Size | MPS signal | Relaxivity [s−1.mg Fe−1](a) | NIRF [a.u.](b) | Half life [min] | ||
|---|---|---|---|---|---|---|---|
| Core [nm] (σ) | Hydrodynamic [nm] (PDI) | Intensity [mv/mg Fe] | FWHM | ||||
| NH2-PEG-NH2 |
19.7 (0.27) | 98 (0.29) | 22 | 11.1 | 376.8±22 | 23 | 12-14 |
| NH2-PEG-FMOC | 43 (0.18) | 27 | 9.2 | 325.59±24 | 42 | 23-26 | |
MRI T2 relaxivity of the NPs.
NIRF signal intensity from 50μg of the NPs.
Fig. 1.
(a) TEM image showing the core size distribution and morphology of the NPs. The inset HRTEM image shows the lattice fringes of a single nanoparticle. (b) DLS intensity data showing the hydrodynamic size distribution of the NPs functionalized with NH2-PEG-NH2 and NH2-PEG-FMOC. (c) and (d) Thermogravimetric (TG) analysis data showing the weight percentage of the PEG molecules in each type of the NPs – notice the lower weight loss in NPs coated with bi-functional PEG (~70%) compared to heterofunctional PEG (~95%), suggesting a greater coating density with hetero-functional PEG. The dotted curves show the TG graphs of the pure polymers before their conjugation to the NPs; on the other hand, the TG graphs of the coated NPs represent the total weight loss due to decomposition of the conjugated polymers, silanization molecules (TSP) and any oleic acid residue on the surface of the NPs. Note that the same polymer to NPs molar ratio was used for both types of the NPs presented here.
NPs functionalized with bi-functional PEG had a larger average hydrodynamic size (~98nm) in comparison with those functionalized with hetero-functional PEGs (~43nm) (Fig. 1b). The bi-functional PEG molecules can further form amide bonds with the NPs carboxyl groups through both their terminating amine groups (Scheme 1b). Therefore, some of these bi-functional PEG molecules can form clusters by bridging between the adjacent NPs and increase the average hydrodynamic size to ~98nm. The bridging keeps the NPs close to each other and shields a major part of the carboxyl groups on the surface of the NPs, making them inaccessible to other PEG molecules. Therefore, the average number of PEG molecules that could covalently bond with the NPs carboxyl groups decreased when bi-functional PEG was used compared to the hetero-functional PEG. This was confirmed by lower weight loss percentage of bi-functional PEG coated NPs (~25% less compared to those coated with hetero-functional PEG) due to thermal decomposition of the coating polymer in TG analyses (Figs. 1c and d). Note that the oleic acid coated NPs showed only ~4% weight loss due to decomposition of the surface coating oleic acid molecules by increasing the temperature (Fig. S2). In order to prevent bridging between NPs, a hetero-functional PEG molecule with only one active amine group (the other amine was protected with a FMOC group) was used (Scheme 1d). In comparison with the bi-functional PEG, the hetero-functional PEG resulted in a denser coating as confirmed in TG analysis (Fig. 1d). ATR-IR spectroscopy of the freeze-dried samples (Fig. S3) showed characteristic peaks of PEG C-H stretch band (at ~2850 cm−1) and different vibrational modes of PEG C-O-C bonds (at around 950, 1115, 1248, 1341 and 1462 cm−1) in all samples[41, 42]. The bands at ~1646 and 1565 cm−1 showed the presence of primary amine groups or amides bands on the NPs surface, confirming the successful conjugation of PEG molecules to carboxyl groups of the silanized NPs[32]. These bands were more pronounced after releasing the FMOC-protected amine groups. Also, in previous reports, no characteristic peaks of the TSP anhydride rings were observed at around 1800-1850 cm−1, showing that they were hydrolyzed and formed carboxyl groups (~1728 cm−1) after silanization[32, 41]. Amine quantification using the SPDP assay further validated findings from TG and IR analyses – the average number of the active amine groups on the surface of the NPs was about 47% less (~97 for NH2-PEG-NH2 versus ~185 for de-protected NH2-PEG-FMOC) when bi-functional PEG was used to functionalize the NPs.
The clusters formed due to the bi-functional PEG behaved similar to larger core sizes of iron oxide and respond to the applied AC magnetic field of the MPS system at higher field values (Fig. S4a); consequently, the full width at half maximum of the field dependence of the differential susceptibility, dm/dH, increases (Fig. S4b) [13, 16, 17]. Note that dm/dH is the instrument-independent point spread function (PSF) in MPI, and is solely the contribution of the nonlinear particle response to the AC magnetic field. Therefore, the FWHM and peak height of the dm/dH curves obtained from MPS can be interpreted as the instrument-independent spatial resolution and signal intensity in ideal MPI images, respectively [13]. In a MPI scanner, a static field gradient (dH/dx) is superimposed with the AC magnetic field, and the system PSF is given by the product of dm/dH and dH/dx [4, 43].
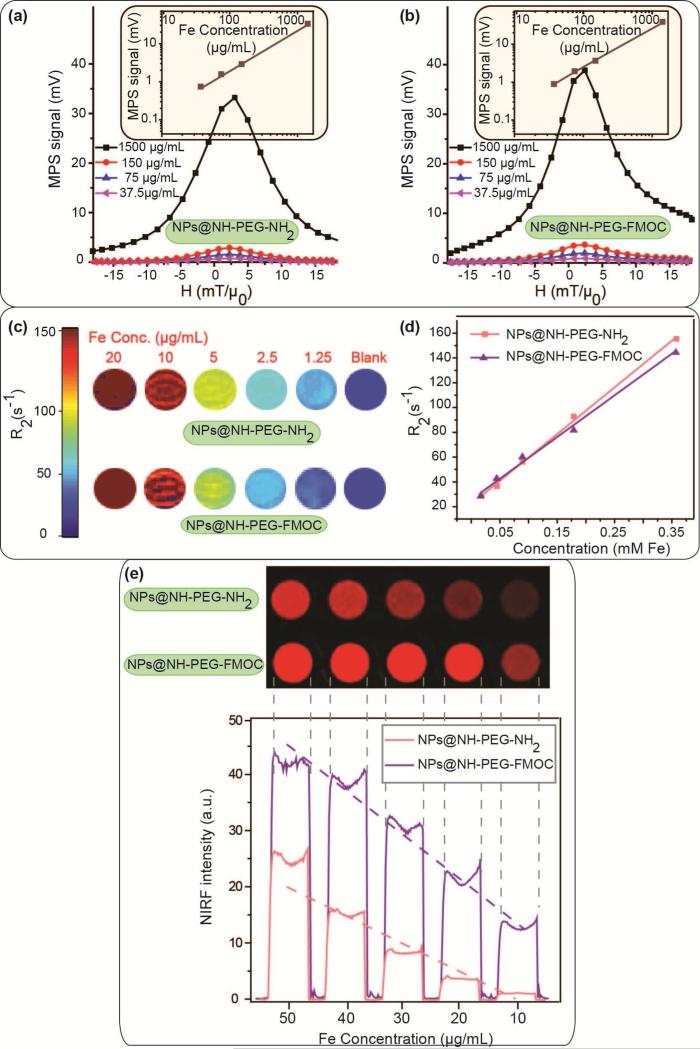
The linear dependence of the MPS signal intensity with concentration of the NPs helps determine the amount of the tracer accumulated in imaging volume (voxels) in different organs. The MPS signal intensity (maximum of dm/dH) of the Cy5.5 labeled NPs discussed above showed a linear dependence with iron concentration, ranging from 37.5 to 1500μg/mL (Fig. 2a and b). This linearity of the MPI signal intensity matches well with the linear variation of the NPs saturation magnetization (Ms) with iron concentration, as shown in Fig. S5. When used as T2 MRI contrast agents, the T2 contrast generated by NPs dispersed in agarose gel phantoms also changed linearly with iron concentration (Fig. 2c). The colorized R2 images (Fig. 2d) were then generated from the reciprocal of these T2-weighted MRI phantom images. The average R2 values of the samples were plotted as a function of iron concentration in each sample. The slope of this line is the T2 relaxivity (r2) of the NPs. The relaxivity (r2) of the NPs coated with NH2-PEG-NH2 and NH2-PEG-FMOC were calculated as 376.8±22 and 325.59±24 s−1.mg Fe−1, respectively.
Fig. 2.
Multimodal imaging performance of the NPs at different concentrations: (a) and (b) MPS (dm/dH) graphs of the NPs as representatives of their MPI performance, (c) MRI R2 maps and (d) T2 relaxivity of the NPs, and (e) NIRF images of the NPs. The signal intensities in all these imaging modalities change linearly with NPs concentration, which is critical for determining the amount of the NPs in tissues.
We also used an Odyssey NIRF scanner to determine the fluorescent signal of the NPs phantoms. Similar to MPI and MRI imaging modalities, the NIRF signal intensities of these fluorescently labeled NPs, decrease approximately linearly with dilution of the NPs concentration (Fig. 2e). The NIRF signal intensity was higher in NPs functionalized with hetero-functional PEG. This was due to presence of larger number of active amine groups on the surface of these NPs (~185 vs. 97), which increased the Cy5.5 labeling efficacy.
3.2. Pharamacokinetic studies
NPs tracers are often intravenously injected for various applications such as targeted imaging of the organs (e.g. cancers) [18, 44] and cardiovascular diseases [45]. The major part of the IV injected tracers gets rapidly eliminated from the blood stream by mononuclear phagocytizing macrophages in the reticuloendothelial (RES) system [46]. The pharmacokinetics of this phenomenon determines the blood circulation half-life of the NPs, which is a critical parameter defining the efficiency of the NPs to reach or reside in targeted organs or regions of the body [47].
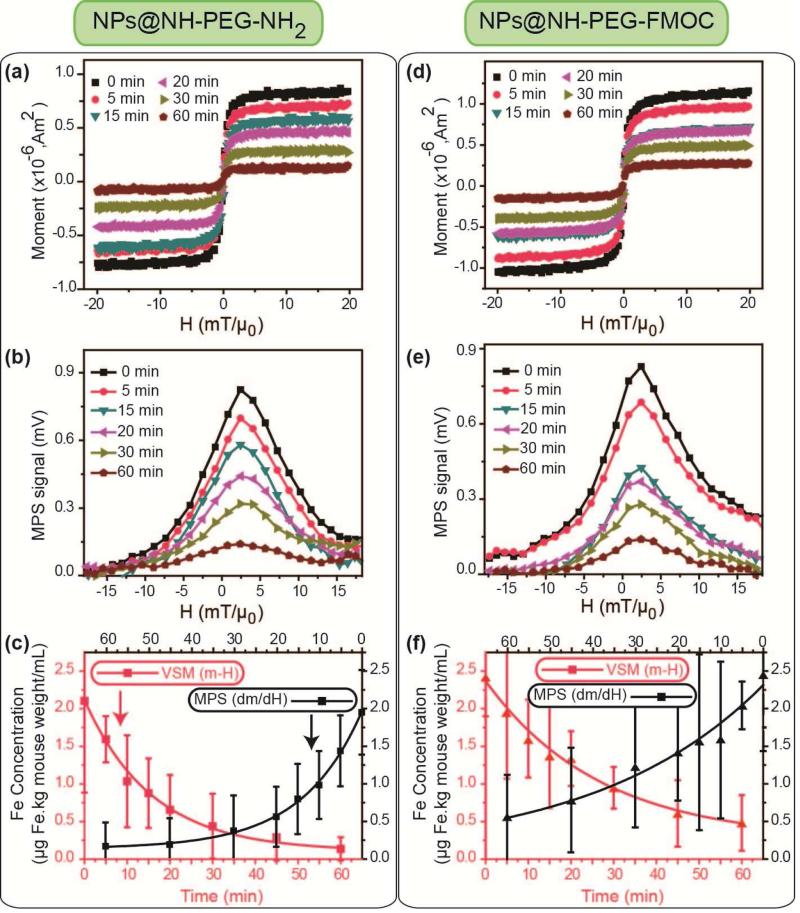
We injected the two types of the Cy5.5 labeled NPs into CD-1 female mice through tail veins (100μL, 2mg Fe/mL) and determined the NPs concentrations in the blood samples drawn retro-orbitally at different times post-injection (0 to 60 min). To find the half-lives, we measured the MPI signal intensity and saturation magnetization of the blood samples by MPS and VSM analyses, respectively (Figs. 3a, b, d and e). These values were then compared with our MPS and VSM calibration lines generated using standards prepared from the original NPs (Figs. 2a and S3) [15]. After normalizing to mice body weight (kg), we determined the half-lives of the NPs by fitting both MPS and VSM data to a first-order exponential decay model. The NPs functionalized with bi-functional amine had a blood half-life of about 12 min, while NPs functionalized with heterogeneous PEG had a longer blood half-life of about 23-26 min (Fig. 3c). This observed difference is attributed to the larger hydrodynamic size of the NPs coated with bi-functional PEG. NPs with larger hydrodynamic sizes have a considerably higher chance to get entrapped and taken up by macrophages in trabecular meshworks of the RES organs [46, 47]. Also, the half-lives determined from both MPS (f0 ~ 25kHz) and VSM techniques were consistent, suggesting that the circulating NPs were superparamagnetic without any aggregation, which would otherwise alter their responses to the applied magnetic fields.
Fig. 3.
m-H (a and d) and MPS dm/dH (b and e) graphs of the blood samples drawn retro-orbitally at different (0-60 min) post-injection times. Note that 0 min data correspond to a blood sample that was directly taken after NPs injection. (c) and (f) show the concentration of the NPs in blood samples calculated from m-H and dm/dH graphs. (a), (b) and (c) are the results of the blood analyses after injection of the NH2-PEG-NH2 modified NPs, and (d), (e) and (f) show the same results for the NH2-PEG-FMOC modified NPs. Red and black color graphs in (c) and (f) show the blood half-lives of the NPs determined by VSM and MPS data, respectively. We used the standard lines generated by NPs before the injections (Figs. 2a and S3) to determine the blood half-lives of the NPs from these blood MPS and VSM data. NPs coated with hetero-functional PEG (NH2-PEG-FMOC) showed a longer plasmatic circulation time (23-26 min) than NPs coated with bi-functional NH2-PEG-NH2 (12-14 min). All the VSM and MPS measurements were repeated three times and average graphs with standard deviations are presented here.
When NPs are unstable and form aggregates, the resulting increase in their hydrodynamic size leads to a widening of the FWHM of their MPS signal (dm/dH) (Fig. S4) [6, 14, 16]. We have shown earlier that our PEG functionalized NPs show a consistent hydrodynamic size and MPI performance over 7 days of incubation in different biological media such as PBS and DMEM cell culture media enriched with 10% fetal bovine serum (FBS) [16, 17]. However, the incubation salt concentrations, pH values and temperature, even if controlled precisely, cannot usually replicate the stability of the NPs characteristics in the presence of different plasmatic proteins and body innate immune system. Therefore, in our pharmacokinetic studies, we also focused on monitoring the FWHM of the NPs in blood samples drawn at different times, in order to evaluate their in vivo blood stability. The FWHM of the dm/dH of all the NPs were unchanged during their circulation in blood (Fig. S6). This constant FWHM implies a stable spatial resolution when these NPs are used as MPI tracers, in a wide range of applications such as cardiovascular imaging or targeted cancer imaging. These measurements uniquely show the aggregation state of the injected magnetic NPs in the blood at very low tracer concentrations, an important phenomenon that has not been detectable by other size measurement techniques such as dynamic light scattering or microscopy methods.
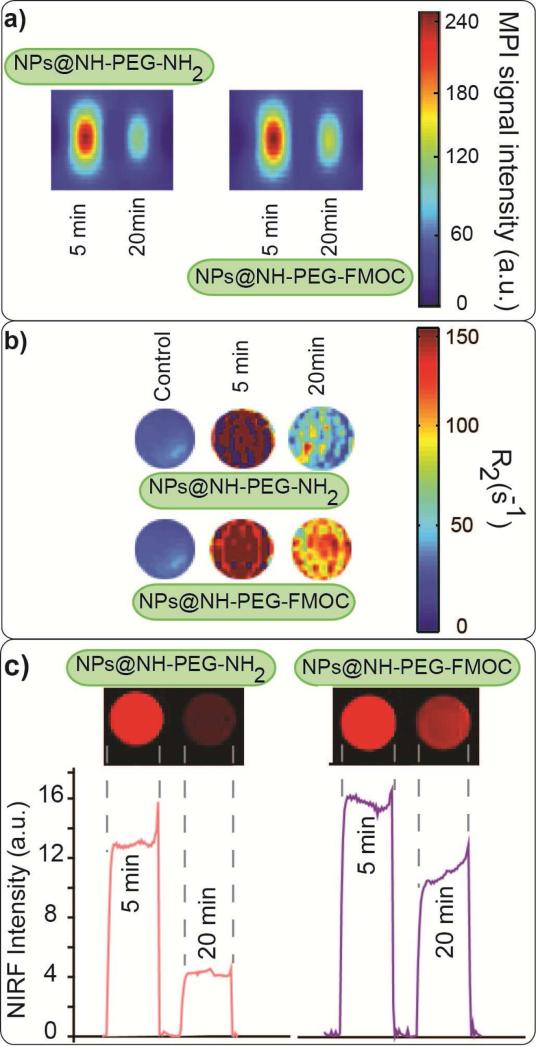
We prepared MPI, MRI and NIRF phantoms from these blood samples and studied the signal variations in each modality. Fig. 4a shows the MPI images of the blood phantoms (also see Fig. S1). The MPI signal intensity decreased 20 min after the injection of the NPs, due to elimination of the NPs from the blood. The same trends were observed in MRI T2-weighted and NIRF images (Fig. 4b and c). The rate of decrease of signal intensity was faster for NPs coated with bi-functional PEG, which had a shorter half-life (Fig. 3c) in all the three imaging modalities. Comparable trends were observed in all the imaging modalities.
Fig. 4.
Tri-modal imaging of the blood samples drawn after injection of NIRF labeled NPs functionalized with NH2-PEG-NH2 and NH2-PEG-FMOC: (a) MPI, (b) MRI R2 map and (c) NIRF images. No signal was observed in blood samples without any NPs. The signal intensity in all the three imaging modalities depends on the concentration and pharmacokinetic of the NPs in the blood plasma. NPs coated with NH2-PEG-FMOC showed stronger post-injection signals in the blood in all these three imaging modalities.
3.3. Biodistribution and toxicity studies
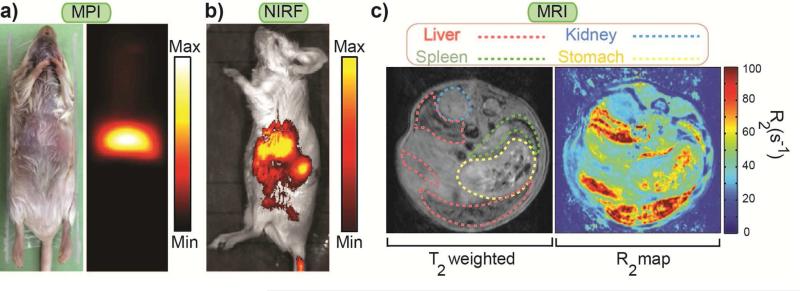
Fig. 5 shows the MPI image of a mouse 72 hours after injection of the NPs functionalized with NH2-PEG-FMOC (100μL, 1mg Fe/mL), in comparison with its NIRF IVIS and T2-weighted and colorized R2 MRI images. We show the rest of the data for these NPs because of their longer blood half-life and better imaging performance (Figs. 2, 3 and S4b). Note that in comparison with pharmacokinetic studies, we injected lower dosage of the NPs for biodistribution studies to avoid quenching of the T2 MRI images of the liver and spleen due to presence of high concentration of NPs [15]. The images show that the NPs accumulated in liver and spleen. This was because of the dominant role of the Kupffer cells in liver and splenic macrophages in spleen in recognizing and taking up the NPs [46].
Fig. 5.
Whole mouse body imaging 72 hours after injection of NPs functionalized with NH2-PEG-FMOC: (a) colorized MPI (b) NIRF and (c) MRI T2 weighted and colorized R2 images. These three imaging modalities show that injected NPs were accumulated in the principal RES organs (i.e. liver and spleen). MPI generates a positive contrast image directly originated form the superparamagnetic NPs without any background noise from surrounding diamagnetic tissues. The NIRF image generated from the tissue penetrating signals of the Cy5.5 molecules and the negative contrast T2-weighted MRI images confirm the MPI biodistribution observations. These complementary modalities can be used for more accurate targeted imaging of the organs (e.g. tumors) in future.
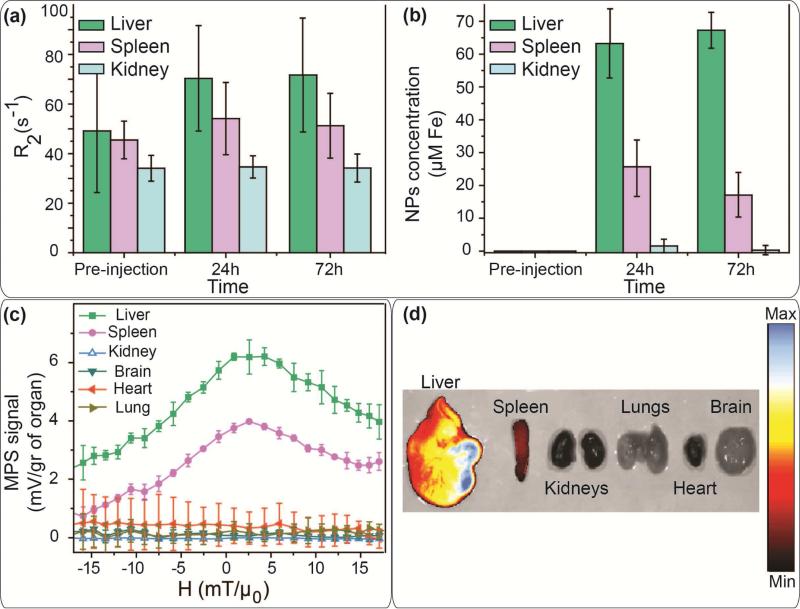
Cross-modal imaging functionality of these tracers enabled us to track their biodistribution and pharmacokinetic pathways by means of different techniques and protocols developed based on the strengths of each imaging modality. While each one of these imaging tools can reveal specifically relevant information about the fate of the injected NPs, combination of all their complementary results helps to track them more precisely in the body and therefore ensure higher levels of safety evaluation. For example, here for quantitative biodistribution studies we used the relative change of the contrast and the rate of T2 relaxivity decay in axial slices across the abdomen (Figs. 6a and b). We compared the change of relaxivity of different organs in T2-weighted MRI images of the live mice before and after injection of the NPs, to calculate the amount of the NPs in each organ over this 72 hours post-injection time (Figs. 6a and S7). The NPs were mostly observed in liver and spleen.
Fig. 6.
(a) R2 values calculated form the change of the T2 contrast of the organs in live mice used for calculation of the concentration of the NPs functionalized with NH2-PEGFMOC in each organ (b). Biodistribution of these NPs determined by (c) MPS and (d) IVIS NIRF scanning of the excised organs of the mice sacrificed 72 hours after injection of the NPs. MPS, NIRF and MRI results show a similar mice biodistribution pattern for the injected NPs. A major part of the NPs were accumulated in liver. The remaining fraction of the NPs was detected in spleen, without any signal in kidney, brain, heart and lungs.
The ex vivo MPS and NIRF IVIS analyses of the excised organs (Figs. 6c and 6d) also confirmed the MRI biodistribution results. A high intensity NIRF signal was observed in the liver in comparison with the spleen. Other organs (kidneys, lung, heart and brain) did not show any fluorescent signal. These results were also confirmed when we used an Odyssey scanner to detect the fluorescent signal in 12μm sections of these organs. Our MPS system also did not detect any magnetic response from the excised lung, heart, brain and kidney. However, similar to other modalities, we observed a strong MPS signal generated from the liver and spleen. The NIRF and MPS signals from other excised organs were statistically indistinguishable from the background.
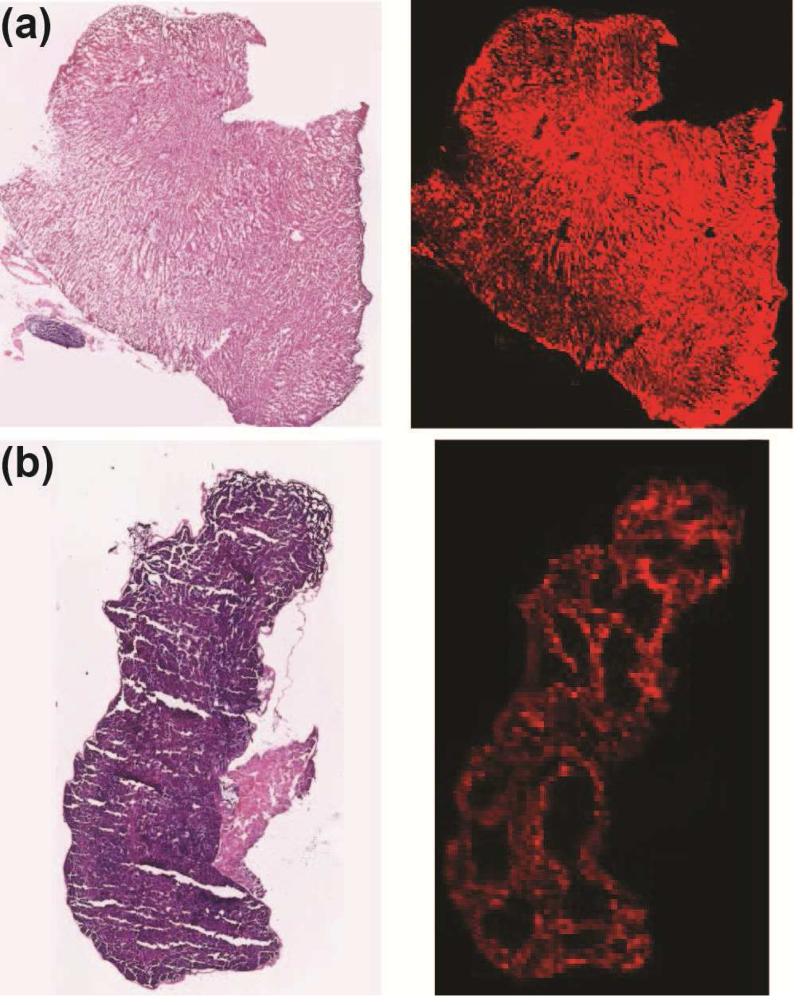
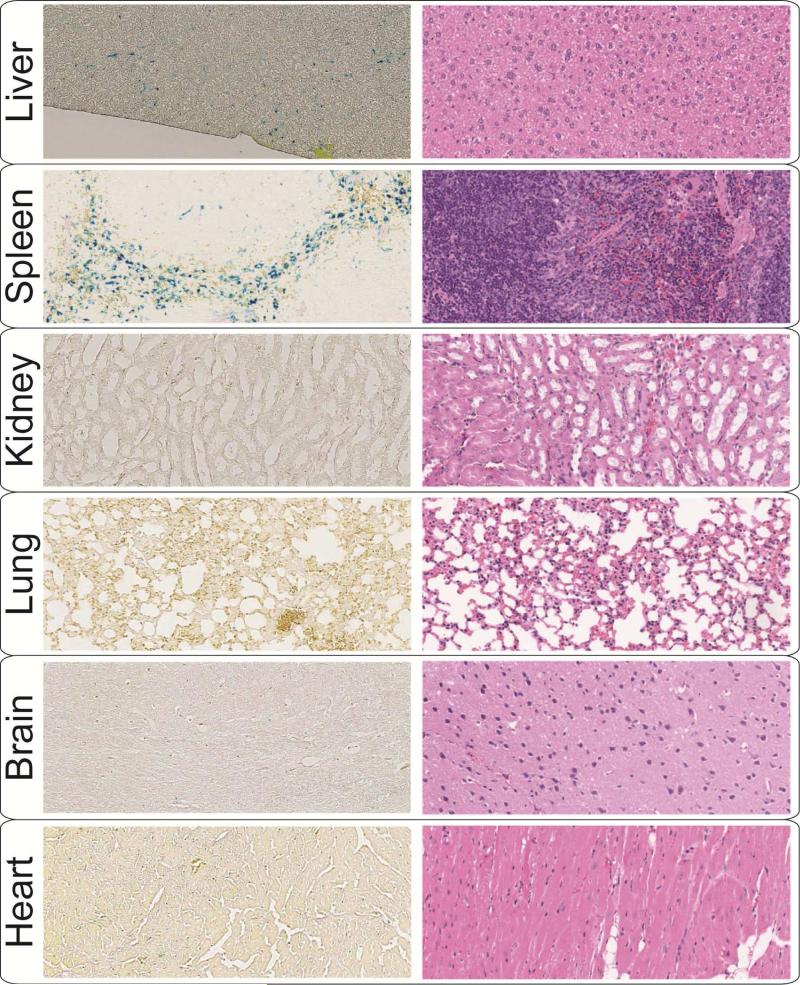
High magnification NIRF images of the 12μm cross-sections of the liver and spleen revealed more microstructural details of the NPs biodistribution in the liver and spleen (Fig. 7). This NIRF slice-imaging assay delineates, with anatomic resolution, smaller areas in these organs with higher percentage of the NPs. Such information would be missed by other imaging methods that involve whole organ imaging or homogenization of the organs. Here, the NIRF images of the liver and spleen sections, obtained from the Odyssey scanner are compared with the optical microscope images of their H&E stained counterpart slices. As shown in Fig. 7a, the NPs were almost homogeneously distributed in liver section. However, in the spleen, they were only observed in the red pulp and marginal zones, without any inter-diffusion into the white pulp regions (Fig. 7b). Such distribution is observed because spleen arteries direct the NPs and other blood components to regions where the resident splenic macrophages uptake NPs – red pulp and marginal zone. On the other hand, the white pulp is mainly composed of lymphatic tissue and does not show any uptake of NPs. These distribution patterns also confirm the high rate of the NPs uptake by macrophages in these RES organs [48]. The Prussian Blue (PB) stained histology results (Figs. 8 and S8a) also show consistent biodistribution results, when compared with control PBS injected mice (Fig. S8b).
Fig. 7.
Optical microscope images (left) of H & E stained liver (a) and spleen (b) sections (12μm thickness slices) in comparison with their NIRF images (right) obtained form an Odyssey fluorescence scanner. The NIRF images show that NPs were only entrapped in the red pulp and marginal zones of the spleen. An almost uniform distribution of the NPs was observed in liver.
Fig. 8.
Optical microscope images of the Prussian Blue (left) and H&E (right) stained tissue sections. The images were used for histological evaluation of the liver, spleen, kidney, heart, lung and brain 72 hours after injection of the NPs functionalized with NH2-PEG-FMOC. Comparison of these Prussian Blues stained sections with PBS-injected control tissues (Fig. S8a) confirm the results of Fig. 6, showing that the NPs were mostly accumulated in RES organs (liver and spleen). The typical H&E images of the tissue sections show that the NPs did not cause any abnormal toxicity-related feature in these organs 72 hours after injection.
No symptoms of NPs toxicity (e.g. weight loss and behavioral changes) were observed among the injected mice during this period. H&E stained tissue sections of the liver, spleen, kidneys, lungs, heart and brain were also reviewed to find any unusual microstructural feature due to injection of the NPs (Figs. 8 and S8a). Despite the relatively high levels of the NPs in liver and spleen, no visible abnormalities were found in these organs, when compared with control mice organs. Overall, the preliminary toxicity evaluations show that the NPs were well tolerated by the rodents.
4. Conclusions
The predicted high resolution and tracer mass sensitivity of MPI make it a potentially effective bio-imaging technique. However, enhancement of resolution and sensitivity in MPI demands synergistic efforts aimed at advancing both currently available scanners and NPs tracers as contrast agents. In the latter case, MPI signal intensity and spatial resolution are highly dependent on the size selectivity and monodispersity of the core and hydrodynamic sizes of NPs. Here, we used a controlled synthesis method to make highly monodispersed NPs functionalized with amine groups. We used these amine groups as conjugation sites for labeling of the NPs by Cy5.5 near infrared fluorescent molecules. Then, we explored the performance of these NPs as multimodal (MPI/MRI/NIRF) contrast agents. The combination of MPI, MRI and NIRF imaging modalities enabled us to monitor the biodistribution and pharmacokinetics of our MPI tracers with anatomical precision. MRI enabled quantitative mapping of NPs distributed in different organs after administration in mice. Tissue penetration and signal stability of the NIRF technique also provided more detailed anatomical information about the pathway of the MPI tracers in organs. For example, the high-resolution NIRF images of the spleen sections showed the NPs accumulation only in red pulp and marginal zones of the white pulp. Therefore, by using these novel types of the MPI tracers, the key pharmacokinetic and biodistribution information can be obtained from a reduced number of animal experiments by only a single MPI tracer administration. These improvements in MPI tracers design will expedite the development of future MPI applications in cancer targeting or stem cell-labeling and tracking. However, clinical use feasibility and safety of the iron oxide nanoparticles becomes less certain with any additional surface modifications. Therefore, translation of these NPs to clinical applications will require careful toxicity studies.
Supplementary Material
Acknowledgements
This work was supported by NIH grants 1RO1EB013689-01 (National Institute of Biomedical Imaging and Bioengineering, NIBIB) and 1R41EB013520-01. We also acknowledge UW CFP and CGF funds, respectively, for partial support. MPI imaging at UCB was also supported in part by CIRM Tools and Technology Grant RT2–01893, and a UC Discovery grant. The contents of this publication are solely the responsibility of the authors and do not necessarily represent the official views of CIRM, any other agency of the State of California, the National Institute of Biomedical Imaging and Bioengineering or the National Institutes of Health. Part of this work was conducted at the University of Washington NanoTech User Facility, a member of the NSF National Nanotechnology Infrastructure Network (NNIN). HA, AK and KMK also acknowledge helpful discussions with Dr. R. M. Ferguson.
Footnotes
Publisher's Disclaimer: This is a PDF file of an unedited manuscript that has been accepted for publication. As a service to our customers we are providing this early version of the manuscript. The manuscript will undergo copyediting, typesetting, and review of the resulting proof before it is published in its final citable form. Please note that during the production process errors may be discovered which could affect the content, and all legal disclaimers that apply to the journal pertain.
Appendix A. Supplementary material
Supplementary data related to this article can be found at the end of this manuscript.
References
- 1.Krishnan KM. Biomedical Nanomagnetics: A Spin Through Possibilities in Imaging, Diagnostics, and Therapy. IEEE Transactions on Magnetics. 2010;46:2523–58. doi: 10.1109/TMAG.2010.2046907. [DOI] [PMC free article] [PubMed] [Google Scholar]
- 2.Pablico-Lansigan MH, Situ SF, Samia ACS. Magnetic particle imaging: advancements and perspectives for real-time in vivo monitoring and image-guided therapy. Nanoscale. 2013;5:4040–55. doi: 10.1039/c3nr00544e. [DOI] [PubMed] [Google Scholar]
- 3.Weizenecker J, Gleich B, Rahmer J, Dahnke H, Borgert J. Three-dimensional real-time in vivo magnetic particle imaging. Physics in Medicine and Biology. 2009;54:L1–L10. doi: 10.1088/0031-9155/54/5/L01. [DOI] [PubMed] [Google Scholar]
- 4.Goodwill PW, Saritas EU, Croft LR, Kim TN, Krishnan KM, Schaffer DV, et al. X-Space MPI: Magnetic Nanoparticles for Safe Medical Imaging. Advanced Materials. 2012;24:3870–7. doi: 10.1002/adma.201200221. [DOI] [PubMed] [Google Scholar]
- 5.Gleich B, Weizenecker J. Tomographic imaging using the nonlinear response of magnetic particles. Nature. 2005;435:1214–7. doi: 10.1038/nature03808. [DOI] [PubMed] [Google Scholar]
- 6.Ferguson RM, Khandhar A, Arami H, Hua L, Hovorka O, Krishnan KM. Tailoring the magnetic and pharmacokinetic properties of iron oxide MPI tracers. Biomedical Engineering (Biomedizinische Technik) 2013:1–15. doi: 10.1515/bmt-2012-0058. [DOI] [PMC free article] [PubMed] [Google Scholar]
- 7.Lam T, Pouliot P, Avti PK, Lesage F, Kakkar AK. Superparamagnetic iron oxide based nanoprobes for imaging and theranostics. Advances in Colloid and Interface Science. 2013;199:95–113. doi: 10.1016/j.cis.2013.06.007. [DOI] [PubMed] [Google Scholar]
- 8.Arami H, Stephen Z, Veiseh O, Zhang M. Chitosan-Coated Iron Oxide Nanoparticles for Molecular Imaging and Drug Delivery. Advances in Polymer Science. 2011;243:163–84. [Google Scholar]
- 9.Auerbach M, Pappadakis JA, Bahrain H, Auerbach SA, Ballard H, Dahl NV. Safety and efficacy of rapidly administered (one hour) one gram of low molecular weight iron dextran (INFeD) for the treatment of iron deficient anemia. American Journal of Hematology. 2011;86:860–2. doi: 10.1002/ajh.22153. [DOI] [PubMed] [Google Scholar]
- 10.Ferguson RM, Khandhar AP, Jonasson C, Blomgren J, Johansson C, Krishnan KM. Size-dependent relaxation properties of monodisperse magnetite nanoparticles measured over seven decades of frequency by AC Susceptometry. IEEE Transactions on Magnetics. 2013;49:3441–4. doi: 10.1109/TMAG.2013.2239621. [DOI] [PMC free article] [PubMed] [Google Scholar]
- 11.Ferguson RM, Minard KR, Khandhar AP, Krishnan KM. Optimizing magnetite nanoparticles for mass sensitivity in magnetic particle imaging. Medical Physics. 2011;38:1619–26. doi: 10.1118/1.3554646. [DOI] [PMC free article] [PubMed] [Google Scholar]
- 12.Goodwill PW, Tamrazian A, Croft LR, Lu CD, Johnson EM, Pidaparthi R, et al. Ferrohydrodynamic relaxometry for magnetic particle imaging. Applied Physics Letters. 2011;98:262502. [Google Scholar]
- 13.Arami H, Ferguson RM, Khandhar AP, Krishnan KM. Size-dependent ferrohydrodynamic relaxometry of magnetic particle imaging tracers in different environments. Medical Physics. 2013;40:071904. doi: 10.1118/1.4810962. [DOI] [PMC free article] [PubMed] [Google Scholar]
- 14.Ferguson RM, Khandhar AP, Arami H, Saritas EU, Croft LR, Goodwill PW, et al. Magnetic Particle Imaging with Safe, Tailored Iron Oxide Nanoparticle Tracers. IEEE Transaction on Medical Imaging. 2014 doi: 10.1109/TMI.2014.2375065. In Press. [DOI] [PMC free article] [PubMed] [Google Scholar]
- 15.Khandhar AP, Ferguson RM, Arami H, Krishnan KM. Monodisperse magnetite nanoparticle tracers for in vivo magnetic particle imaging. Biomaterials. 2013;34:3837–45. doi: 10.1016/j.biomaterials.2013.01.087. [DOI] [PMC free article] [PubMed] [Google Scholar]
- 16.Arami H, Krishnan KM. Highly Stable Amine Functionalized Iron Oxide Nanoparticles Designed for Magnetic Particle Imaging (MPI). IEEE Transactions on Magnetics. 2013;49:3500–3503. doi: 10.1109/TMAG.2013.2245110. [DOI] [PMC free article] [PubMed] [Google Scholar]
- 17.Arami H, Ferguson RM, Khandhar AP, Tomitaka A, Krishnan KM. International Workshop on Magnetic Particle Imaging (IWMPI 2013) , art. no. 6528378. IEEE Xplore; Berkeley, US: 2013. Role of biofunctionalization and tracer cross-linking in magnetic particle spectrometry. [Google Scholar]
- 18.Kievit FM, Stephen ZR, Veiseh O, Arami H, Wang TZ, Lai VP, et al. Targeting of Primary Breast Cancers and Metastases in a Transgenic Mouse Model Using Rationally Designed Multifunctional SPIONs. Acs Nano. 2012;6:2591–601. doi: 10.1021/nn205070h. [DOI] [PMC free article] [PubMed] [Google Scholar]
- 19.Veiseh O, Kievit FM, Gunn JW, Ratner BD, Zhang MQ. A ligand-mediated nanovector for targeted gene delivery and transfection in cancer cells. Biomaterials. 2009;30:649–57. doi: 10.1016/j.biomaterials.2008.10.003. [DOI] [PMC free article] [PubMed] [Google Scholar]
- 20.Schade A, Delyagina E, Scharfenberg D, Skorska A, Lux C, David R, et al. Innovative Strategy for MicroRNA Delivery in Human Mesenchymal Stem Cells via Magnetic Nanoparticles. International Journal of Molecular Sciences. 2013;14:10710–26. doi: 10.3390/ijms140610710. [DOI] [PMC free article] [PubMed] [Google Scholar]
- 21.Cho H-S, Dong Z, Pauletti GM, Zhang J, Xu H, Gu H, et al. Fluorescent, Superparamagnetic Nanospheres for Drug Storage, Targeting, and Imaging: A Multifunctional Nanocarrier System for Cancer Diagnosis and Treatment. Acs Nano. 2010;4:5398–404. doi: 10.1021/nn101000e. [DOI] [PubMed] [Google Scholar]
- 22.Glaus C, Rossin R, Welch MJ, Bao G. In Vivo Evaluation of Cu-64-Labeled Magnetic Nanoparticles as a Dual-Modality PET/MR Imaging Agent. Bioconjugate Chemistry. 2010;21:715–22. doi: 10.1021/bc900511j. [DOI] [PMC free article] [PubMed] [Google Scholar]
- 23.Raut SL, Kirthivasan B, Bommana MM, Squillante E, Sadoqi M. The formulation, characterization and in vivo evaluation of a magnetic carrier for brain delivery of NIR dye. Nanotechnology. 2010;21:395102. doi: 10.1088/0957-4484/21/39/395102. [DOI] [PubMed] [Google Scholar]
- 24.Kievit FM, Zhang MQ. Surface Engineering of Iron Oxide Nanoparticies for Targeted Cancer Therapy. Accounts of Chemical Research. 2011;44:853–62. doi: 10.1021/ar2000277. [DOI] [PMC free article] [PubMed] [Google Scholar]
- 25.Arami H, Krishnan KM. Intracellular performance of tailored nanoparticle tracers in magnetic particle imaging. Journal of Applied Physics. 2014;115:17B306. doi: 10.1063/1.4867756. [DOI] [PMC free article] [PubMed] [Google Scholar]
- 26.Hubert CG, Hansen S, Stroud M, Parrish-Novak J, Olson J. Tumor paint provides near-infrared fluorescence detection of tumor tissue in mouse models of skin cancer. Journal of Nuclear Medicine. 2013;54:10–1. [Google Scholar]
- 27.Hansen S, Stroud M, Parrish-Novak J, Jochheim C, Olson J. Evaluation of candidate near-infrared dyes for clinical translation of a tumor paint. Journal of Nuclear Medicine. 2013;54:24. [Google Scholar]
- 28.Kalele S, Narain R, Krishnan KM. Probing temperature-sensitive behavior of pNIPAAm-coated iron oxide nanoparticles using frequency-dependent magnetic measurements. Journal of Magnetism and Magnetic Materials. 2009;321:1377–80. [Google Scholar]
- 29.Narain R, Gonzales M, Hoffman AS, Stayton PS, Krishnan KM. Synthesis of monodisperse biotinylated p(NIPAAm)-coated iron oxide magnetic nanoparticles and their bioconjugation to streptavidin. Langmuir. 2007;23:6299–304. doi: 10.1021/la700268g. [DOI] [PubMed] [Google Scholar]
- 30.Khandhar AP, Ferguson RM, Simon JA, Krishnan KM. Tailored magnetic nanoparticles for optimizing magnetic fluid hyperthermia. Journal of Biomedical Materials Research Part A. 2012;100A:728–37. doi: 10.1002/jbm.a.34011. [DOI] [PMC free article] [PubMed] [Google Scholar]
- 31.Zhu MQ, Chang E, Sun JT, Drezek RA. Surface modification and functionalization of semiconductor quantum dots through reactive coating of silanes in toluene. Journal of Materials Chemistry. 2007;17:800–5. [Google Scholar]
- 32.Fang C, Bhattarai N, Sun C, Zhang MQ. Functionalized Nanoparticles with Long-Term Stability in Biological Media. Small. 2009;5:1637–41. doi: 10.1002/smll.200801647. [DOI] [PMC free article] [PubMed] [Google Scholar]
- 33.Hwang DW, Ko HY, Lee JH, Kang H, Ryu SH, Song IC, et al. A Nucleolin-Targeted Multimodal Nanoparticle Imaging Probe for Tracking Cancer Cells Using an Aptamer. Journal of Nuclear Medicine. 2010;51:98–105. doi: 10.2967/jnumed.109.069880. [DOI] [PubMed] [Google Scholar]
- 34.Veiseh O, Sun C, Fang C, Bhattarai N, Gunn J, Kievit F, et al. Specific Targeting of Brain Tumors with an Optical/Magnetic Resonance Imaging Nanoprobe across the Blood-Brain Barrier. Cancer Research. 2009;69:6200–7. doi: 10.1158/0008-5472.CAN-09-1157. [DOI] [PMC free article] [PubMed] [Google Scholar]
- 35.Chantrell R, Popplewell J, Charles S. Measurements of particle size distribution parameters in ferrofluids. IEEE Transactions on Magnetics. 1978;14:975–7. [Google Scholar]
- 36.Ferguson RM, Khandhar AP, Krishnan KM. Tracer design for magnetic particle imaging. Journal of Applied Physics. 2012;111:07B318. doi: 10.1063/1.3676053. [DOI] [PMC free article] [PubMed] [Google Scholar]
- 37.Konkle JJ, Goodwill PW, Carrasco-Zevallos OM, Conolly SM. Projection Reconstruction Magnetic Particle Imaging. IEEE Transactions on Medical Imaging. 2013;32:338–47. doi: 10.1109/TMI.2012.2227121. [DOI] [PMC free article] [PubMed] [Google Scholar]
- 38.Goodwill PW, Konkle JJ, Zheng B, Saritas EU, Conolly SM. Projection X-Space Magnetic Particle Imaging. IEEE Transactions on Medical Imaging. 2012;31:1076–85. doi: 10.1109/TMI.2012.2185247. [DOI] [PMC free article] [PubMed] [Google Scholar]
- 39.Mitchell MD, Kundel HL, Axel L, Joseph PM. Agarose as a tissue equivalent phantom material for NMR imaging. Magnetic Resonance Imaging. 1986;4:263–6. doi: 10.1016/0730-725x(86)91068-4. [DOI] [PubMed] [Google Scholar]
- 40.Mok H, Veiseh O, Fang C, Kievit FM, Wang FY, Park JO, et al. pH-Sensitive siRNA Nanovector for Targeted Gene Silencing and Cytotoxic Effect in Cancer Cells. Molecular Pharmaceutics. 2010;7:1930–9. doi: 10.1021/mp100221h. [DOI] [PMC free article] [PubMed] [Google Scholar]
- 41.Yu WW, Chang E, Sayes CM, Drezek R, Colvin VL. Aqueous dispersion of monodisperse magnetic iron oxide nanocrystals through phase transfer. Nanotechnology. 2006;17:4483–7. [Google Scholar]
- 42.Lu CC, Bhatt LR, Jun HY, Park SH, Chai KY. Carboxyl-polyethylene glycol-phosphoric acid: a ligand for highly stabilized iron oxide nanoparticles. Journal of Materials Chemistry. 2012;22:19806–11. [Google Scholar]
- 43.Goodwill PW, Conolly SM. The X-Space Formulation of the Magnetic Particle Imaging Process: 1-D Signal, Resolution, Bandwidth, SNR, SAR, and Magnetostimulation. IEEE Transactions on Medical Imaging. 2010;29:1851–9. doi: 10.1109/TMI.2010.2052284. [DOI] [PubMed] [Google Scholar]
- 44.Wang T, Kievit FM, Veiseh O, Arami H, Stephen ZR, Fang C, et al. Targeted cell uptake of a noninternalizing antibody through conjugation to iron oxide nanoparticles in primary central nervous system lymphoma. World Neurosurgery. 2013;80:134–41. doi: 10.1016/j.wneu.2013.01.011. [DOI] [PubMed] [Google Scholar]
- 45.Chen W, Cormode DP, Fayad ZA, Mulder WJM. Nanoparticles as magnetic resonance imaging contrast agents for vascular and cardiac diseases. Wiley Interdisciplinary Reviews-Nanomedicine and Nanobiotechnology. 2011;3:146–61. doi: 10.1002/wnan.114. [DOI] [PMC free article] [PubMed] [Google Scholar]
- 46.Almeida JPM, Chen AL, Foster A, Drezek R. In vivo biodistribution of nanoparticles. Nanomedicine. 2011;6:815–35. doi: 10.2217/nnm.11.79. [DOI] [PubMed] [Google Scholar]
- 47.Albanese A, Tang PS, Chan WCW. The Effect of Nanoparticle Size, Shape, and Surface Chemistry on Biological Systems. Annual Review of Biomedical Engineering. 2012;14:1–16. doi: 10.1146/annurev-bioeng-071811-150124. [DOI] [PubMed] [Google Scholar]
- 48.Lee MJE, Veiseh O, Bhattarai N, Sun C, Hansen SJ, Ditzler S, et al. Rapid Pharmacokinetic and Biodistribution Studies Using Cholorotoxin-Conjugated Iron Oxide Nanoparticles: A Novel Non-Radioactive Method. Plos One. 2010;5:e9536. doi: 10.1371/journal.pone.0009536. [DOI] [PMC free article] [PubMed] [Google Scholar]
Associated Data
This section collects any data citations, data availability statements, or supplementary materials included in this article.


