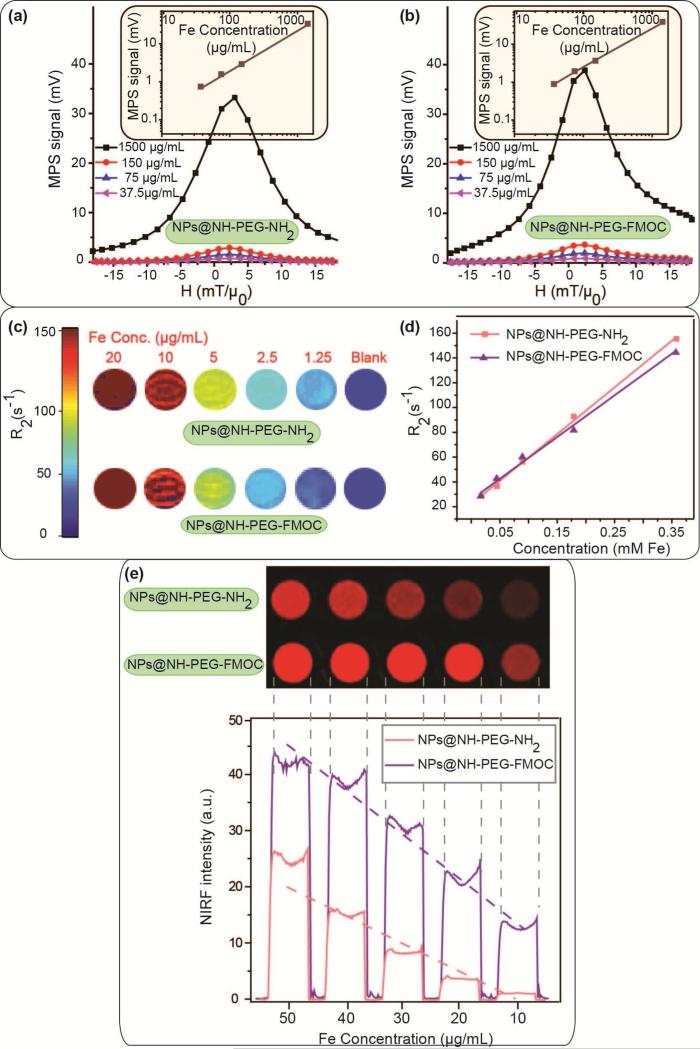
Fig. 2.
Multimodal imaging performance of the NPs at different concentrations: (a) and (b) MPS (dm/dH) graphs of the NPs as representatives of their MPI performance, (c) MRI R2 maps and (d) T2 relaxivity of the NPs, and (e) NIRF images of the NPs. The signal intensities in all these imaging modalities change linearly with NPs concentration, which is critical for determining the amount of the NPs in tissues.

