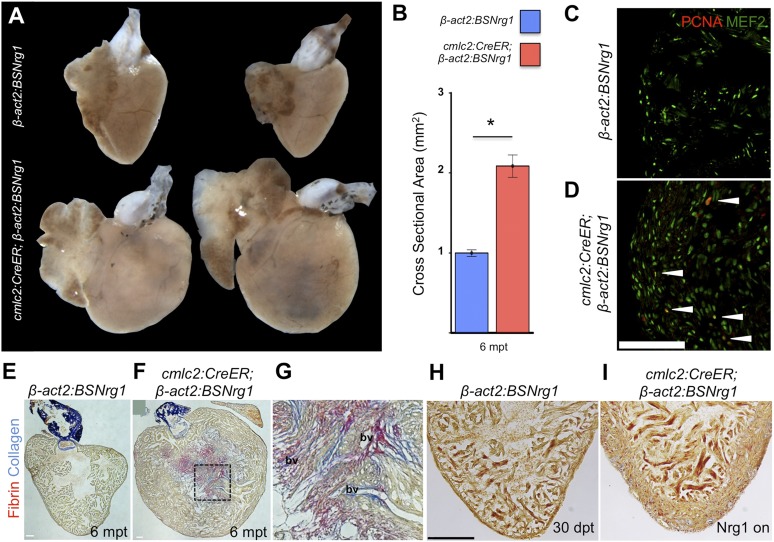
Figure 6. Nrg1-induced hyperplasia causes cardiomegaly.
(A) Whole-mount images of cmlc2:CreER; β-act2:BSNrg1 and control ventricles at 6 months post-tamoxifen treatment. (B) Quantification of the cross-sectional surface area of cmlc2:CreER; β-act2:BSNrg1 (n = 9) and control ventricles (n = 10) 6 months post-treatment, revealing cardiomegaly effects of nrg1 overexpression. Data are represented as mean ± SEM. *p < 0.05, Student's t-test, two-tailed. (C and D) Section images of ventricular walls of 6 mpt control β-act2:BSNrg1 (C) or cmlc2:CreER; β-act2:BSNrg1 animals (D) stained for Mef2+PCNA+ cells (arrowheads). Scale bar represents 100 µm. (E) Section images of control β-act2:BSNrg1 ventricles stained with Acid-Fuchsin Orange G (AFOG), revealing minimal collagen (blue), or fibrin deposition (red). Scale bar represents 100 µm. (F and G) Section images of cmlc2:CreER; β-act2:BSNrg1 ventricles stained with AFOG, revealing collagen (blue) and fibrin deposition (red) in the inner portions of the thickened ventricular wall. Image in (G) is a high-zoom view of box in (F) and also indicates two examples of large coronary vessels (bv). (H and I) Acid-Fuchsin Orange (AFOG) staining reveals minimal fibrosis in cmlc2:CreER; β-act2:BSNrg1 ventricle at 30 dpt despite the thickened ventricular wall (n = 7, 7). Scale bar represents 100 µm.

