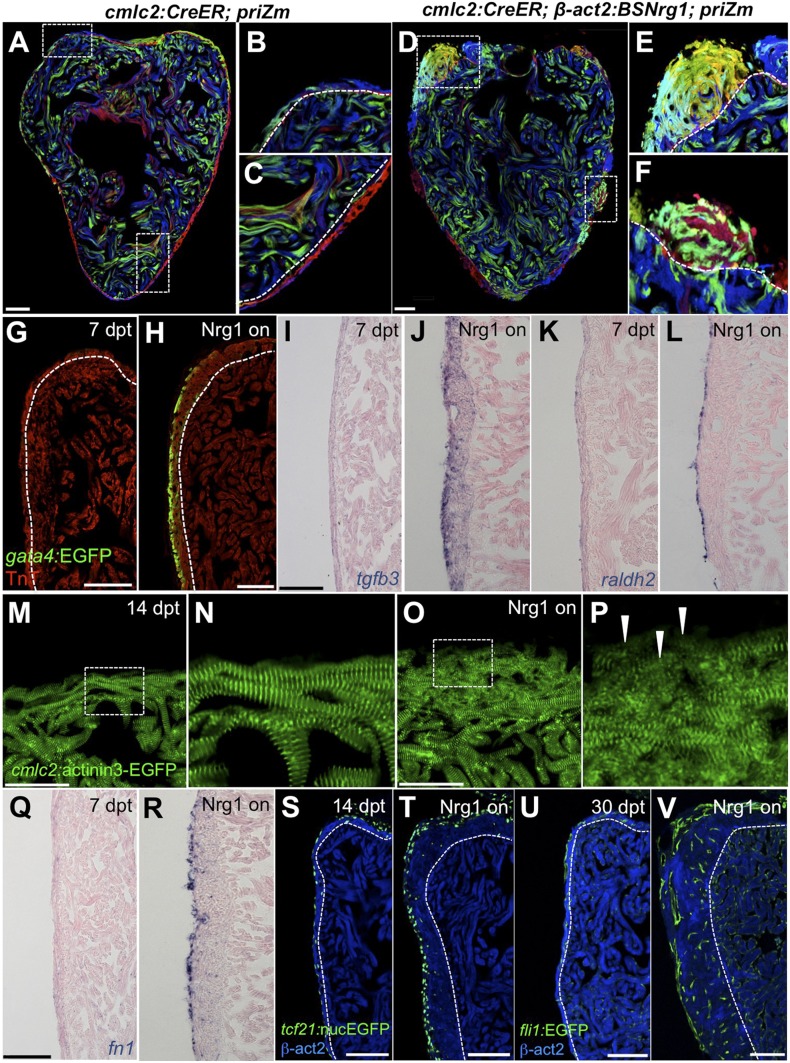
Figure 8. Nrg1 reactivation is sufficient to induce the heart regeneration program.
(A–F) Section images of ventricles from control cmlc2:CreER; priZM (A–C) and cmlc2:CreER; β-act2:BSNrg1; priZM (D–F) animals treated with tamoxifen at 5 weeks post-fertilization (wpf) and assessed at 10 wpf. Cortical myocyte clones show clear boundaries between clones in control ventricles (B and C; n = 11). During nrg1 overexpression, cortical muscle thickens appreciably via mixing and radial growth of distinct clones (E and F; n = 14). Dashed lines delineate cortical from trabecular muscle. Scale bar represents 100 µm. (G and H) Section images of ventricles from cmlc2:CreER; β-act2:BSNrg1 (Nrg1 on) and control animals at 7 days post-treatment, using animals also transgenic for gata4:EGFP. EGFP induction is clear in the cortical layer during nrg1 overexpression. Scale bar represents 100 µm. (I and J) Section images of ventricles from cmlc2:CreER; β-act2:BSNrg1 and control animals at 7 days post-treatment, visualized for tgfβ3 expression by in situ hybridization. Scale bar represents 100 µm. (K, L, Q, R) Section images of ventricles from cmlc2:CreER; β-act2:BSNrg1 and control animals at 7 days post-treatment, visualized for raldh2 (K and L) or fn1 expression (Q and R) in epicardial cells by in situ hybridization. Scale bar represents 100 µm. (M and N) Section images of the ventricular wall from cmlc2:CreER; β-act2:BSNrg1 and control animals at 14 days post-treatment, using animals transgenic for cmlc2:actinin3-EGFP. EGFP marks sarcomeric z-bands. Control animals (M) show organized sarcomeres in ventricular wall. nrg1 overexpression (O) leads to reduced EGFP fluorescence and disorganization of sarcomeres. Arrowheads point to areas of reduced EGFP intensity and sarcomere organization. Boxes in (M and O) are represented as high-zoom in (N and P). Scale bars represents 50 µm. (S and T) Section images of ventricles from cmlc2:CreER; β-act2:BSNrg1 and control animals at 14 days post-treatment, visualized for epicardial cells using a tcf21:nucEGFP transgene. nrg1 overexpression grossly increases epicardial cell presence. Scale bar represents 100 µm. (U and V) Section images of ventricles from cmlc2:CreER; β-act2:BSNrg1 and control animals at 30 days post-treatment, visualized for endothelial cells using a fli1:EGFP transgene. Increased endothelial cells and vasculature are evident in the thickened ventricular wall. Scale bar represents 100 µm.

