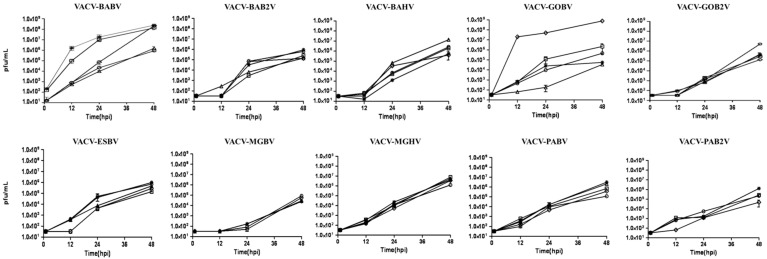
Figure 3.
Growth curves assay of VACV-BR clones in BSC-40 cells. Cells were infected at an MOI of 0.01. Viral replication was determined by measuring the viral titer at 0, 12, 24 and 48 h after viral adsorption. The legend is the same for all the graphics: clone 1 (O), clone 2 (◊), clone 3 (*), clone 4 (□), and clone 5 (∆) when present. Each data point represents the average of two independent experiments. The analysis was performed using GraphPad Prism 6.0 software (Version 5.00, GraphPad Software, San Diego, CA, USA, 2012).

