Abstract
Angiotensin I–converting enzyme (ACE) inhibitors are thought to lower blood pressure in hypertensive patients, mainly by decreasing angiotensin II (Ang II) formation. Chymase, a human mast cell protease, has recently been proposed to play a role in blood pressure regulation because of its Ang II–forming activity. Here we show that the predominant chymase mRNA species in the mouse aorta are those for types 4 and 5 isoforms, and that both are efficient Ang II–forming enzymes. Evaluation of ACE-dependent and ACE-independent Ang II–forming pathways in mast cell–deficient (Kitw/Kitw-v) mice and their mast cell–sufficient littermate (MC+/+) controls revealed that, in contrast to the latter, Kitw/Kitw-v mice fail to express chymase mRNAs in the vasculature and have almost no ACE-independent Ang II–forming activity in either isolated blood vessels or homogenates. Moreover, in MC+/+ but not in Kitw/Kitw-v mice, a contribution of ACE-independent Ang II generation to blood pressure regulation was evident by a 1.6-fold greater maximal reduction in mean arterial pressure with acute ACE inhibition plus AT1 receptor blockade than with ACE inhibition alone. Thus, mast cells are the source of the vascular ACE-independent pathway, and the antihypertensive benefit of combining ACE inhibitor therapy with AT1 receptor antagonist therapy is most likely due to negation of chymase-catalyzed Ang II generation.
Introduction
An angiotensin I–converting enzyme–independent (ACE-independent) pathway for the conversion of angiotensin I (Ang I) to the vasoconstrictor hormone angiotensin II (Ang II) was demonstrated in hamster cheek pouch blood vessels more than two decades ago (1). This pathway, which is alternate to the ACE pathway, has been demonstrated in the heart and blood vessels of several species, including humans (2–4). More recently, a mast cell chymase was identified as the major Ang II–forming pathway in the human heart (5). The significance of these studies is twofold. First, the presence of an ACE-independent pathway of Ang II formation in human cardiovascular tissues suggests that the clinical effectiveness of ACE inhibitors in lowering blood pressure may be limited, because these agents do not block chymase-mediated Ang II formation. Second, these studies suggest that AT1 receptor antagonist therapy could allow a more complete interruption of the renin-angiotensin system by blocking both ACE-dependent and -independent Ang II formation. Nevertheless, given that ACE inhibitors also affect bradykinin degradation, as well as other hormonal pathways, it remains unclear whether the ability of AT1 receptor blockers to inhibit not only ACE-dependent but also ACE-independent Ang II generation is mechanistically important in terms of their antihypertensive effects.
Although several isolated organ bath studies have shown that the Ang I vasoconstrictor response is incompletely inhibited by ACE inhibitors, in vivo studies with Ang I, where the prohormone is administered intravenously, demonstrate an abrogation of the Ang I response after ACE inhibition (6, 7). Insights into this apparent paradox have come from electron microscopy–immunohistochemistry and microdialysis studies (8–10). These indicate that chymase is localized to the interstitial compartment of the heart and blood vessels, whereas ACE is chiefly in the luminal compartment, and that circulating Ang I does not readily penetrate into the interstitial tissue compartment. In vivo evidence for chymase functionality has also come from studies with the Ang I analog [Pro11,DAla12]Ang I — a substrate for Ang II generation by chymase, but not by ACE (11, 12). Moreover, the demonstration that transgenic overexpression of an Ang II–forming rat chymase in mouse VSMCs causes hypertension, suggests that chymase regulates vascular tone (13, 14). This transgenic overexpression of a vascular chymase in mouse VSMCs, which establishes in the mouse the high ACE-independent Ang II–forming activity seen in VSMCs of spontaneously hypertensive rats, also produces vasculopathy. These pharmacological and transgenic studies show chymase functionality in vivo but do not address the question of the relative importance of the ACE-dependent versus ACE-independent pathways of Ang II formation in regulating blood pressure.
Chymase is the major Ang II–forming enzyme in human heart and blood vessels (10), which suggests that chymase deficiency should cause a loss of Ang II generated by ACE-independent pathways. Here, we show that in the vasculature of mice with genetic mast cell deficiency (Kitw/Kitw-v), expression of various chymase isoforms and ACE-independent Ang II–forming activity are markedly attenuated relative to those in their mast cell–sufficient littermate (MC+/+) controls. These findings indicate that mast cells are the main source of the vascular ACE-independent Ang II–forming pathway. Using these mice as model systems, we explore the in vivo importance of ACE-dependent and -independent pathways of Ang II formation in blood pressure regulation.
Results
Chymase-subtype expression in the aortae of MC+/+ and Kitw/Kitw-v mice.
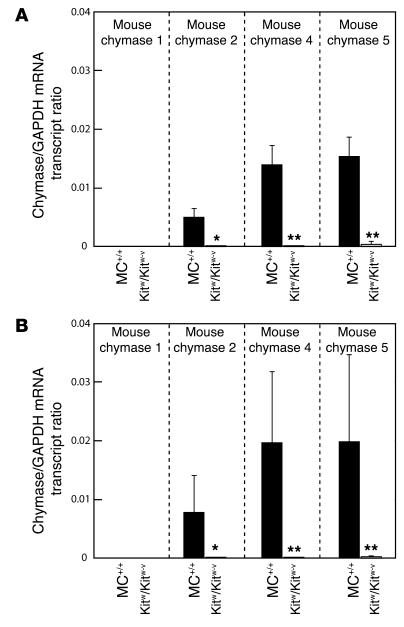
Figure 1A shows the expression of chymase isoforms in the aortae of MC+/+ mice. Transcripts for the 2, 4, and 5 isoforms were readily detected in the aortae of MC+/+ mice. However, chymase 1 mRNA, which was readily detected in the stomach (data not shown), was not readily detected in the aorta (Figure 1A). When normalized for GAPDH expression, chymase mRNA levels in MC+/+ mouse aortae were highest for isoforms 4 and 5 and two- tot threefold lower for isoform 2. However, mRNAs for these isoforms were not detected in the aortae of Kitw/Kitw-v mice (Figure 1A).
Figure 1.
GAPDH-normalized chymase 1, chymase 2, chymase 4, and chymase 5 mRNA levels in aortae from vehicle- or captopril-treated MC+/+ and Kitw/Kitw-v mice. Three-week-old MC+/+ and Kitw/Kitw-v mice were given vehicle (controls) (A) or captopril (50 mg/kg/d) (B) in drinking water for 4 weeks. Thus, all measurements are from aortae of 7-week-old mice. Values are mean ± SEM, and n = 7 in each group. Comparisons between MC+/+ and Kitw/Kitw-v mouse groups were made using the unpaired Student’s t test; *P < 0.01, **P < 0.001. In all cases, differences in transcript ratios between vehicle- and captopril-treated groups were not significant.
Ang II–forming activity of recombinant mouse chymase isoenzymes.
Because of species and subtype differences in chymase-isoenzyme kinetic properties, we investigated the Ang II–forming activity of mouse chymases detected in the aorta. Recombinant forms of mouse chymases 1, 2, 4, and 5 tagged at the C-terminus with a c-myc epitope (referred to hereafter as r-c-myc–tagged chymases 1, 2, 4, and 5) were generated and partially purified. r-c-myc–tagged chymases 1, 2, 4, and 5 were detected by Western blotting using a c-myc antibody (data not shown). r-c-myc–tagged chymase 2 was found to be inactive. r-c-myc–tagged chymases 1, 4, and 5 hydrolyzed the Phe8-His9 and Tyr4-Ile5 bonds in Ang I (DRVY®IHPF®HL; cleavage sites indicated by arrows), thus simultaneously forming and then degrading the generated Ang II (DRVYIHPF) (data not shown).
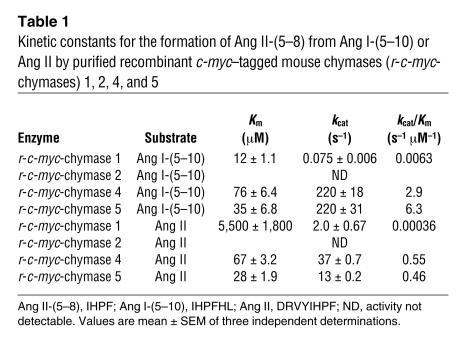
Because Ang I is degraded at two sites, it became difficult to define the net Ang II–forming activity of these recombinant mouse chymases using Ang I alone as a substrate. We addressed this issue by studying the kinetics of Ang II formation and of degradation separately, using the Ang I fragments Ang I-(5–10) (IHPF®HL) and Ang II (DRVY®IHPF), respectively, as substrates. r-c-myc–tagged mouse chymases cleave these substrates at a single site (indicated by the arrow). Conversion of Ang I-(5–10) to Ang II-(5–8) is expected to reflect the potential of the chymases to convert Ang I to Ang II, because the P4 to P1 and P1′ to P2′ residues of the substrate are known to be crucial in determining catalytic specificity (15, 16). In Ang I-(5–10) and Ang I, the substrate P4 to P1 residues (i.e., IHPF) and P1′ to P2′ residues (i.e., HL) are identical. Table 1 summarizes the kinetic constants for Ang I-(5–10) and Ang II hydrolysis. The specificity constant (turnover number [kcat]/Km) ratios for Ang II formation/Ang II degradation for r-c-myc–tagged mouse chymases 1, 4, and 5 are 17:1, 5:1, and 13:1, respectively; thus, these mouse chymase subtypes are net Ang II–forming enzymes. The specificity constants for the hydrolysis of the Phe8-His9 bond in Ang I-(5–10) by r-c-myc–tagged chymases 4 and 5 were more than 460-fold higher than that for r-c-myc–tagged chymase 1.
Table 1.
Kinetic constants for the formation of Ang II-(5–8) from Ang I-(5–10) or Ang II by purified recombinant c-myc–tagged mouse chymases (r-c-myc-chymases) 1, 2, 4, and 5
Vascular ACE-dependent and -independent pathways of Ang II formation in vitro in MC+/+ and Kitw/Kitw-v mice.
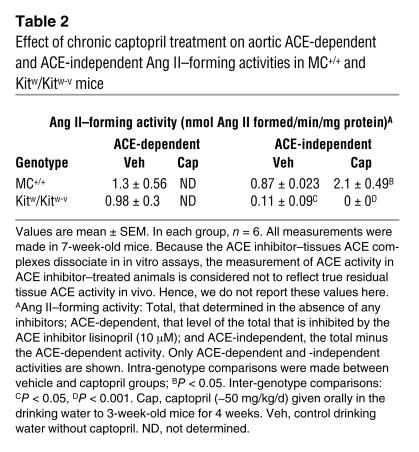
To study the effect of mast cell deficiency on vascular ACE-dependent and -independent Ang II–forming pathways, we examined the effect of ACE inhibition on the Ang II–forming activity of aortic homogenates from MC+/+ and Kitw/Kitw-v mice. The ACE-dependent Ang II–forming activity was 1.5-fold higher than the ACE-independent activity in MC+/+ aortic homogenates (Table 2). In contrast, in the Kitw/Kitw-v mouse, the aortic ACE-dependent Ang II–forming activity was about 8.9-fold higher than the ACE-independent activity (Table 2). Total Ang II–forming activity (ACE-dependent plus ACE-independent) was 1.9-fold higher in MC+/+ mouse aortic homogenates than in Kitw/Kitw-v mouse aortic homogenates (P < 0.05), and this difference was almost entirely due to an approximately eightfold higher ACE-independent Ang II–forming activity in MC+/+ mouse aortae than in Kitw/Kitw-v mouse aortae (Table 2).
Table 2.
Effect of chronic captopril treatment on aortic ACE-dependent and ACE-independent Ang II–forming activities in MC+/+ and Kitw/Kitw-v mice
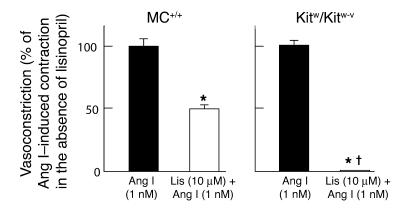
To determine whether the greater dependence of mast cell–deficient mice on ACE for their vascular Ang II generation in vitro influences the enzymatic pathway used for the functional conversion of Ang I to Ang II in intact blood vessels, we examined the vasoconstrictor responses of Ang I in isolated mouse carotid arteries in the presence or absence of the ACE inhibitor lisinopril. As shown in Figure 2, carotid artery contraction produced by 1 nM Ang I was approximately 50% lower (P < 0.001) in those vessels from MC+/+ mice pretreated with the ACE inhibitor lisinopril (10 μM) than in those vessels from MC+/+ mice that were naive with respect to ACE inhibition, indicating the presence of functional ACE-dependent and -independent pathways of Ang II formation in the vasculature of mast cell–sufficient mice. In contrast, in Kitw/Kitw-v mice, 1 nM Ang I–dependent constriction of isolated carotid arteries pretreated with 10 μM lisinopril was approximately 1% (P < 0.001) of that observed with 1 nM Ang I in other carotid artery preparations that were naive with respect to ACE inhibition (P < 0.001), indicating the near absence of a functional vascular ACE-independent pathway in mast cell–deficient mice.
Figure 2.
Reactivity of untreated (black bars) or lisinopril-treated (Lis; 10 μM; white bars) isolated carotid arteries from 7-week-old MC+/+ (left panel) and Kitw/Kitw-v mice (right panel) to 1 nM Ang I. Each carotid artery preparation was subjected to Ang I only once to preclude the effects of tachyphylaxis. The results are expressed as a percentage of the vasoconstrictor effect induced by 1 nM Ang I when given in the absence of ACE inhibitor pretreatment. Values are mean ± SEM, and n = 6 in each group. Comparisons between Ang I and Lis + Ang I groups were made using the unpaired Student’s t test; *P < 0.001. P < 0.001 for inter-genotype comparisons.
We further examined whether mast cell deficiency influences the vascular ACE-independent Ang II–forming pathway in isolated mesenteric arteries (resistance vessels). The difficulty of achieving complete ACE inhibition across the different vascular compartments (luminal and abluminal) in this closed system necessitated a strategy different from that used in the studies of isolated carotid artery rings (described above), in which the ACE inhibitor easily accessed both vascular compartments. We used [Pro11,DAla12]Ang I (Asp-Arg-Val-Tyr-Ile-His-Pro-Phe-His-Leu-Pro-DAla; the Ang II sequence is italicized), a chymase-selective Ang I analog that we have previously described (11). [Pro11,DAla12]Ang I takes advantage of substrate-specificity differences between ACE and chymase. In [Pro11,DAla12]Ang I, the penultimate proline makes it resistant to ACE, and the C-terminal DAla makes it resistant to carboxypeptidases. Chymase, an endopeptidase, cleaves [Pro11,DAla12]Ang I at the Phe-His bond to generate Ang II. Without this conversion, [Pro11,DAla12]Ang I is unable to bind or activate the AT1 receptor.
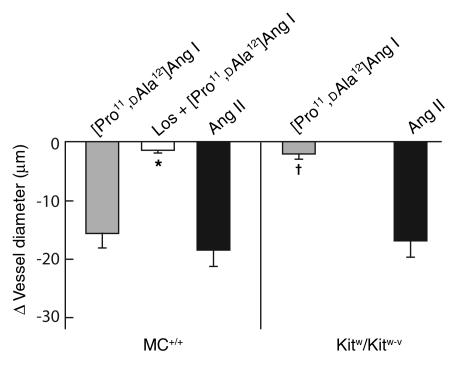
As shown in Figure 3, Ang II (1 μM, a concentration that produces maximal vasoconstriction) produced similar vasoconstrictor responses in mesenteric arteries isolated from either MC+/+ or Kitw/Kitw-v mice. In MC+/+ mouse arteries, [Pro11,DAla12]Ang I (1 μM) produced a degree of vasoconstriction that was similar to that produced by Ang II. This was reduced by more than 90% by pretreatment with the AT1 receptor antagonist losartan (10 μM), indicating that vasoconstriction by [Pro11,DAla12]Ang I was indeed due to its conversion to Ang II and, thus, that an ACE-independent pathway for Ang II generation is active in MC+/+ vasculature. In contrast to these responses in MC+/+ vessels, and consistent with the virtual abolition of an ACE-independent Ang II–forming pathway in Kitw/Kitw-v vasculature, the vasoconstrictor effect of [Pro11,DAla12]Ang I (1 μM) in Kitw/Kitw-v mesenteric arteries was 86% less than that of Ang II (1 μM).
Figure 3.
Vasoconstrictor effects of Ang II (1 μM) or [Pro11,DAla12]Ang I (1 μM) in mesenteric artery preparations from 7-week-old MC+/+ (left panel) and Kitw/Kitw-v mice (right panel). Results are expressed as the peak change in vessel diameter (μm), where a decrease in vessel diameter represents vasoconstriction. Each mesenteric artery preparation was subjected to Ang II or [Pro11,DAla12]Ang I only once to preclude the effects of tachyphylaxis. Values are mean ± SEM, and n = 5–6 in each group. Comparison between the [Pro11,DAla12]Ang I responses in mesenteric artery preparations from MC+/+ mice in the presence or absence of 10 μM losartan was made using the unpaired Student’s t test; *P < 0.001. P < 0.001 for inter-genotype comparisons.
Comparison of the acute blood pressure–lowering effect of ACE inhibitor alone versus a combination of ACE inhibitor and AT1 receptor antagonist in vivo in MC+/+ and Kitw/Kitw-v mice.
To quantify the level of resting blood pressure in anesthetized mice that is due to steady-state conversion of endogenous Ang I to Ang II by the ACE-independent pathway, we determined the difference between the maximal blood pressure–lowering effect of the ACE inhibitor captopril and that produced by a combination of captopril and the AT1 receptor antagonist losartan. The rationale for these experiments was as follows. The vasodilator effect of ACE inhibition is the result of both suppression of the effects of ACE-mediated Ang II formation, and alterations in other non-angiotensinergic mechanisms, such as inhibition of bradykinin degradation. Combined ACE inhibition and AT1 receptor blockade will additionally inhibit the actions of Ang II formed by the ACE-independent pathway. Thus, the difference in the vasodilator response between combined blockade and ACE inhibition alone is that which is attributable to Ang II generated by the ACE-independent pathway.
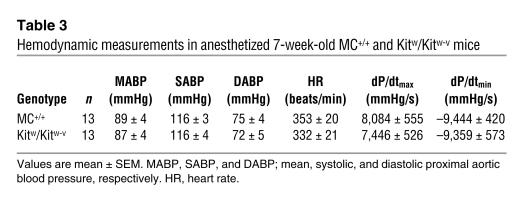
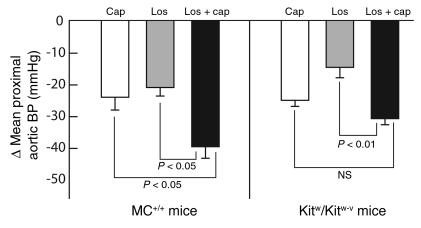
As shown in Table 3, base-line aortic blood pressure, heart rate, and cardiac contractility (dP/dtmax) were similar in anesthetized MC+/+ and Kitw/Kitw-v mice (Table 3). In the MC+/+ mice, acute administration of captopril plus losartan (2.5 mg/kg and 80 mg/kg, respectively, doses shown in initial studies to be twofold greater than those required by each agent, when given alone, to produce maximal falls in blood pressure; data not shown) resulted in a significantly greater reduction (1.6–fold) in mean aortic blood pressure than administration of captopril alone (2.5 mg/kg) (P < 0.05) (Figure 4). In contrast, in Kitw/Kitw-v mice, the difference in the blood pressure–lowering effect of combined therapy versus captopril monotherapy was not statistically significant (Figure 4).
Table 3.
Hemodynamic measurements in anesthetized 7-week-old MC+/+ and Kitw/Kitw-v mice
Figure 4.
Acute mean proximal aortic blood pressure–lowering (BP-lowering) effects of infusion of 2.5 mg/kg captopril (Cap), 80 mg/kg losartan (Los), or 2.5 mg/kg captopril combined with 80 mg/kg losartan (Los + cap) in anesthetized 7-week-old MC+/+ (left panel) and Kitw/Kitw-v mice (right panel). The data are maximal changes in mean blood pressure. Values are mean ± SEM, and n = 6–10 in each group. Intra-genotype comparisons shown in the figure were made using an unpaired Student’s t test. Inter-genotype comparisons, using an unpaired Student’s t test, were found not to be significantly different.
In both MC+/+ and Kitw/Kitw-v mice, acute administration of captopril (2.5 mg/kg) plus losartan (80 mg/kg) produced a greater (P < 0.05) fall in blood pressure than losartan alone (80 mg/kg), and the additional decrements in pressure observed with the combined agents were genotype-independent (1.9-fold in MC+/+ vs. 2.1-fold in Kitw/Kitw-v mice, P not significant) (Figure 4). These findings indicate that, at least acutely, Ang II–independent vasodilator activity of captopril is similar in both MC+/+ and Kitw/Kitw-v mice.
Effect of chronic ACE inhibition on blood pressure and aortic ACE-independent Ang II–forming activities in MC+/+ and Kitw/Kitw-v mice.
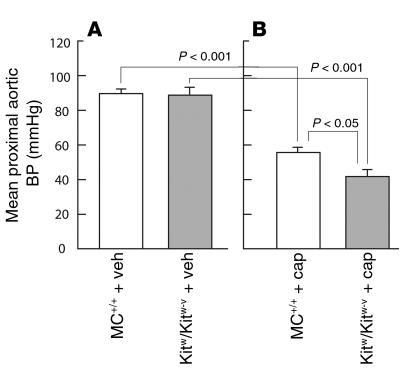
As shown in Figure 5, chronic ACE inhibition with captopril (50 mg/kg/d for 4 weeks) lowered mean proximal aortic blood pressures in both anesthetized Kitw/Kitw-v mice (53% decrease, P < 0.001) and MC+/+ mice (38% decrease, P < 0.001), although the decrements in pressure were greater in the former (1.4-fold, P < 0.05). The less marked reductions in blood pressure in the MC+/+ animals were associated with a twofold increase in ACE-independent aortic Ang II–forming activity (P < 0.05) (Table 2), a response that was not due to enhanced chymase gene expression, since steady-state mRNA levels for the 1, 2, 4, and 5 chymase isoforms remained unchanged with captopril treatment (Figure 1).
Figure 5.
Proximal aortic blood pressure (BP) in anesthetized MC+/+ and Kitw/Kitw-v mice after 4 weeks of vehicle control (veh; A) or captopril administration (cap; 50 mg/kg/d; B) in drinking water. Captopril or vehicle administration was initiated in MC+/+ and Kitw/Kitw-v mice at 3 weeks of age. Thus, all measurements are from 7-week-old mice. Values are mean ± SEM, and n = 6 in each group.
Effect of chronic ACE inhibition on blood pressure in MC+/+ and Kitw/Kitw-v mice with suprarenal aortic constriction.
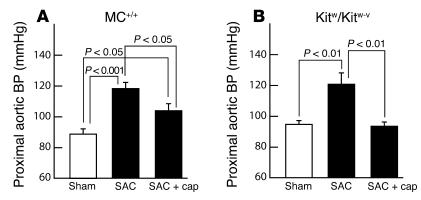
To evaluate the antihypertensive effects of chronic ACE inhibition in the setting of renin-angiotensin system activation (17), MC+/+ and Kitw/Kitw-v mice were subjected to suprarenal aortic constriction (SAC). This resulted in similar increases in mean proximal aortic blood pressure (MC+/+, +33%, P < 0.001; Kitw/Kitw-v, +27%, P < 0.01, respectively), as compared with those in the respective sham-operated controls (Figure 6). In a parallel short-term study, whereas captopril (50 mg/kg/d, orally, for 3 days) administered from the time of SAC attenuated the rise in blood pressure in MC+/+ mice by only about 50% (P < 0.05), in the Kitw/Kitw-v animals it completely prevented it (Figure 6).
Figure 6.
Effect of chronic captopril treatment (cap; 50 mg/kg/d orally; started at the time of the operation) on proximal aortic blood pressures in anesthetized 7-week-old MC+/+ (A) and Kitw/Kitw-v mice (B) 3 days after SAC (black bars) compared with sham controls (white bars). Values are mean ± SEM, and n = 6 in each group.
Discussion
Here we show that the vascular ACE-independent pathway of Ang II formation is deficient in mice with genetic mast cell deficiency, but not in their mast cell–sufficient littermate controls. Furthermore, in the former, but not the latter, the blood pressure–lowering effect of ACE inhibitor monotherapy is equivalent to that of combined ACE inhibitor plus AT1 antagonist therapy. These findings suggest an important role for the ACE-independent pathway in the physiological regulation of blood pressure.
In support of this contention, vascular ACE-independent Ang II–forming activity in aortic homogenates was about eightfold lower in Kitw/Kitw-v mice compared with their MC+/+ littermate controls. Despite electron microscopic–immunohistochemical evidence for chymase localization in the interstitial compartment of human cardiac left ventricles (8), it is possible that assays for Ang II–forming activity in tissue homogenates, while indicating overall enzymatic potential in a tissue, do not provide information on the extracellular component of the pathway. For example, in intact tissues, if mast cell Ang II–forming proteases are mainly in intracellular granules, they may not be available for the physiological conversion of Ang I to Ang II in the extracellular milieu. To specifically address this issue, we examined total and ACE-independent vasoconstrictor actions of Ang I in isolated carotid arteries. An ACE-independent vasoconstrictor effect of Ang I was not observed in Kitw/Kitw-v mice but was about 50% of the total response in MC+/+ mice. In addition, we showed that [Pro11,DAla12]Ang I, an analog of Ang I that is converted to Ang II by chymase but not ACE (11), produces a vasoconstrictor response in isolated mesenteric artery preparations from MC+/+ mice, but it is virtually inactive in identical preparations from Kitw/Kitw-v mice. Thus, the homogenate enzyme activity assays and the functional isolated organ bath studies both indicate that mast cell deficiency causes almost complete loss of vascular ACE-independent Ang II formation and, further, that resident mast cells are a constitutive source of interstitial chymase.
In a recent study, Rabinovitch and colleagues (14) showed that VSMC chymase mRNA levels are about tenfold higher in aortae of spontaneously hypertensive rats than in control Sprague-Dawley rats. Moreover, through conditional transgenic studies, they provided evidence that this vascular expression contributes to the hypertensive phenotype (13). Does a homolog of the rat VSMC chymase participate in the vascular ACE-independent pathway in MC+/+ mice? The most compelling evidence that it does not is the finding that in Kitw/Kitw-v mice, aortic ACE-independent Ang II–forming activity is, at best, only 12% of that in MC+/+ mice. It is unlikely that this minor aortic ACE-independent Ang II–forming activity is due to a homolog of rat VSMC chymase, since (a) PCR primers, specific for rat vascular smooth muscle chymase, do not amplify a homolog using MC+/+ mouse genomic DNA as a template (data not shown), and (b) the two mouse genes most closely related to rat vascular smooth muscle chymase — mouse chymases 1 and 4 (18) — are not expressed in aortae of Kitw/Kitw-v mice. Although it is possible that the minor non-ACE Ang II–forming activity that occurs in Kitw/Kitw-v mouse aorta homogenates is due to non-ACE Ang II–forming enzymes other than chymases (for example, cathepsin G and tonin), the virtual absence of an ACE-independent Ang I response in blood vessels from these animals suggests that this minor activity is not functionally important.
Kitw/Kitw-v mice have mutations in c-Kit that cause a defect in the tyrosine kinase activity of this receptor (19). This results not only in mast cell deficiency, but also in a mild anemia, an absence of skin melanocytes, and infertility (19). It is unlikely, however, that loss of ACE-independent Ang II formation in the mast cell–deficient mice is due to these extra–mast cell effects, as they are not related to blood vessel functioning.
Mast cells synthesize and secrete three main groups of enzymes: chymases, tryptases, and carboxypeptidases. Tryptases and carboxypeptidases are not Ang II–forming (18, 20). In the mouse, chymase-subtype expression in mast cells depends on their extant hormonal or cytokine environment and is thought to be a product of the state of mast cell differentiation. In the mouse aorta, mRNAs for chymase isoforms 4 and 5 predominate. In Kitw/Kitw-v mice, no chymase mRNA species are detectable, as has been reported previously (21). Chymases 1 and 4 have been demonstrated to be Ang II–forming (18), but chymase 2 lacks activity (22). Based on theoretical considerations regarding the enzyme S1 subsite, chymase 5 has been reported to be an elastase that lacks the crucial chymotrypsin-like activity necessary for the conversion of Ang I to Ang II (23). As demonstrated here, recombinant mouse chymase 2 lacks Ang II–forming activity. The 1, 4, and 5 chymase isoforms, on the other hand, do have Ang II–forming activity in in vitro assays but, unlike human chymase, also possess Ang II–degrading activity. Nevertheless, since with all three isoforms the former activity predominates, in vivo they are expected to be net Ang II–forming enzymes. Given that the specificity constant (kcat/Km) for the Ang II–forming activity of mouse chymase 1 is more than 400-fold lower than that for chymase isoforms 4 and 5, and that chymase 2 lacks activity, the 4 and 5 isoforms are likely to be the key enzymatic determinants of ACE-independent Ang II generation in mouse blood vessels. However, definitive proof of their relative roles in converting Ang I to Ang II in vivo must await the development of isoform-specific chymase inhibitors.
At the outset, the finding that blood pressure levels in Kitw/Kitw-v mice are similar to those in MC+/+ mice appeared not to support a role for the ACE-independent pathway in blood pressure regulation. However, a conclusion based solely on this finding is limited, since compensatory mechanisms, both angiotensinergic and non-angiotensinergic, could maintain blood pressure in the absence of ACE-independent Ang II generation.
To dissect out the influence of ACE-dependent from the influence of ACE-independent Ang II formation on blood pressure, we compared the acute effects of the ACE inhibitor captopril given alone, with those of this agent given in combination with the AT1 receptor blocker losartan. In both cases, we used doses that were maximally hypotensive when used alone in either Kitw/Kitw-v or MC+/+ mice. Ang II–independent blood pressure effects of ACE inhibition (e.g., on bradykinin degradation) are expected to be identical in the single-agent and combination treatments. Thus, the difference in the vasodilator effect between these two treatments in mice of a given genotype is likely to be due to ACE-independent Ang II formation.
In Kitw/Kitw-v mice, we found that the reduction in aortic blood pressure by combined ACE inhibition and AT1 blockade, though slightly greater than that caused by ACE inhibition alone, was not significantly greater. This result is expected, since biochemical and isolated organ bath studies show a near absence of a vascular ACE-independent pathway in these mast cell–deficient mice. In MC+/+ mice, the mean aortic blood pressure–lowering effect of combination therapy was 1.6-fold greater than that of ACE inhibition alone (P < 0.05). This result, combined with the demonstration of a vascular ACE-independent pathway of Ang II formation in MC+/+ mice, indicates that an Ang II–dependent but ACE-independent mechanism contributes to blood pressure regulation in MC+/+ mice. It is also of note that in human cardiovascular tissues, chymase levels are much higher than in the mouse (4, 24); this suggests an even more important role for the ACE-independent pathway in blood pressure regulation in humans than that demonstrated here in the mouse.
In these studies we also demonstrate that a chronic loss of vascular chymase is not associated with a compensatory increase in vascular ACE activity. Hence, the total Ang II–forming activity of the vessel is not normalized in mice with chronic mast cell deficiency. It is, therefore, not surprising that the acute hypotensive effects of ACE inhibition are equivalent in normotensive Kitw/Kitw-v and MC+/+ mice. In contrast to these findings, we found that chronic ACE inhibition lowered blood pressure to a greater extent in normotensive Kitw/Kitw-v mice than in MC+/+ mice. Moreover, whereas chronic ACE inhibition normalized blood pressure in Kitw/Kitw-v mice with renovascular hypertension, it was only about 50% as effective in MC+/+ mice with an equivalent degree of hypertension. The ACE-independent pathway of Ang II formation, therefore, appears to limit the vasodilator potential of chronic ACE inhibitor therapy.
Why should the vasodilator effect of chronic ACE inhibition be different from that of acute ACE inhibition in MC+/+ and Kitw/Kitw-v mice? In MC+/+ mice we found that chronic ACE inhibition causes an approximately 2.4-fold increase in vascular ACE-independent Ang II–forming activity. The mechanism of this increase appears not to be due to an increase in chymase mRNA expression levels but could be due to an increase in chymase release, an increase in tissue retention of the released chymase, and/or a decrease in degradation. In this regard, tissue retention of released chymase through ionic interactions with ECM proteins has been proposed to play an important role in determining chymase levels in the human heart (8). Chronic ACE inhibition has also been shown to increase circulating Ang I levels (25). Increases in chymase activity or Ang I levels are expected to increase vascular Ang II levels, because physiological levels of Ang I are well below the Km of chymase (5, 25). This line of reasoning suggests that limitations to the therapeutic efficacy of ACE inhibitors resulting from ACE-independent Ang II generation are not static. Rather, responses to chronic ACE inhibition are likely to be influenced by progressive compensatory increases in vascular chymase–like activity, as well as by increased production of Ang I. Thus, the contribution of the ACE-independent pathway to vascular tone could become exaggerated with chronic ACE inhibitor therapy.
Reduction in Ang II formation by ACE inhibitors, and inhibition of the cardiovascular effects of Ang II by AT1 receptor antagonists, are mechanisms exploited clinically to lower blood pressure in hypertensive patients. The demonstration that combined ACE inhibitor plus AT1 receptor antagonist therapy lowers blood pressure more effectively than does ACE inhibitor monotherapy suggests that ACE inhibitor–dependent suppression of the renin-angiotensin system is incomplete (26, 27). Based on the findings of this study, we propose that this incomplete suppression is due to the chymase pathway of Ang II formation.
Methods
Animals.
Both Kitw-v (background, C57BL/6) and Kitw (background, WB/ReJ) and their wild-type littermates were purchased from The Jackson Laboratory (Bar Harbor, Maine, USA), and two lines were maintained as the sources of the Kitw-v and Kitw heterozygotes. Mating Kitw-v heterozygotes with Kitw heterozygotes resulted in WBB6F1/J-Kitw/Kitw-v double heterozygotes (identified as having black eyes and white coat), wild-type littermates (black coat), Kitw-v/+ heterozygotes (gray with light belly and white spot, light tail), and Kitw/+ heterozygotes (black with white belly; occasional occurrence of a white spot on the head with a white streak radiating from the spot; tail with white tip). Only mast cell–deficient WBB6F1/J-Kitw/Kitw-v mice (black eyes and white coat) and their mast cell–sufficient wild-type littermate controls (black coat) were used in this study. Their phenotypes have been reviewed previously (19). Multiple (>30), synchronous breedings were initiated, according to protocols provided by The Jackson Laboratory, to generate the required numbers of male double heterozygotes and their wild-type littermates, the latter being used as controls. All procedures were performed in accordance with institutional guidelines of animal care and treatment.
Determination of chymase mRNA expression in the mouse aorta.
For the measurement of mRNA transcripts, aortae of 8-week-old MC+/+ or Kitw/Kitw-v mice were freshly dissected. Total RNA was extracted from aortae with TRIzol reagent (Invitrogen Corp., Carlsbad, California, USA). mRNA was reverse-transcribed using Transcriptor reverse transcriptase (Roche Diagnostics Corp., Indianapolis, Indiana, USA) according to the manufacturer’s protocols. Real-time PCR reactions were carried out using iCycler and iQ SYBR Green Supermix (Bio-Rad Laboratories, Hercules, California, USA). The primer sets for chymases 1, 2, 4, and 5 and GAPDH, and their PCR product sizes (in parentheses), were as follows (28): for mouse chymase 1, 5′ primer was 5′-GGAAAACTGGAG-AGAAAGAACCTAC and 3′ primer was 5′-GACAGCTGGGGACAGAATGGGG (460 bp); for mouse chymase 2, 5′ primer was 5′-ATTTCATTGCCTAGTTCCTCTGAC and 3′ primer was 5′-CAGGATGAGAACAGGCTGGGAT (525 bp); for mouse chymase 4, 5′ primer was 5′-GTAATTCCTCTGCCTCGTCCTTC and 3′ primer was 5′-GGACAGGATGGACACATGCTTT (454 bp); for mouse chymase 5, 5′ primer was 5′-GGCAGAACAAACGTGAATGAGCC and 3′ primer was 5′-AAGAACCTTCTGGAAGCTCAGGG (418 bp); and for GAPDH, 5′ primer was 5′-ATGGTGAAGGTCGGTGTG and 3′ primer was 5′-ACCAGTGGATGCAGGGAT (633 bp). In the mouse, these chymases were originally referred to as mouse mast cell proteases (MMCPs; i.e., MMCP1, MMCP2, etc.), but not all MMCPs are chymases. Here, we have retained their number designation to describe the subtype, but we refer to them as chymases (29). Real-time PCR conditions for these primers were optimized as 3 mM Mg2+, 5 pmol primer, and 50 ng cDNA in a total reaction volume of 25 μl. The amplifying conditions were determined empirically and were 95°C for 30 seconds, 62°C for 30 seconds (or 59°C for 30 seconds for GAPDH), and 72°C for 60 seconds for 45 cycles. All PCR products appeared as a single band of the expected molecular size by 1.5% agarose gel fractionation; these PCR products were cloned and sequenced to identify target cDNAs. In addition to confirming that all PCR products appeared as a single band of the expected molecular size, we also verified that each PCR product consisted of only a single species, as determined by melting-curve analysis. To determine copy number, standard curves for each target transcript were established using purified PCR products. Standard curves were linear, and the correlation coefficients were greater then 0.99.
Construction of the mouse chymase expression vectors.
cDNAs were obtained by RT-PCR from MC+/+ mouse stomach total RNA. The primers were designed to amplify the entire coding sequence and to contain restriction sites for insertion of the cDNA into the expression vector. The 5′ and 3′ primers used for amplifying mouse chymase cDNAs were 5′-ATCTCGAG- AAAAGAATTATTGGTGGTGTTGAGGCTAG and 5′-ATGCGGCCGCCTACTTGCCATTTATGACTG for mouse chymase 1; 5′-ATCTCGAGAAAAGAATTATTGGTGGTGTTGAGGCTAAAC and 5′-ATGCGGCCGCCTAGGGGCAGACTTGATGCAG for mouse chymase 2; 5′-ATCTCGAGAAAAGAATTATTGGTGGTGTTGAGTCTAG and 5′-ATGCGGCCGCTTTTCACTTCTTGCCCTTTATAA for mouse chymase 4; and 5′-ATCTCGAGAAAAGAATCATTGGAGGCACGGAGTGC and 5′-ATGCGGCCGCTTAATTCTCCCTCAAGATCTTATTG for mouse chymase 5. The cDNAs were synthesized using Transcriptor Reverse Transcriptase (Roche Diagnostics Corp.) according to manufacturer’s protocol. For all primer sets, RT-PCR was carried out at 95°C for 30 seconds, 58°C for 60 seconds, and 72°C for 60 seconds for 30 cycles. PCR products were separated on 1.5% agarose gels and then purified using QIAEX II Gel Extraction Kit (QIAGEN Inc.). These purified PCR products were ligated into pGEM-T-Easy Vector (TA vector) (Promega Corp.) and subsequently expressed in E. coli. The expressed plasmid DNAs were sequenced to confirm identity.
Pichia pastoris
expression vector pPICZα A (Invitrogen Corp.) was used to express mouse chymases. First, all the chymase genes were transferred into pPICZα A vector from TA vector using XhoI and NotI restriction cutting sites. The native N-terminus (IIGG-) of MMCP was introduced flush with the Kex2 cleavage site of the vector in order to allow endogenous activation of chymase during protein expression. To identify recombinant chymase expression in vitro, c-myc–tagged versions of the vectors were created using site-directed mutagenesis. In these constructions, coding sequences for c-myc epitope tags were introduced immediately C-terminal to the mature chymase sequence. All mutants were verified by sequencing to check for appropriate positioning of the epitope tag.
Expression of recombinant mouse chymases in P. pastoris.
Chymase cDNA inserted in pPICZα A vector DNA (5–10 μg) was linearized by digestion with BstXI. Linearized DNA was transformed into P. pastoris strain GS115 by electroporation (charging voltage 1,500 V, capacitance 25 microfarads, and resistance 400 ohms). The transformants were cultured onto YPDS plates (yeast extract peptone dextrose medium with 1 M sorbitol) containing 100, 500, or 2,000 μg/ml zeocin to select multicopy recombinants in vivo. To verify that the chymase DNA construct was integrated into P. pastoris genomic DNA, the multicopy recombinant strain, the vector-alone transformant, and the parent strain were cultured in minimal dextrose medium at 30°C for 16 hours. Genomic DNA of the cultures was isolated, and total DNA was used as a template for PCR with individual chymase-specific primers (not shown).
To determine appropriate expression conditions for the recombinants, we identified the Mut phenotypes by growing the multicopy recombinants onto MDH (minimal dextrose with histidine) and MMH (minimal methanol with histidine) plates. The Mut phenotype–determined recombinant P. pastoris strains were grown in buffered methanol-complex medium at 30°C in a shaking incubator. Methanol was added to a final concentration of 0.5% every 24 hours to maintain induction of expression. Ang I–degrading activity in the culture media was also checked every day for a week to determine the expression level of the recombinant mouse chymases.
Purification of recombinant mouse chymases.
Recombinant mouse chymase 1, 4, or 5 in the culture media was purified by ion-exchange chromatography on Bioscale Q2 HPLC columns (Bio-Rad Laboratories) using linear KCl gradients as described previously (30). Recombinant mouse chymase 2 could be detected in the culture media by Western blot analysis, but because it lacked activity it was not studied further. Mouse chymases 1, 4, and 5 each eluted in broad peaks from the ion-exchange column coincident with KCl concentrations between 0.15 and 0.4 M. Peak-activity fractions were pooled. The presence of chymase in the activity-enriched fractions was confirmed using a c-myc antibody (Santa Cruz Biotechnology Inc., Santa Cruz, California, USA) in a Western blotting protocol that detects the c-myc tag on the recombinant chymase (data not shown).
Determination of kinetic constants.
Twelve concentrations of Ang II or Ang I-(5–10) (Bachem California Inc., Torrance, California, USA) ranging from 5 to 2,000 μM were incubated with the purified recombinant mouse chymases in 20 mM Tris-HCl buffer, pH 7.5, containing 0.5 M KCl, in a total volume of 50 μl at 37°C for 30 minutes (30). Chymase concentrations were adjusted so that less than 15% of the substrate (at the lowest substrate concentration) was consumed during the assay to ensure that product formation in the assay remained linear with respect to time. The reactions were terminated by addition of 50 μl ice-cold 0.25% trifluoroacetic acid. The resulting reactions (100 μl) were applied to a C18 reverse-phase HPLC column (XTerra RP18 3.5 μm, 4.6 × 50 mm column; Waters Corp., Milford, Massachusetts, USA), which was developed using 8-minute linear gradients with acetonitrile containing 0.1% trifluoroacetic acid. The flow rate was 1 ml/min. The elution position of Ang I, Ang II, Ang I-(5–10), and Ang II-(5–8) was determined using pure synthetic angiotensin peptides as standards. The corresponding product peak areas were used to determine the amount of product formed. Km (Michaelis-Menten constant) and Vmax (maximal velocity) were calculated with nonlinear regression using the equation v = Vmax × [S]/(Km + [S]), where v is the initial rate and [S] is the substrate concentration. Correlation coefficients were mostly greater than 0.99, but never less than 0.97. The kcat (turnover number) was calculated by the formula kcat = Vmax/[E0], where [E0] is the total active-chymase concentration in the assay. The concentration of active-chymase molecules, as opposed to improperly folded and hence inactive-chymase molecules, was determined using 3H-diisopropylfluorophosphate (3H-DFP) labeling (30).
Measurement of ACE and ACE-independent Ang II–forming activities in the mouse aorta.
Aortic tissue was homogenized in 2 ml of 50 mM NaH2PO4 buffer, pH 7.4, using a Polytron homogenizer (Kinematica AG, Lucerne, Switzerland) at 9,000 rpm for 15 seconds at 4°C and centrifuged at 30,000 g for 20 minutes at 4°C, and the pellet was retained. This procedure was repeated twice. Resulting supernatant fractions, S-1 and S-2, were kept. The pellet was resuspended in 0.5 ml 50 mM NaH2PO4 buffer, pH 7.4, containing 100 mM NaCl and 10 mM MgCl2, and 5 μl of this was added to 35 μl of assay buffer (20 mM Tris-HCl, pH 8.0, containing 0.5 M KCl and 0.01% Triton X-100) containing either no further additive or 10 μM lisinopril and preincubated for 30 minutes at 0°C. Ten microliters of 1 mM Ang I was added to 40 μl of the preincubated aortic extract, and incubations were for 40 minutes at 37°C. Reactions were terminated by the addition of 300 μl ethanol. Precipitated proteins were removed by centrifugation, and the supernatant containing angiotensins was dried. The residue, resuspended in 125 μl of distilled water, was applied to a C18 HPLC column (Grace Vy-dac, Hesperia, California, USA); angiotensins were separated as described previously (30). Total and ACE-independent Ang II–forming activities were determined in duplicate from assays containing either buffer or lisinopril, respectively. ACE-dependent Ang II–forming activity was taken as total minus ACE-independent activity. Assays were optimized to ensure that Ang II generation was linear with time. With crude membrane preparations, positively charged chymases are quantitatively retained in the pellet, as is ACE, which is membrane bound. Ang II–forming activity in S-1 and S-2 was negligible.
Measurement of Ang I responses in isolated carotid artery preparations.
Carotid arteries (560–580 μm internal diameter) were dissected from 7-week-old MC+/+ or Kitw/Kitw-v mice and mounted as ring preparations (2 mm long) in the chamber of an isometric myograph (J.P. Trading, Aarhus, Denmark) as described previously (31). In this apparatus, the entire vessel ring is immersed in the bath, such that any agents added to the bath access both the luminal and abluminal surfaces. The vessel was set up at 37°C in a 15-ml bath containing physiological salt solution (PSS; composition in mM: NaCl 119, KCl 4.7, KH2PO4 1.18, MgSO4 1.17, NaHCO3 25, CaCl2 2.5, EDTA 0.026, glu-cose 5.5) saturated with 95% O2/5% CO2. Then it was stretched to an internal circumference equivalent to 90% of the internal diameter of the vessel if it had been relaxed and under a transmural pressure of 100 mmHg. Vessels were allowed to equilibrate for 1 hour and were then maximally activated with high-potassium PSS (PSS with an equimolar ex-change of KCl for NaCl; termed KPSS) and the response recorded. A new baseline was established when the high-potassium solution was washed out. The vessel was then subjected to either vehicle or 10 μM lisinopril for 15 minutes. Following this treatment, the vessels were subjected to 1 nM Ang I and the peak response recorded. We have previously shown using an ACE-selective substrate, [Pro10]Ang I, that this concentration of the ACE inhibitor is sufficient to fully inhibit ACE activity in isolated tissue preparations (32). Arteries were exposed to Ang I for 4 minutes or until a peak response had been reached, whichever was sooner, because tachyphylaxis developed even after a single dose of Ang I. In preliminary experiments (not shown), we found that 1 nM Ang I produced a submaximal vasoconstrictor response. To avoid the effects of tachyphylaxis, each artery preparation was subjected to Ang I only once. Thus, responses to 1 nM Ang I in the presence of 10 μM lisinopril (relative to the maximal KCl effect in that blood vessel) were determined in one set of isolated carotid artery preparations from MC+/+ mice, and responses to 1 nM Ang I in the absence of ACE inhibitor pretreatment (again, relative to the maximal KCl effect in that blood vessel) were obtained in a second set of isolated carotid artery preparations from MC+/+ mice. The results are expressed as a percentage of that effect caused by 1 nM Ang I in the absence of ACE inhibitor pretreatment. A parallel approach was used to study the effect of 10 μM lisinopril pretreatment on the vasoconstrictor response to 1 nM Ang I in isolated carotid artery preparations from Kitw/Kitw-v mice.
Measurement of [Pro11,dAla12]Ang I and Ang II responses in isolated mesenteric artery preparations.
Using procedures described previously (33), mesenteric artery segments (150–200 μm in internal diameter, 2–3 mm in length) were dissected from excised guts of 7-week-old MC+/+ or Kitw/Kitw-v mice anesthetized with a mixture of 100 mg/kg ketamine and 20 mg/kg xylazine. Mesenteric arteries were mounted in a pressure myograph (Living Systems Instrumentation, Burlington, Vermont, USA), and their diameters were measured by video microscopy (33). Arteries were maintained in a PSS at 37°C, pH 7.4. The pO2 was 160 mmHg and the pCO2 37 mmHg. The intraluminal pressure was set at 60 mmHg. Arterial diameters were recorded continuously. Vessels were allowed to stabilize for at least 30 minutes. Thereafter, each isolated mesenteric artery segment from an MC+/+ or Kitw/Kitw-v mouse was exposed to either 1 μM [Pro11,DAla12]Ang I or 1 μM Ang II. Each vessel was exposed only once to an angiotensin. In initial studies, we determined that 1-μM concentrations of these peptides produced maximal responses. Results are expressed as maximal reductions in resting diameter. In MC+/+ mouse isolated mesenteric arteries, in which responses to 1 μM [Pro11,DAla12]Ang I were significantly greater than base line, the mechanism of action of the [Pro11,DAla12]Ang I effect was further explored by determination of the effect of AT1 receptor antagonism by 10 μM losartan on the [Pro11,DAla12]Ang I response. [Pro11,DAla12]Ang I was purchased from Bachem California Inc.
Induction of pressure overload in MC+/+ or Kitw/Kitw-v mice.
Pressure overload was produced by constriction of the abdominal aorta (SAC). Mice were anesthetized by intraperitoneal injection of a mixture of 100 mg/kg ketamine and 20 mg/kg xylazine. The abdominal aorta was banded just above the renal vessels with a 7–0 silk suture tied around both the aorta and a blunted 29-gauge needle; the needle was then immediately withdrawn. All animals were given drinking water and food ad libitum. Eight-week-old male mice were divided into the following groups: (a) MC+/+ or Kitw/Kitw-v mice allowed to recover for 3 days after a sham operation; (b) MC+/+ or Kitw/Kitw-v mice allowed to recover for 3 days after SAC; (c) MC+/+ or Kitw/Kitw-v mice allowed to recover for 3 days after SAC but given approximately 50 mg/kg/d captopril from the time of SAC. Captopril was given in the drinking water, and the concentration in the drinking water was adjusted to about 50 mg/kg/d captopril based on the volume of fluid consumed.
Blood pressure measurements.
Proximal aortic blood pressure and dP/dt measurements were performed as described by us previously (34), in mice anesthetized intraperitoneally with 100 mg/kg ketamine and 20 mg/kg xylazine. The right femoral vein was cannulated for infusions (0.1 μl/g body weight, in <5 minutes) of captopril (2.5 mg/kg), losartan (80 mg/kg), or a combination of losartan (80 mg/kg) and captopril (2.5 mg/kg). Maximal responses were recorded.
Statistics.
Data are presented as mean ± SEM. Statistical analysis was performed using the unpaired Student’s t test or Scheffe’s test after ANOVA indicated significant differences. P values less than 0.05 were considered significant.
Acknowledgments
This work was supported in part by National Health and Medical Research Council of Australia grant 109001.
Footnotes
Ming Li and Ke Liu contributed equally to this work.
Nonstandard abbreviations used: angiotensin I (Ang I); Ang I–converting enzyme (ACE); angiotensin II (Ang II); mouse mast cell protease (MMCP); physiological salt solution (PSS); suprarenal aortic constriction (SAC); turnover number (kcat).
Conflict of interest: The authors have declared that no conflict of interest exists.
References
- 1.Cornish KG, Joyner WL, Gilmore JP. Direct evidence for the presence of a different converting enzyme in the hamster cheek pouch. Circ. Res. 1979;44:540–544. doi: 10.1161/01.res.44.4.540. [DOI] [PubMed] [Google Scholar]
- 2.Okunishi H, Miyazaki M, Toda N. Evidence for a putatively new angiotensin II-generating enzyme in the vascular wall. J. Hypertens. 1984;2:277–284. [PubMed] [Google Scholar]
- 3.Urata H, Healy B, Stewart RW, Bumpus FM, Husain A. Angiotensin II-forming pathways in normal and failing human hearts. Circ. Res. 1990;66:883–890. doi: 10.1161/01.res.66.4.883. [DOI] [PubMed] [Google Scholar]
- 4.Akasu M, et al. Differences in tissue angiotensin II-forming pathways by species and organs in vitro. Hypertension. 1998;32:514–520. doi: 10.1161/01.hyp.32.3.514. [DOI] [PubMed] [Google Scholar]
- 5.Urata H, Kinoshita A, Misono KS, Bumpus FM, Husain A. Identification of a highly specific chymase as the major angiotensin II-forming enzyme in the human heart. J. Biol. Chem. 1990;265:22348–22357. [PubMed] [Google Scholar]
- 6.Wolny A, et al. Functional and biochemical analysis of angiotensin II-forming pathways in the human heart. Circ. Res. 1997;80:219–227. doi: 10.1161/01.res.80.2.219. [DOI] [PubMed] [Google Scholar]
- 7.Zisman LS, et al. Angiotensin II formation in the intact human heart: predominance of the angiotensin-converting enzyme pathway. J. Clin. Invest. 1995;96:1490–1498. doi: 10.1172/JCI118186. [DOI] [PMC free article] [PubMed] [Google Scholar]
- 8.Urata H, et al. Cellular localization and regional distribution of an angiotensin II-forming chymase in the heart. J. Clin. Invest. 1993;91:1269–1281. doi: 10.1172/JCI116325. [DOI] [PMC free article] [PubMed] [Google Scholar]
- 9.Dell’Italia LJ, et al. Compartmentalization of angiotensin II generation in the dog heart. Evidence for independent mechanisms in intravascular and interstitial spaces. J. Clin. Invest. 1997;100:253–258. doi: 10.1172/JCI119529. [DOI] [PMC free article] [PubMed] [Google Scholar]
- 10.Dell’Italia LJ, Husain A. Dissecting the role of chymase in angiotensin II formation and heart and blood vessel diseases. Curr. Opin. Cardiol. 2002;17:374–379. doi: 10.1097/00001573-200207000-00009. [DOI] [PubMed] [Google Scholar]
- 11.Hoit B, et al. Effects of angiotensin II generated by an angiotensin converting enzyme-independent pathway on left ventricular performance in the conscious baboon. J. Clin. Invest. 1995;95:1519–1527. doi: 10.1172/JCI117824. [DOI] [PMC free article] [PubMed] [Google Scholar]
- 12.McDonald JE, et al. Vasoconstrictor effect of the angiotensin-converting enzyme-resistant, chymase-specific substrate [Pro(11)(D)-Ala(12)] angiotensin I in human dorsal hand veins: in vivo demonstration of non-ACE production of angiotensin II in humans. Circulation. 2001;104:1805–1808. doi: 10.1161/hc4001.097220. [DOI] [PubMed] [Google Scholar]
- 13.Ju H, et al. Conditional and targeted overexpression of vascular chymase causes hypertension in transgenic mice. Proc. Natl. Acad. Sci. U. S. A. 2001;98:7469–7474. doi: 10.1073/pnas.131147598. [DOI] [PMC free article] [PubMed] [Google Scholar]
- 14.Guo C, et al. A novel vascular smooth muscle chymase is upregulated in hypertensive rats. J. Clin. Invest. 2001;107:703–715. doi: 10.1172/JCI9997. [DOI] [PMC free article] [PubMed] [Google Scholar]
- 15.Sanker S, et al. Distinct multisite synergistic interactions determine substrate specificities of human chymase and rat chymase-1 for angiotensin II formation and degradation. J. Biol. Chem. 1997;272:2963–2978. doi: 10.1074/jbc.272.5.2963. [DOI] [PubMed] [Google Scholar]
- 16.Powers JC, et al. Mammalian chymotrypsin-like enzymes. Comparative reactivities of rat mast cell proteases, human and dog skin chymases, and human cathepsin G with peptide 4-nitroanilide substrates and with peptide chloromethyl ketone and sulfonyl fluoride inhibitors. Biochemistry. 1985;24:2048–2058. doi: 10.1021/bi00329a037. [DOI] [PubMed] [Google Scholar]
- 17.Akers WS, Cross A, Speth R, Dwoskin LP, Cassis LA. Renin-angiotensin system and sympathetic nervous system in cardiac pressure-overload hypertrophy. Am. J. Physiol. Heart Circ. Physiol. 2000;279:H2797–H2806. doi: 10.1152/ajpheart.2000.279.6.H2797. [DOI] [PubMed] [Google Scholar]
- 18.Caughey GH, Raymond WW, Wolters PJ. Angiotensin II generation by mast cell alpha- and beta-chymases. . Biochim. Biophys. Acta. 2000; 1480:245–257. doi: 10.1016/s0167-4838(00)00076-5. [DOI] [PubMed] [Google Scholar]
- 19.Galli SJ, Kitamura Y. Genetically mast-cell-deficient W/Wv and Sl/Sld mice. Their value for the analysis of the roles of mast cells in biologic responses in vivo. Am. J. Pathol. 1987;127:191–198. [PMC free article] [PubMed] [Google Scholar]
- 20.Goldstein SM, et al. Detection and partial characterization of a human mast cell carboxypeptidase. J. Immunol. 1987;139:2724–2729. [PubMed] [Google Scholar]
- 21.Stevens RL, et al. Strain-specific and tissue-specific expression of mouse mast cell secretory granule proteases. Proc. Natl. Acad. Sci. U. S. A. 1994;91:128–132. doi: 10.1073/pnas.91.1.128. [DOI] [PMC free article] [PubMed] [Google Scholar]
- 22.Pemberton AD, et al. Purification and characterization of mouse mast cell proteinase-2 and the differential expression and release of mouse mast cell proteinase-1 and -2 in vivo. Clin. Exp. Allergy. 2003;33:1005–1012. doi: 10.1046/j.1365-2222.2003.01720.x. [DOI] [PubMed] [Google Scholar]
- 23.Solivan S, Selwood T, Wang ZM, Schechter NM. Evidence for diversity of substrate specificity among members of the chymase family of serine proteases. FEBS Lett. 2002;512:133–138. doi: 10.1016/s0014-5793(02)02242-1. [DOI] [PubMed] [Google Scholar]
- 24.Balcells E, Meng QC, Johnson WH, Jr, Oparil S, Dell’Italia LJ. Angiotensin II formation from ACE and chymase in human and animal hearts: methods and species considerations. Am. J. Physiol. 1997;273:H1769–H1774. doi: 10.1152/ajpheart.1997.273.4.H1769. [DOI] [PubMed] [Google Scholar]
- 25.Nishiyama A, Seth DM, Navar LG. Renal interstitial fluid concentrations of angiotensins I and II in anesthetized rats. Hypertension. 2002;39:129–134. doi: 10.1161/hy0102.100536. [DOI] [PubMed] [Google Scholar]
- 26.Azizi M, Chatellier G, Guyene TT, Murieta-Geoffroy D, Menard J. Additive effects of combined angiotensin-converting enzyme inhibition and angiotensin II antagonism on blood pressure and renin release in sodium-depleted normotensives. Circulation. 1995;92:825–834. doi: 10.1161/01.cir.92.4.825. [DOI] [PubMed] [Google Scholar]
- 27.Menard J, Campbell DJ, Azizi M, Gonzales MF. Synergistic effects of ACE inhibition and Ang II antagonism on blood pressure, cardiac weight, and renin in spontaneously hypertensive rats. Circulation. 1997;96:3072–3078. doi: 10.1161/01.cir.96.9.3072. [DOI] [PubMed] [Google Scholar]
- 28.Wastling JM, et al. Histochemical and ultrastructural modification of mucosal mast cell granules in parasitized mice lacking the β-chymase, mouse mast cell protease-1. Am. J. Pathol. 1998;153:491–504. doi: 10.1016/s0002-9440(10)65592-7. [DOI] [PMC free article] [PubMed] [Google Scholar]
- 29.Chandrasekharan UM, Sanker S, Glynias MJ, Karnik SS, Husain A. Angiotensin II-forming activity in a reconstructed ancestral chymase. Science. 1996;271:502–505. doi: 10.1126/science.271.5248.502. [DOI] [PubMed] [Google Scholar]
- 30.Wouters MA, Liu K, Riek P, Husain A. A despecialization step underlying evolution of a family of serine proteases. Mol. Cell. 2003;12:343–354. doi: 10.1016/s1097-2765(03)00308-3. [DOI] [PubMed] [Google Scholar]
- 31.Mulvany MJ, Halpern W. Contractile properties of small arterial resistance vessels in spontaneously hypertensive and normotensive rats. Circ. Res. 1977;41:19–26. doi: 10.1161/01.res.41.1.19. [DOI] [PubMed] [Google Scholar]
- 32.Kinoshita A, Urata H, Bumpus FM, Husain A. Measurement of angiotensin I converting enzyme inhibition in the heart. Circ. Res. 1993;73:51–60. doi: 10.1161/01.res.73.1.51. [DOI] [PubMed] [Google Scholar]
- 33.Widdop RE, Matrougui K, Levy BI, Henrion D. AT2 receptor-mediated relaxation is preserved after long-term AT1 receptor blockade. Hypertension. 2002;40:516–520. doi: 10.1161/01.hyp.0000033224.99806.8a. [DOI] [PubMed] [Google Scholar]
- 34.Lin F, et al. Targeted α1A-adrenergic receptor overexpression induces enhanced cardiac contractility but not hypertrophy. Circ. Res. 2001;89:343–350. doi: 10.1161/hh1601.095912. [DOI] [PubMed] [Google Scholar]


