Abstract
Previously, we described implementation of a front-end ETD (electron transfer dissociation) source for an Orbitrap instrument (1). This source facilitates multiple fills of the C-trap with product ions from ETD of intact proteins prior to mass analysis. The result is a dramatic enhancement of the observed ion current without the need for time consuming averaging of data from multiple mass measurements. Here we show that ion-ion proton transfer (IIPT) reactions can be used to simplify ETD spectra and to disperse fragment ions over the entire mass range in a controlled manner. We also show that protein derivatization can be employed to selectively enhance the sequence information observed at the N- and C-termini of a protein.
Keywords: ETD, IIPT, protein derivatization
1. Introduction
Since the discovery and use of electron capture dissociation (ECD) by Zubarev, Kelleher and McLafferty on a Fourier-transform ion cyclotron resonance (FT-ICR) mass spectrometer in 1998 (2), much progress has been made in the development of mass spectrometric methods for the analysis of intact proteins (3–6). Electron transfer dissociation (ETD) was implemented on less expensive, quadrupole linear ion trap (QLT) instruments in 2004 (7) and proved to be ideally suited for the characterization of large peptides modified by phosphorylation (8) or O-GlcNAcylation (9). ETD of intact proteins on a QLT instrument was first attempted in 2005 (10). Proteins were converted to multiply charged positive ions by electrospray ionization and then allowed to react with fluoranthene radical anions. Electron transfer to the multiply charged proteins caused extensive fragmentation. Multiply charged fragment ions were then deprotonated by a second reaction with the carboxylate anion of benzoic acid and the resulting singly and double charged ions were used to read the amino acid sequence at both ends of the protein. With this information and the mass of the intact molecule it was possible to search protein databases for possible matches and detect the presence of posttranslational modifications or splice variants. A 2007 paper described the use of this technology to analyze intact proteins from the E. coli, 70S ribosomal protein complex (11). Forty-six of fifty-five known, unique components were identified in a single, 90 min, online, chromatography experiment.
Development of a front-end ETD source for the Orbitrap Velos Pro™ was reported in 2013 (1). This source facilitates multiple fills of the C-trap with product ions from ETD of intact proteins prior to mass analysis. The result is a dramatic enhancement of the observed ion current without the need for time consuming averaging of data from multiple mass measurements. Here we show that ion-ion proton transfer (IIPT) reactions can be used to simplify ETD spectra and to disperse fragment ions over the entire mass range in a controlled manner. We also show that protein derivatization can be employed to selectively enhance the sequence information observed at the N- and C-termini of a protein.
2. Materials and Methods
2.1 Materials
All reagents, not otherwise identified, were purchased from Sigma-Aldrich (St. Louis, MO). Burdick and Jackson® LC-MS grade acetonitrile was purchased from Honeywell (Morristown, NJ). Hydrochloric acid, Pierce® LC-MS grade water, LC-MS grade formic acid, DTSSP (3,3’-dithiobis[sulfosuccinimidylpropionate]), phosphate buffer-ed saline, and urea were purchased from Thermo Fisher Scientific (San Jose, CA). Anhydrous acetyl chloride and methanol were obtained from Alltech Associates, Inc. (Deerfield, IL). Sulfur hexafluoride was purchased as a 10 ppm mixture with nitrogen gas from GTS-Welco (Allentown, PA). Amicon® Ultra-0.5 10 kDa centrifugal filters were obtained from Millipore (Billerica, MA). Fused silica microcapillary tubing was purchased from Polymicro Technologies (Phoenix, AZ).
2.2 Instrument modification
Unless otherwise indicated, experiments were performed on a Thermo Fisher Scientific (San Jose, CA) Orbitrap Velos Pro™. As described recently (1), this instrument was modified to accommodate a glow discharge ion source for generation of negative ions used for electron transfer and proton transfer reactions. Instrument control software (ITCL) was in-house modified to control this ion source discharge, to isolate reagent anions, to enable ion/ion reactions within the QLT using the front-end reagent ion source, and to allow multiple fills of the C-trap with products of these ion/ion reactions.
2.3 Sample Preparation
2.3.1 Amidation
Intact apomyoglobin and human CLIP peptide samples were dissolved in a 20 µL solution containing 1 M pyridine, HCl and either 2-(2-aminoethyl)benzimidazole dihydrochloride (intact apomyoglobin) or histamine dihydrochloride (human CLIP peptide), pH ≈ 5.5. A 5-µL aliquot of 0.1 M N-(3-dimethylaminopropyl)-N’-ethylcarbodiimide hydrochloride in 1 M pyridine-HCl was added and the solution was sonicated for 2 hrs. Samples were then taken to dryness in a CentriVap® centrifugal vacuum concentrator (Labconco Corporation, Kansas City, MO). The apomyoglobin sample was reconstituted in 200 µL 0.1% (v/v) acetic acid and desalted using a 10 kDa centrifugal filter prior to direct infusion. Samples were stored at −40 °C until analyzed.
2.3.2 Derivatization with DTSSP and aminoethyl maleimide
Lyophilized apomyoglobin was dissolved in a 100 µL solution containing 6 M urea, 100 mM PBS and 4 mM DTSSP, pH ≈ 7.2 and allowed to cross-link for 2 hrs at 4 °C. The resulting disulfide bonds were reduced with 160 mM dithiothreitol and alkylated by adding N-(2-aminoethyl) maleimide (12) to produce a 320 mM solution and by allowing the reaction to proceed for 15 min at room temperature. The sample was desalted by precipitation with trichloroacetic acid, taken to dryness and stored at −40 °C until analyzed..
2.3.3 Sample preparation for direct infusion
Immediately prior to MS analysis, samples (unmodified and derivatized apomyoglobin) were dissolved in a 200–500 µL solution containing 40% (v/v) acetonitrile and 60%, 0.1% (v/v) acetic acid (v/v). Samples were infused at concentrations of 2–5 pmol/µL.
2.4 MS Analyses
2.4.1 Unmodified apomyoglobin
Apomyoglobin (2 pmol/µL) was electrosprayed into the front-end of an ETD/IIPT-enabled Orbitrap Velos Pro™ with the aid of a fused silica, microcapillary column equipped with a laser-pulled (P-2000 microcapillary laser puller, Sutter Instrument Co., Navato, CA), electrospray emitter tip. Mass analysis was performed by targeting [M+26H]+26 ions in a 6 m/z window centered at m/z 653.08. High resolution MS/MS (100,000 at 400 m/z) spectra were acquired over a mass range of 200–4000 Da and involved collecting 30 multiple C-trap fills of ions generated from 5 msec of ETD and 20–160 msec of IIPT.
2.4.2 Histamine derivatized human CLIP peptide
Human CLIP peptide (250 fmol) in 20 µl 0.1% (v/v) acetic acid was pressure loaded onto a 360-µm o.d. × 75-µm i.d. fused-silica micro-capillary pre-column packed with 8-cm of irregular C18 resin (5–20 µm, 120-Å, YMC) and washed with ~20 column volumes of 0.1% v/v acetic acid. The precolumn was then connected to a 360-µm o.d. × 50-µm i.d. analytical column packed with 6-cm of C18 resin (5-µm, 120-Å, YMC) and equipped with a laser-pulled (P-2000, Sutter Instruments) electrospray emitter tip (13). Samples were gradient eluted by nanoflow, (60 nL/min) reverse-phase HPLC, as previously described (14) into an ETD-enabled Thermo Fisher Scientific linear ion trap (LTQ). The instrument was operated in a data-dependent mode in which a single MS1 scan was acquired from m/z 300–2000 followed by 2 ETD MS/MS scans. MS2 parameters were set as follows: 100 msec ETD reaction time, ITMSn AGC target 2E4, reagent AGC target 4E5.
2.4.3 Aminoethyl benzimidazole derivatized apomyoglobin
Sample was directly infused at a concentration of 5 pmol/µL as described above. Mass analyses were performed by targeting ions in a 15 m/z window centered at m/z 867 that contained a highly charged, derivatized form of the protein. MS/MS spectra were acquired at high resolution (r = 60,000 at 400 m/z) over a 200– 4000 m/z scan range using 10 multiple fills of ions generated by 7 msec of ETD and 60–120 msec of IIPT).
For LC-MS analysis, derivatized protein (1 pmol) was pressure loaded onto 360-µm o.d. × 150-µm i.d. fused-silica micro-capillary pre-column (11-cm of POROSHELL 300SB-C18 (5–µm, 300-Å, Agilent Technologies, Santa Clara, CA) and washed with ~20 column volumes of 0.3% (v/v) formic acid in water. The precolumn was then connected to a 360-µm o.d. × 75-µm i.d. fused-silica micro-capillary pre-column packed similarly to the precolumn and equipped with a laser-pulled (P-2000, Sutter Instruments) electrospray emitter tip (13). Samples were gradient eluted by nanoflow (60 nL/min) reverse-phase HPLC and ionized using micro electrospray ionization as previously described (14). The elution gradient utilized solvent A: 0.3% formic acid in water and solvent B: 0.3% formic acid, 72% acetonitrile, 18% isopropanol and 9.7% water (all v/v). The instrument was set to toggle FT (r = 60,000 at 400 m/z) and IT full MS scan types over a 300–2000 m/z scan range.
2.4.4 DTSSP-aminoethyl maleimide derivatized & esterified apomyoglobin
Sample (5 pmol/µL) was infused directly into the electrospray ion source as described above. Mass analysis was performed by targeting ions in a 10 m/z window centered around m/z 848. High resolution MS/MS scans (r = 60,000 at 400 m/z) were acquired over a mass range of 200–4000 Da and involved collecting 4 multiple C-trap fills of ions for 3 microscans each of data generated from 5–10 msec of ETD and 80–100 msec IIPT.
2.4.5 Data analysis
Interpretation of all ETD/IIPT MS/MS data was performed manually on the unprocessed raw spectra. Theoretical fragment ion masses were calculated using an in-house developed fragment mass calculator. Percent sequence coverage was calculated by dividing the number of observed N-Cα bond cleavages by the total number of predicted N-Cα bond cleavages (note that cleavage of the N-Cα bond that is N-terminal to proline does not produce an observable fragment).
3. Results and Discussion
3.1 Gas-phase Ion/Ion Reactions Yield Near-Complete Sequence Coverage
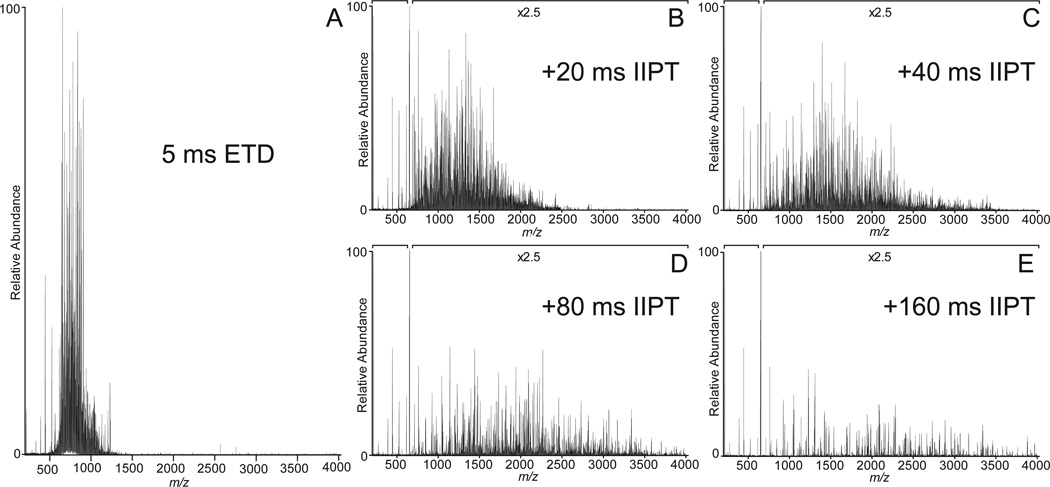
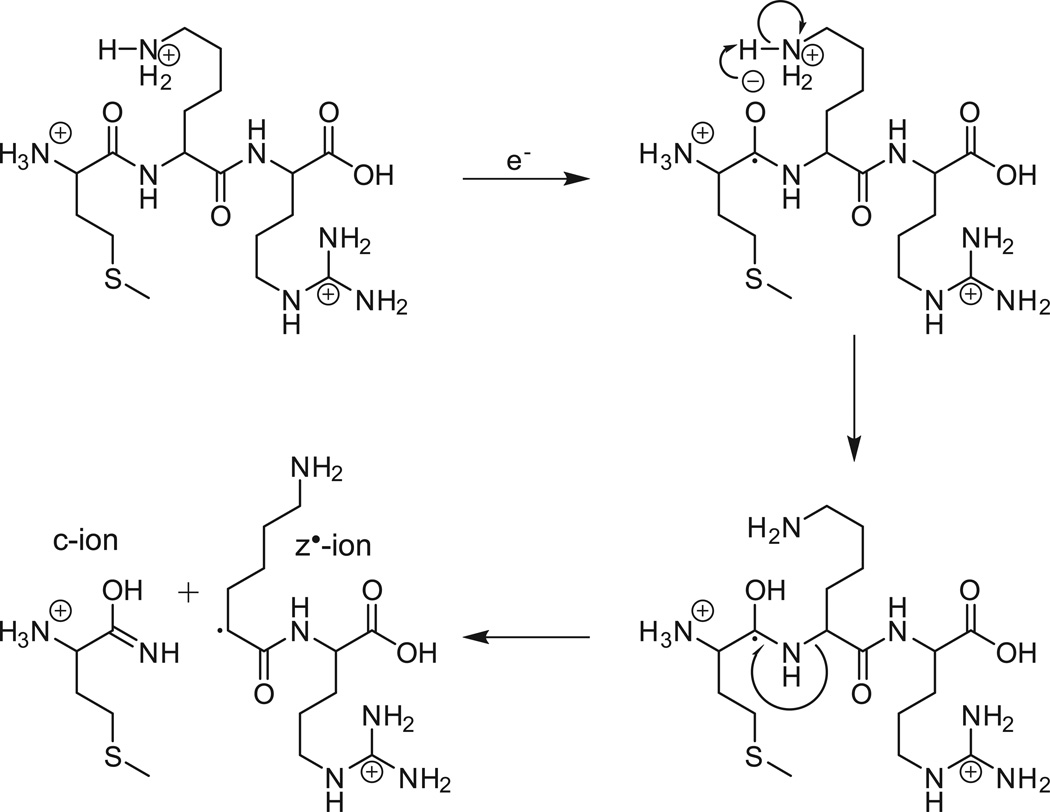
Shown in Figure 1A is the ETD MS/MS spectrum recorded by allowing [M+26H]+26 ions (m/z 653) from the protein, apomyoglobin (average MW 16,952.52 Da), to react with fluoranthene radical anions for 5 msec. As shown in Fig 2, the ETD reaction fragments the protein N-Cα bonds, more or less randomly, to produce ions of type c and z. Ions of type c contain the amino terminus plus one or more amino acid residues and ions of type z contain the carboxy terminus plus one or more amino acids residues. For apomyoglobin, a protein of 153 AA, there are 152 possible cleavage sites and 304 possible fragments of type c and z. Since the average mass of an amino acid is 110 and 1/6 amino acids are usually basic, it is reasonable to expect that fragments near masses 660, 1320, 2640, 5280, 10,560, and 13,200 will have +1,+2,+4,+8,+16 and +20 charges, respectively. If the fragments are produced in the ETD reaction, all would appear at or near m/z 660. Thus short reaction times for ETD dissociation of intact proteins are expected to produce a complex mixture of multiply charged fragments with overlapping isotope patterns and most of these are likely occur in a narrow mass range, 200–300 Da above and below m/z of the parent ions that are selected for fragmentation. In Figure 1A, more than 90% of the ETD fragment ion current from apomyoglobin [M+26H]+26 ions (m/z 653) is observed between m/z 600 and 900.
Figure 1. ETD/IIPT MS/MS spectra recorded on intact apomyoglobin.
(A) ETD spectrum recorded on (M+26H)26+ ions from apomyoglobin using a reaction time of 5 msec. (B–E) Spectra obtained by performing IIPT reactions on the ETD fragment ions in (A) for 20 msec, 40 msec, 80 msec, and 160 msec, respectively.
Figure 2. ETD reaction mechanism.
Fragmentation scheme for the production of ions of types c and z by cleavage of the N-Cα bond of a multiply charged precursor following the transfer of an electron from a radical anion of fluoranthene.
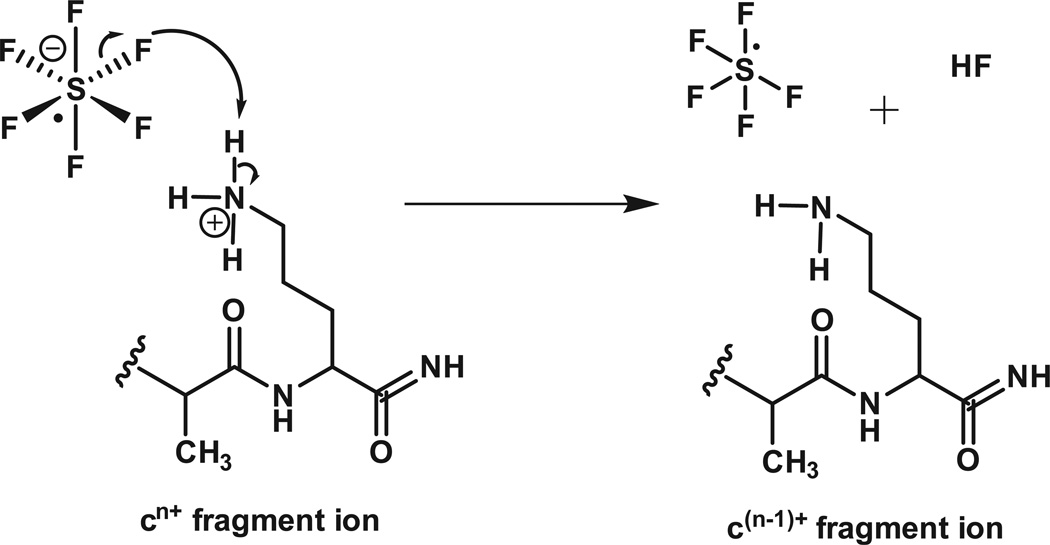
To simplify this spectrum, we allow the ETD fragments to react with SF6-• and undergo one-or-more, ion-ion proton transfer (IIPT) reactions. As shown in Figure 3, SF6-• functions as Bronsted base, not an electron transfer reagent. Since the rate of an ion-ion reaction is proportional to the square of the charge on the substrate (+10 ions react 100 times faster than +1 ions), it is possible to preferentially deprotonate highly charged ions and use short reaction times to disperse them over a wide mass range or long reaction times to move them beyond the mass range of the instrument.
Figure 3. Reaction of sulfur hexafluoride anion with a positively charged ETD fragment ion.
The sulfur hexafluoride radical anion removes a proton from the fragment, cn+, reduces charge on the fragment by one and forms sulfur pentafluoride plus HF.
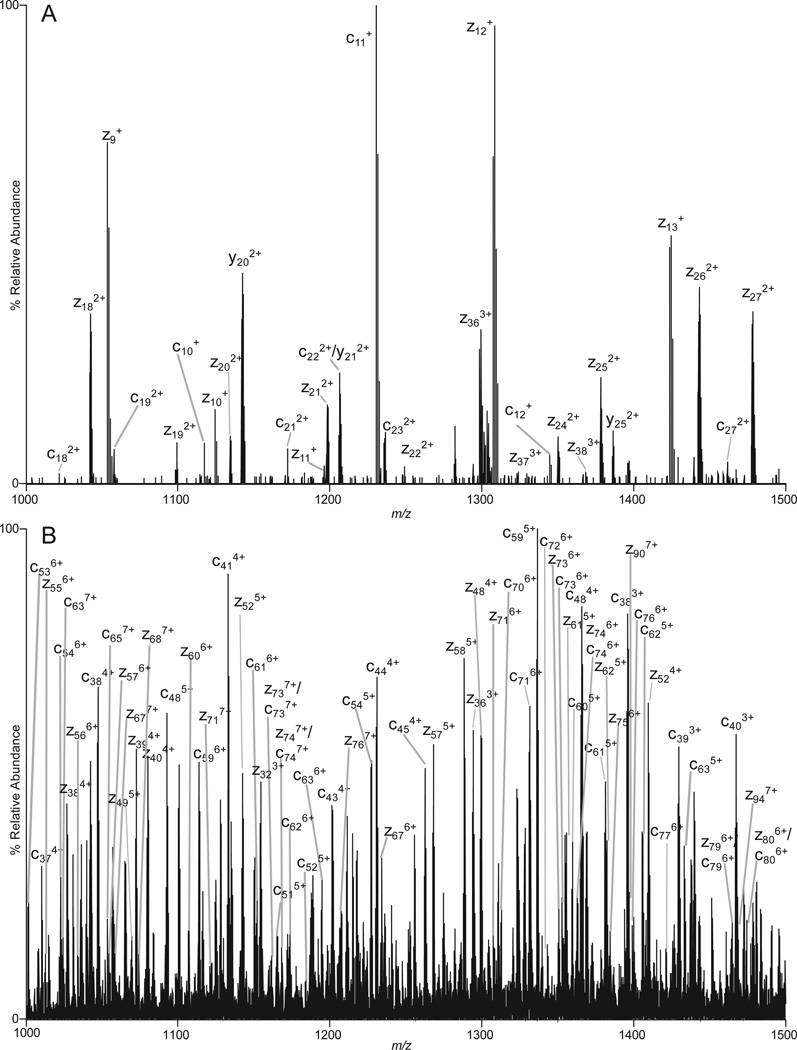
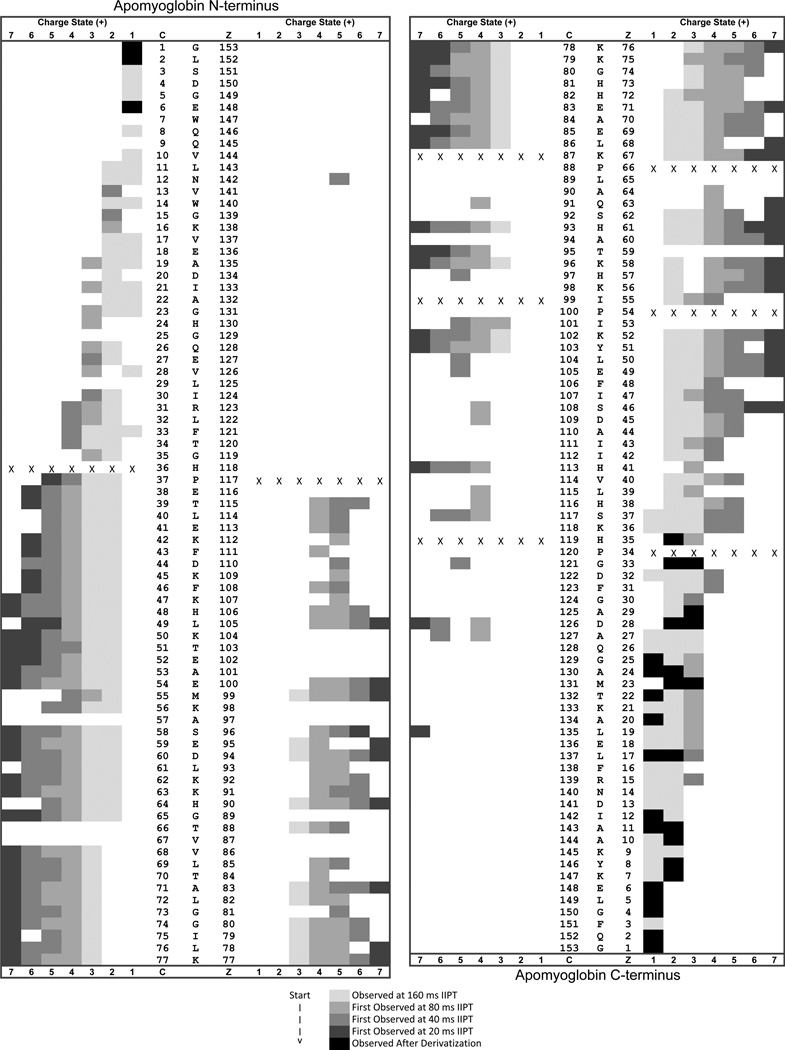
Examples of ETD/IIPT spectra recorded on [M+26H]+26 ions (m/z 653) from apomyoglobin with IIPT reaction times of 20, 40, 80 and 160 msec are shown in Figure 1 (B–E). Fragment ions that appear in the mass range from 1000 – 1500 following long and short IIPT reactions times are shown in Figure 4. Note that much of this mass range is devoid of ions in the original ETD spectrum. The MS/MS spectrum in Fig 4A was acquired with a relatively long IIPT reaction time (160 msec) and contains only ions with a charge of +1 or +2. In the displayed mass range, the observed c and z ions derive from residues ~10–27 at each end of the protein. For the mass range of 4,000, we find c and z ions derived from ~65 residues at each end of the protein. In contrast, the MS/MS spectrum in Fig 4B was acquired with an IIPT reaction time of 20 msec and now contains ions with a charge of +3 to +7. In the displayed mass range, the observed c and z ions derive from residues ~37–80 at each end of the protein. For the mass range of 4,000 we find c and z ions derived from ~115 residues at each end of the protein. These data are summarized in the form of a heat map in Figure 5. Note that 86% sequence coverage is obtained by manual interpretation of data from all IIPT reaction conditions. Use of IIPT reactions also improves the number of fragment ion assignments that can be made with software such as ProSight (15, 16). As shown in Supplemental Figure 1 the total number of c- and z-ions detected by ProSight for ETD only, ETD & 20 msec IIPT and ETD & 40 msec IIPT is 100 to 131 to 150 respectively. Noticeably absent in both sets of data are sequence assignments for a few residues at the N- and C-termini of apomyoglobin, regions that are devoid of basic residues and thus fail to carry a charge.
Figure 4. Fragment ions observed with long and short IIPT reaction times.
MS/MS spectra recorded on (M+26H)26+ ions from apomyoglobin using an ETD reaction time of 5 msec and (A) an IIPT reaction time of 160 msec or (B) an IIPT reaction time of 20 msec.
Figure 5. Heat Map of the sequence coverage generated from intact apomyoglobin by using sequential ETD/IIPT reactions.
Fragment ions observed with 5 msec of ETD and 160 msec of IIPT are lightly shaded and dominated by charge states of +1 and +2. More highly charged fragment ions (+3 to +7) that are observed for the first time at shorter IIPT reaction times (80, 40, and 20 msec) are labeled in darker shades. Those shaded in black were only observed following chemical derivatization of the protein.
3.2 Protein Derivatization to Facilitate Sequence Analysis at the N- and C-termini of Proteins
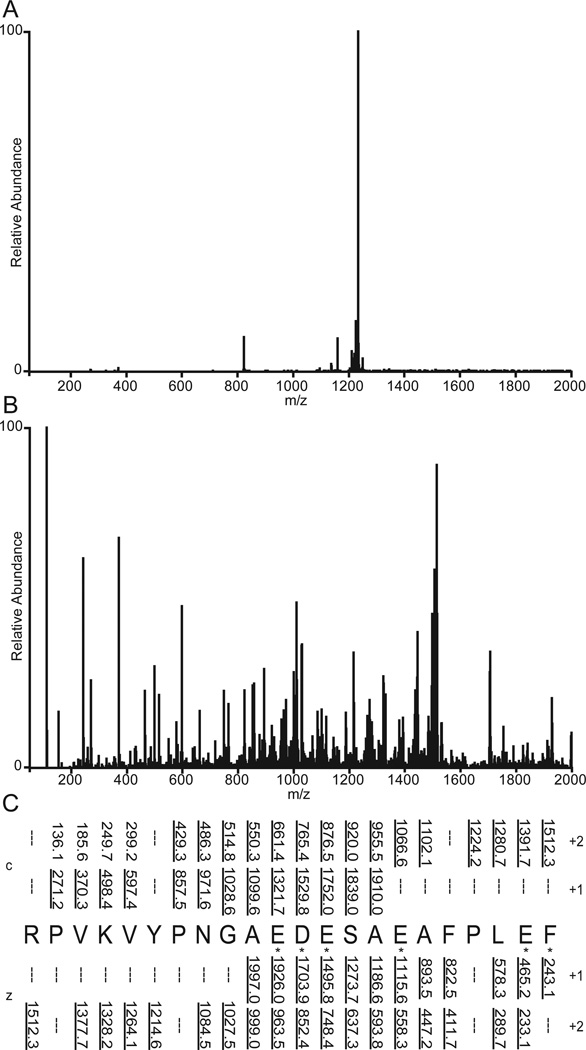
To enhance the formation and detection of ETD fragment ions at the N- and C-termini of peptides and proteins, we have used two different derivatization protocols. The first involves carbodiimide chemistry to convert carboxylic acid groups at the C-terminus and on the side chains of Asp and Glu residues to amides containing a basic imidazole group. ETD spectra recorded on the highly-acidic, human CLIP peptide, before and after derivatization with histamine, are shown in Figure 6. Note that the ETD MS/MS spectrum of [M+3H]+3 ions (m/z 822.91) from the unmodified peptide contains very few fragment ions and is dominated by the charge reduced precursor species [M+3H]++• (Fig 6A). In contrast, the ETD MS/MS spectrum of [M+7H]+7 ions (m/z 433.28), from the peptide derivatized with 6 histamine units is now dominated by c and z type ions that provide complete sequence coverage (Fig 6B–C).
Figure 6. Derivatization of human CLIP peptide with histamine enhances fragmentation observed by ETD.
(A) ETD MS/MS spectrum of [M+3H]+3 ions m/z 822.91) from unmodified CLIP. (B) ETD MS/MS spectrum of [M+7H]+7 ions (m/z 433.27) of CLIP derivatized with histamine. Following derivatization, carboxyl groups of five, D and E residues, plus the C-terminus are converted to amides containing a basic imidazole ring. (C) Sequence coverage obtained from (B). Residues labeled by a histamine group are indicated by an asterisk.
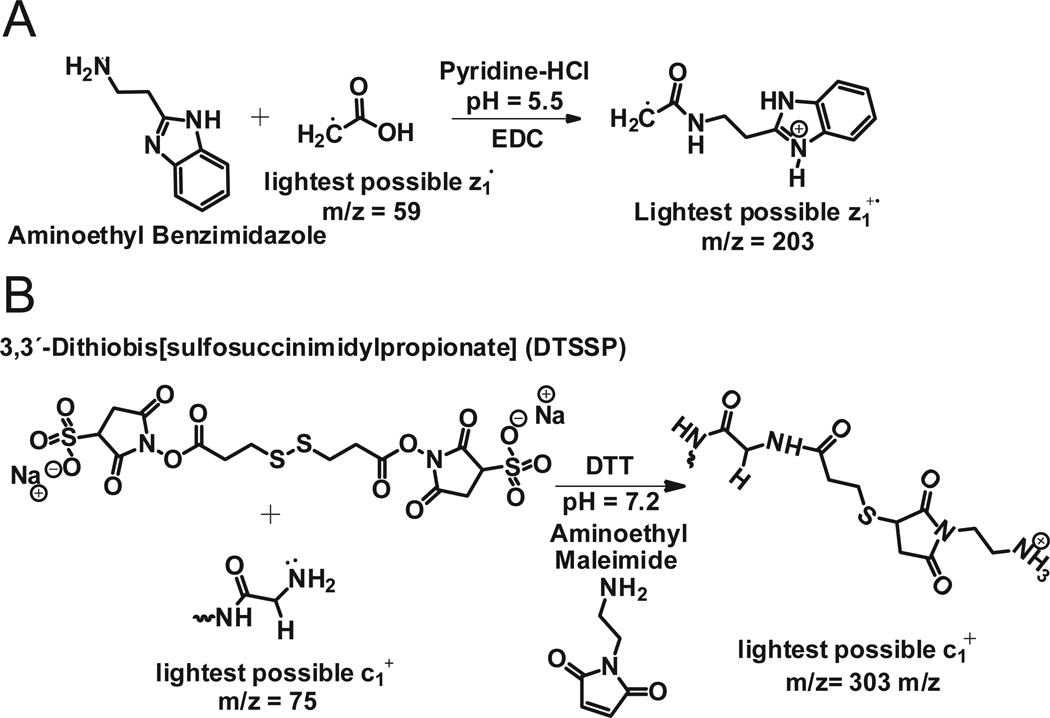
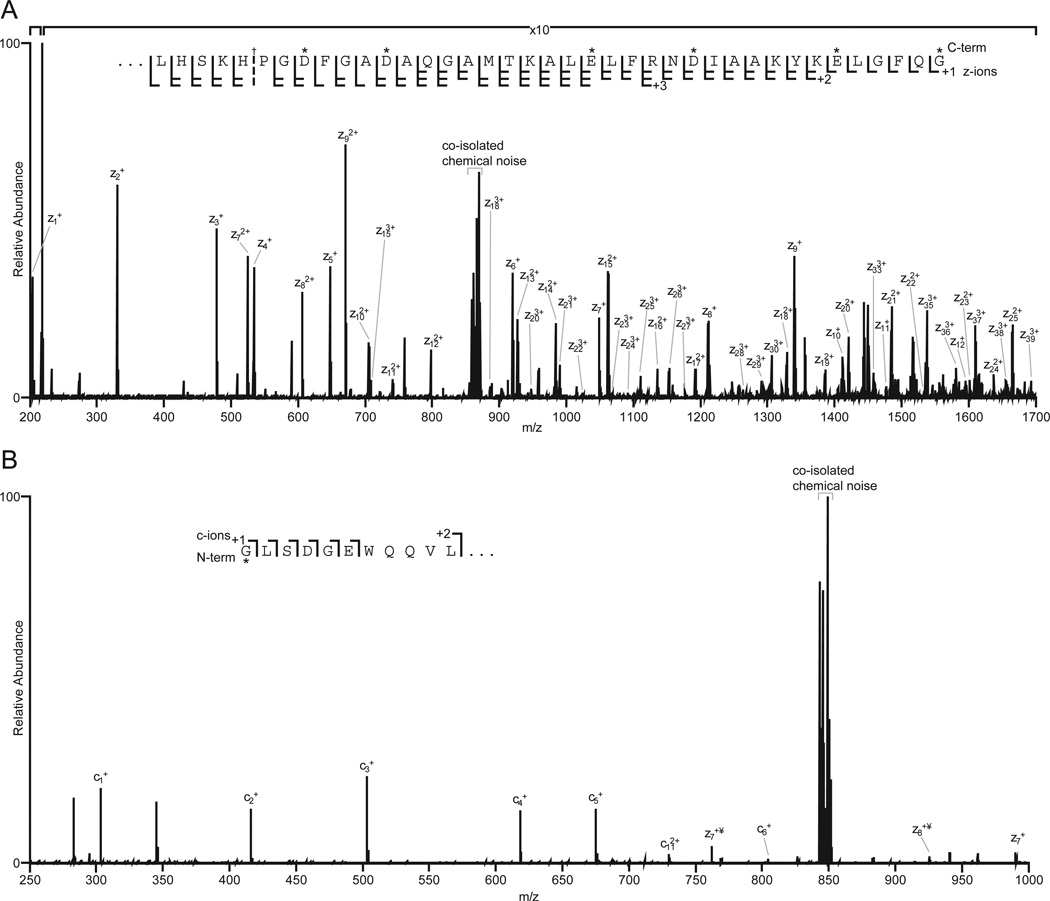
This same approach was employed to derivatize carboxyl groups of apomyoglobin with 2-(2-aminoethyl) benzimidazole. Aminoethylbenzimidazole is chemically similar to histamine, but has a mass that allows even the smallest amino acid, Gly, to be detected at the C-terminus of a protein. (If the c-terminal residue is Gly, z1 = 203, Figure 7A). Apomyoglobin contains 22 carboxylic acid groups (13 Glu, 8 Asp, and the C-terminus). Following derivatization, the dominant charge state in the electrospray ionization full MS spectrum of the intact protein increased from 18 to 25 (Supplemental Figure 2A). MS/MS of ions at m/z 867, (7 msec of EDT, 60 msec of IIPT with 10 multiple C-trap fills) affords a spectrum that contains a complete series of z ions for the last 39 amino acids in apomyoglobin (Fig 8A).
Figure 7. Protein modification strategies for observing extreme N- and C-terminal fragment ions and for enhancing fragmentation by ETD.
(A) Derivatization of the C-terminal carboxyl group (and other acidic residues) with aminoethylbenzimidazole. (B) Derivatization of the amino terminus (and other side chain amino groups) with a protected thiopropionic acid hydroxysuccinimide ester followed by reaction with aminoethylmaleimide.
Figure 8. Sequence coverage of the N- and C-terminus of apomyoglobin following derivatization.
(A) 200–1700 m/z subsection of an ETD/IIPT MS/MS spectrum of apomyoglobin derivatized with aminoethylbenzimidazole. Observed z-ions are indicated. (B) 250–1000 m/z subsection of an ETD/IIPT MS/MS spectrum of apomyoglobin derivatized with DTSSP-maleimide. Observed c- and z-ions are indicated. Labeled amino acid residues are indicated by an asterisk. ¥ denotes fragment ions not carrying a covalent label.
To observe fragment ion signals for the first two N-terminal amino acid residues of apomyoglobin, the α-N-amino and lysine side chain amino groups were cross-linked with a thiopropionic acid hydroxy-succinimide ester. The resulting disulfide bonds were reduced and alkylated with aminoethylmaleimide (Figure 7B). Successful labeling of the N-terminus increases the m/z for the c1+ ion of the smallest amino acid, Gly, from 75 to 303. Presence of the ethylamino group on the maleimide moiety ensures the c1 fragment will be charged. Figure 8B shows the ETD/IIPT spectrum recorded on the derivatized sample. Type c ions are now visible for the first 6 amino acids in apomyglobin. With data from both derivatizations, total sequence coverage for apomyoglobin is 94%.
4. Conclusions
In an earlier paper (1), we described implementation of a front-end ETD source for an Orbitrap Velos Pro™ instrument. This source facilitates multiple fills of the C-trap with product ions from ETD of intact proteins prior to mass analysis. The result is a dramatic enhancement of the observed ion current without the need for time consuming averaging of data from multiple mass measurements. Here we show that sequential ETD and IIPT reactions implemented on a modified Orbitrap Velos Pro™ can be used to simplify the resulting spectra and to disperse ETD fragment ions over the entire mass range in a controlled manner. We also show that protein derivatization can be employed to selectively enhance the sequence information observed at the N- and C-termini of the protein. Next on the horizon are methods for controlling the ETD reaction rate and for preventing product ions from undergoing secondary reactions. Near complete sequence analysis of intact proteins (50,000 Da) on chromatographic time scale will soon be a reality.
Supplementary Material
Highlights.
IIPT reactions using SF6-• charge reduce ETD-produced fragment ions.
This spreads ETD fragment ion signals over the entire mass range.
The resulting spectra yield more sequence information and are easier to interpret.
Derivatizations selectively enhance sequence information from the protein termini.
Total sequence coverage for apomyoglobin is 94%.
Acknowledgements
This research was supported by National Institutes of Health Grants GM37537 and AI33993 (to D.F.H.).
Abbreviations
- ETD
electron transfer dissociation
- IIPT
ion-ion proton transfer
Footnotes
Publisher's Disclaimer: This is a PDF file of an unedited manuscript that has been accepted for publication. As a service to our customers we are providing this early version of the manuscript. The manuscript will undergo copyediting, typesetting, and review of the resulting proof before it is published in its final citable form. Please note that during the production process errors may be discovered which could affect the content, and all legal disclaimers that apply to the journal pertain.
Contributor Information
Lissa C. Anderson, Email: lca4nu@virginia.edu.
A. Michelle English, Email: ame4v@virginia.edu.
Weihan Wang, Email: ww6x@virginia.edu.
Dina L. Bai, Email: dlb6z@virginia.edu.
Jeffrey Shabanowitz, Email: js4c@virginia.edu.
Donald F Hunt, Email: dfh@virginia.edu.
References
- 1.Earley L, Anderson LC, Bai DL, Mullen C, Syka JE, English AM, Dunyach JJ, Stafford GC, Jr, Shabanowitz J, Hunt DF, Compton PD. Front-end electron transfer dissociation: A new ionization source. Anal Chem. 2013 Sep 3;85(17):8385–8390. doi: 10.1021/ac401783f. [DOI] [PMC free article] [PubMed] [Google Scholar]
- 2.Zubarev RA, Kelleher NL, McLafferty FW. Electron capture dissociation of multiply charged protein cations. A nonergodic process. J Am Chem Soc. 1998;120(13):3265–3266. 04/01; 2014/02; [Google Scholar]
- 3.Garcia BA. What does the future hold for top down mass spectrometry? J Am Soc Mass Spectrom. 2010;21:193–202. doi: 10.1016/j.jasms.2009.10.014. [DOI] [PubMed] [Google Scholar]
- 4.Cui W, Rohrs HW, Gross ML. Top-down mass spectrometry: Recent developments, applications and perspectives. Analyst. 2011 Oct 7;136(19):3854–3864. doi: 10.1039/c1an15286f. [DOI] [PMC free article] [PubMed] [Google Scholar]
- 5.Shaw JB, Li W, Holden DD, Zhang Y, Griep-Raming J, Fellers RT, Early BP, Thomas PM, Kelleher NL, Brodbelt JS. Complete protein characterization using top-down mass spectrometry and ultraviolet photodissociation. J Am Chem Soc. 2013 Aug 28;135(34):12646–12651. doi: 10.1021/ja4029654. [DOI] [PMC free article] [PubMed] [Google Scholar]
- 6.Fornelli L, Damoc E, Thomas PM, Kelleher NL, Aizikov K, Denisov E, Makarov A, Tsybin YO. Analysis of intact monoclonal antibody IgG1 by electron transfer dissociation orbitrap FTMS. Mol Cell Proteomics. 2012 Dec;11(12):1758–1767. doi: 10.1074/mcp.M112.019620. [DOI] [PMC free article] [PubMed] [Google Scholar]
- 7.Syka JE, Coon JJ, Schroeder MJ, Shabanowitz J, Hunt DF. Peptide and protein sequence analysis by electron transfer dissociation mass spectrometry. Proc Natl Acad Sci U S A. 2004 Jun 29;101(26):9528–9533. doi: 10.1073/pnas.0402700101. [DOI] [PMC free article] [PubMed] [Google Scholar]
- 8.Hall EH, Balsbaugh JL, Rose KL, Shabanowitz J, Hunt DF, Brautigan DL. Comprehensive analysis of phosphorylation sites in Tensin 1 reveals regulation by p38MAPK. Mol Cell Proteomics. 2010 Dec;9(12):2853–2863. doi: 10.1074/mcp.M110.003665. [DOI] [PMC free article] [PubMed] [Google Scholar]
- 9.Wang Z, Udeshi ND, Slawson C, Compton PD, Sakabe K, Cheung WD, Shabanowitz J, Hunt DF, Hart GW. Extensive crosstalk between O-GlcNAcylation and phosphorylation regulates cytokinesis. Sci Signal. 2010 Jan 12;3(104):ra2. doi: 10.1126/scisignal.2000526. [DOI] [PMC free article] [PubMed] [Google Scholar]
- 10.Coon JJ, Ueberheide B, Syka JE, Dryhurst DD, Ausio J, Shabanowitz J, Hunt DF. Protein identification using sequential ion/ion reactions and tandem mass spectrometry. Proc Natl Acad Sci U S A. 2005 Jul 5;102(27):9463–9468. doi: 10.1073/pnas.0503189102. [DOI] [PMC free article] [PubMed] [Google Scholar]
- 11.Chi A, Bai DL, Geer LY, Shabanowitz J, Hunt DF. Analysis of intact proteins on a chromatographic time scale by electron transfer dissociation tandem mass spectrometry. Int J Mass Spectrom. 2007 Jan 1;259(1–3):197–203. doi: 10.1016/j.ijms.2006.09.030. [DOI] [PMC free article] [PubMed] [Google Scholar]
- 12.Hermanson GT. Bioconjugate Techniques. Academic Press; 2008. pp. 160–161. [Google Scholar]
- 13.Martin SE, Shabanowitz J, Hunt DF, Marto JA. Subfemtomole MS and MS/MS peptide sequence analysis using nano-HPLC micro-ESI fourier transform ion cyclotron resonance mass spectrometry. Anal Chem. 2000 Sep 15;72(18):4266–4274. doi: 10.1021/ac000497v. [DOI] [PubMed] [Google Scholar]
- 14.Udeshi ND, Compton PD, Shabanowitz J, Hunt DF, Rose KL. Methods for analyzing peptides and proteins on a chromatographic timescale by electron-transfer dissociation mass spectrometry. Nat Protoc. 2008;3(11):1709–1717. doi: 10.1038/nprot.2008.159. [DOI] [PMC free article] [PubMed] [Google Scholar]
- 15.LeDuc RD, Taylor GK, Kim YB, Januszyk TE, Bynum LH, Sola JV, Garavelli JS, Kelleher NL. ProSight PTM: An integrated environment for protein identification and characterization by top-down mass spectrometry. Nucleic Acids Res. 2004 Jul 1;32(Web Server issue):W340–W345. doi: 10.1093/nar/gkh447. [DOI] [PMC free article] [PubMed] [Google Scholar]
- 16.Zamdborg L, LeDuc RD, Glowacz KJ, Kim YB, Viswanathan V, Spaulding IT, Early BP, Bluhm EJ, Babai S, Kelleher NL. ProSight PTM 2.0: Improved protein identification and characterization for top down mass spectrometry. Nucleic Acids Res. 2007 Jul;35(Web Server issue):W701–W706. doi: 10.1093/nar/gkm371. [DOI] [PMC free article] [PubMed] [Google Scholar]
Associated Data
This section collects any data citations, data availability statements, or supplementary materials included in this article.


