Abstract
Purpose:
Computed tomography (CT) has been widely used worldwide as a tool for medical diagnosis and imaging. However, despite its significant clinical benefits, CT radiation dose at the population level has become a subject of public attention and concern. In this light, optimizing radiation dose has become a core responsibility for the CT community. As a fundamental step to manage and optimize dose, it may be beneficial to have accurate and prospective knowledge about the radiation dose for an individual patient. In this study, the authors developed a framework to prospectively estimate organ dose for chest and abdominopelvic CT exams under tube current modulation (TCM).
Methods:
The organ dose is mainly dependent on two key factors: patient anatomy and irradiation field. A prediction process was developed to accurately model both factors. To model the anatomical diversity and complexity in the patient population, the authors used a previously developed library of computational phantoms with broad distributions of sizes, ages, and genders. A selected clinical patient, represented by a computational phantom in the study, was optimally matched with another computational phantom in the library to obtain a representation of the patient’s anatomy. To model the irradiation field, a previously validated Monte Carlo program was used to model CT scanner systems. The tube current profiles were modeled using a ray-tracing program as previously reported that theoretically emulated the variability of modulation profiles from major CT machine manufacturers Li et al., [Phys. Med. Biol. 59, 4525–4548 (2014)]. The prediction of organ dose was achieved using the following process: (1) CTDIvol-normalized-organ dose coefficients (horgan) for fixed tube current were first estimated as the prediction basis for the computational phantoms; (2) each computation phantom, regarded as a clinical patient, was optimally matched with one computational phantom in the library; (3) to account for the effect of the TCM scheme, a weighted organ-specific CTDIvol [denoted as ] was computed for each organ based on the TCM profile and the anatomy of the “matched” phantom; (4) the organ dose was predicted by multiplying the weighted organ-specific CTDIvol with the organ dose coefficients (horgan). To quantify the prediction accuracy, each predicted organ dose was compared with the corresponding organ dose simulated from the Monte Carlo program with the TCM profile explicitly modeled.
Results:
The predicted organ dose showed good agreements with the simulated organ dose across all organs and modulation profiles. The average percentage error in organ dose estimation was generally within 20% across all organs and modulation profiles, except for organs located in the pelvic and shoulder regions. For an average CTDIvol of a CT exam of 10 mGy, the average error at full modulation strength (α = 1) across all organs was 0.91 mGy for chest exams, and 0.82 mGy for abdominopelvic exams.
Conclusions:
This study developed a quantitative model to predict organ dose for clinical chest and abdominopelvic scans. Such information may aid in the design of optimized CT protocols in relation to a targeted level of image quality.
Keywords: CT, computed tomography, Monte Carlo, organ dose, patient-specific
1. INTRODUCTION
Computed tomography (CT) has become an indispensable imaging modality for the diagnosis of a broad range of diseases in both pediatric and adult populations.1,2 Despite the significant clinical benefits provided by CT, concerns have been raised regarding the potential cancer risk induced by CT radiation exposure.3 In this light, optimizing the radiation dose forms a core responsibility for the CT community.4–6 As a fundamental step to manage and optimize radiation dose, it may be beneficial to quantify patient-specific radiation dose. Such dose estimates, particularly when known prospectively, could provide information useful for the design of individualized CT protocols, for the assessment and improvement of patient imaging management decisions, and for optimizing CT dose in relationship with image quality of the study.
In light of prospectively quantifying patient-specific radiation dose, previous studies have demonstrated it is feasible to use CTDIvol-normalized-dose coefficients (horgan) to predict organ dose based on the patient size and the CTDIvol value.7–11 However, this methodology may not represent the widely used tube current modulation (TCM) scheme. Introduced more than a decade ago, tube current modulation technique has now been frequently implemented in clinical body CT exams. Quantifying the magnitude of organ dose under TCM, however, is practically challenging. The main challenge relates to the fact that the x-ray radiation is dynamically altered over the patient habitus for TCM examinations. To accurately estimate organ dose, one needs to model such change of irradiation condition and further integrate it with the anatomical feature of the patients. The prior studies have been able to use the concept of regional CTDIvol in conjunction with organ dose coefficients to assess organ dose.1,12 However, the methodology has been applied to a limited number of human models, and is further oriented toward retrospective dose estimation for specific models.
The purpose of this study was to assess organ dose under TCM schemes using a prediction atlas-based approach. The prediction, applied to for chest and abdominopelvic exams, was achieved by combining a patient matching technique, a TCM scheme that emulates modulation profiles from major CT vendors, and Monte Carlo simulation results for a library of computational phantoms with representative sizes, ages, and genders. A validation study was further performed to quantify the accuracy of the proposed dose prediction technique.
2. MATERIALS AND METHODS
Organ dose is governed by two main factors: patient anatomy (patient size, organ location, and tissue composition) and x-ray irradiation field (including the effect of scanning x-ray tube voltage, bowtie filter, pitch, and tube current modulation). A prediction process was developed to effectively model both factors. To model the complexity and variety in patient anatomy, we used a previously developed library of computational phantoms covering a broad range of patient body habitus. A clinical patient, represented by a computational phantom in this study, was further optimally matched to one computational phantom in order to obtain a prior estimation of patient anatomy. As for the second factor, a previously validated Monte Carlo simulation program was used to simulate the scanner system and scanning trajectory during the exam. The detailed prediction process is outlined as follows:
2.A. Patient-specific computational models and matching technique
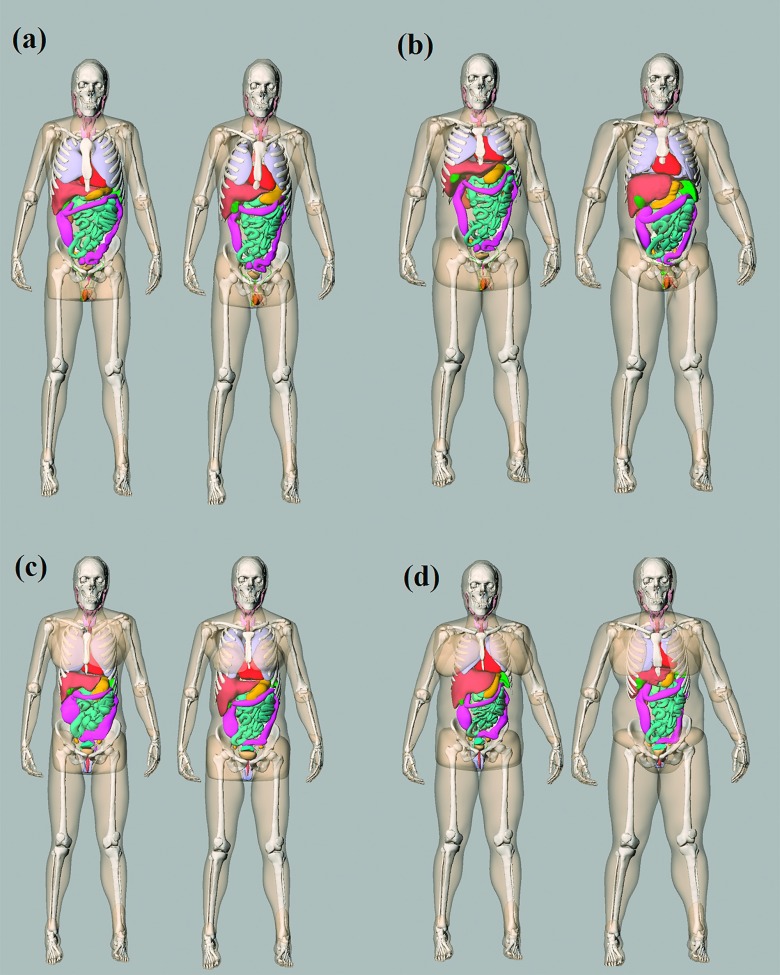
The library of computational models consisted of 58 adult patients (age range, 18–78 year old; weight range, 57–180 kg). The subjects reflected a wide coverage of ages and weight percentiles/BMI ranges so that a clinical patient could be well-represented by one or a group of computational phantoms (Fig. 1).
FIG. 1.
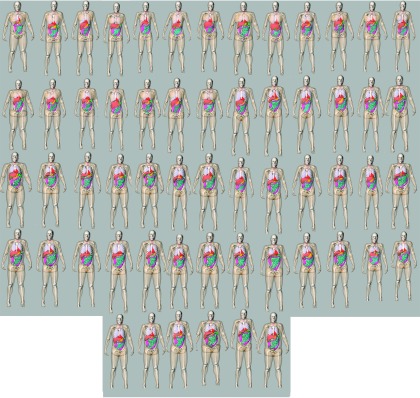
3D frontal views of the series of patient models used in this study.
The formation of the library is detailed in early publications.13,14 In summary, each XCAT phantom was created using a four-step process as detailed below. First, a patient’s chest-abdominal-pelvis scan with arms above head was used as the basis for creating the phantom. Large organs within the CT image volume were segmented semimanually into 3D triangulated polygon models using Image Segment software (RAI Laboratories, Duke University, Durham, NC). Second, the segmented datasets were imported into a 3D fitting program (Rhinoceros, www.rhino3d.com) to build 3D nonuniform rational B-spline (NURBS) surfaces. Since the CT images only covered the chest, abdomen, and pelvis regions, we manually added the head, arms, and legs to the phantom using existing reference male and female XCAT models. The addition and morphing process needed for this step was performed with Rhinoceros modeling software. The scale factors for the head size and lengths of the legs and arms for each model were determined using the PeopleSize program based on the statistics of the US male and female population (http://www.openerg.com/psz/index.html). Third, a multichannel large deformation diffeomorphic metric mapping (MC-LDDMM) technique was used to obtain the outline of the computational model. As the last step, the phantom was examined by an experienced observer to ensure anatomical accuracy. The examination was performed by comparing the organ/structure volumes of the phantom to those predicted from ICRP Publication 89 based on the model height.15 If necessary, minor adjustments were made by scaling undersized or oversized organs.
The full-body patient models consisted of 43 and 44 organs for male and female patients, respectively, including most of the radiosensitive organs defined by ICRP publication 103.16 All models were voxelized into a 3.45 mm resolution for input into the Monte Carlo simulation program.
With an atlas of computational phantoms that cover a broad range of human anatomy, a new clinical patient can be matched to a corresponding model that closely resembles the patient in terms of locations of major organs. In this study, each computational phantom was regarded as a clinical patient and matched to another phantom in the library (using a leave-one-out methodology). We used trunk height as an indicator for this matching. The trunk height is defined as the distance between the top of clavicle to the end of pelvic region. Figure 2 shows four pairs of matched models (male and female patients at 25% and 75% height and weight).
FIG. 2.
Example patient-model matching pairs as determined by trunk height. (a) 25th percentile male, (b) 75th percentile male, (c) 25th percentile female, and (d) 75th percentile female.
It should be noted that the matching process only ensures a close resemble of patient organ distribution in z dimension between the pairs. The overall body shape and size of the patient were accounted using the organ dose coefficients as detailed in Sec. 2.B. The trunk height was empirically found to be the best indicator for patient organ z dimensional distribution compared with BMI and patient weight.
2.B. CTDI-normalized-organ dose coefficients
As the prediction basis, Monte Carlo simulation was performed for each patient-specific model to estimated organ dose under fixed tube current. The simulation program was based on a benchmarked Monte Carlo subroutine package for photon, electron, and positron transport.17,18 A commercial CT scanner was modeled (SOMATOM Definition Flash, Siemens Healthcare, Forcheim, Germany). The modeling of the system has been previously validated against physical measurements with discrepancies in dose estimates within −12% to +5%.9 Clinical chest and abdominopelvic exams were simulated for each patient. For a chest scan, the image coverage was defined from 1 cm above the lung apex to 1 cm below the lung base. For an abdominopelvic scan, the image coverage was defined from 1 cm above the liver anterior to 1 cm below the ischium.
Organ doses were estimated by tallying the energy deposited in each organ. For the radiosensitive organs that were not explicitly modeled [salivary glands, oral mucosa, and extrathoracic (ET) region], the dose values were approximated by using the dose values of neighboring organs (pharynx and larynx). CTDIvol-normalized-organ dose coefficients were further determined for each organ, denoted as horgan. The 32-cm-diameter CTDI phantom was used for all protocols.
The relationship between horgan and average patient diameter was estimated as detailed in previous studies.9–11 An exponential regression model was established as
| (1) |
and
| (2) |
where dchest and dabdo denote the average chest and abdominopelvic diameter, respectively.
2.C. Tube current modulation profile
The TCM profile can be either directly extracted from the CT scanner system or estimated based on its principle. In this study, we employed a ray-tracing algorithm to simulate the TCM profile. In a study by the IMPACT group,19 the automatic exposure control systems of four CT manufacturers (GE, Siemens, Philips, and Toshiba) were evaluated using a cone-shaped phantom. The relationship between the tube current and phantom attenuation was evaluated. The study showed that for three of the manufacturers (GE, Siemens, and Toshiba), the tube current was exponentially related to phantom attenuation (ud). However, the strength of such a dependence was different across vendors, resulting in different behaviors of image quality across the patient population.
The logarithm of tube current (mA) can be modeled as a function of patient attenuation as
| (3) |
where the ud denotes the phantom attenuation, a denotes the modulation strength, which has a different value for different scanners, and mAo corresponds to the fixed mA, nonmodulation mA DC level. The tube current modulation for some scanners aims to achieve constant noise levels across patient sizes and body regions (generally GE scanners). Thus, a would be equal to 1 to ensure constant noise in all measured CT projections and uniform noise across images. The tube current modulation for other scanners allows for higher noise in high-attenuating body regions and larger patients (generally Siemens scanners). The modulation strength can be adjusted to three levels (weak, average, and strong) to control how strong the mA is depending on patient attenuation. Thus, a can be varied in order to emulate this dependency.
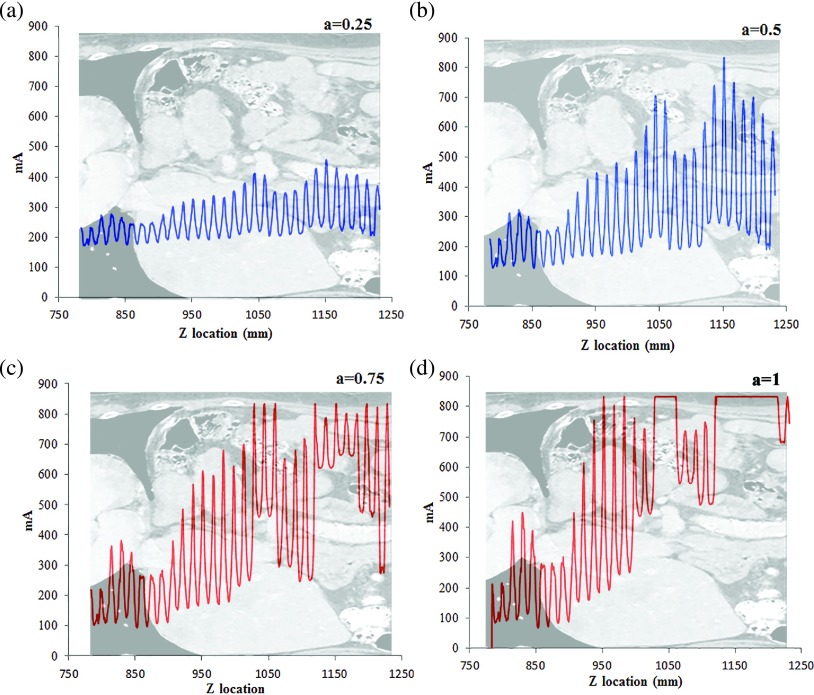
In this work, a previously developed ray-tracing algorithm was used to model the mA modulation profile based on attenuation.1 The algorithm estimated the attenuation at a given gantry angle, taking into account the geometry of the CT system, the fan angle of the x-ray beam, the polyenergetic x-ray energy spectrum, and the attenuation through the bowtie filter and the patient. A total of five mA modulation profiles were generated for each patient with a values of 0, 0.25, 0.5, 0.75, and 1 (Fig. 3). It should be noted that this study did not require the simulated mAs profile to precisely model the actual mAs profiles, which are usually proprietary and vary across vendors. Rather, the purpose was to generate a generalized and reasonable mA profile based on the principle of tube current modulation. An actual organ dose prediction scheme can either use a modeled mA profile or use an actual profile provided by the scanner.
FIG. 3.
Example tube current modulation profiles at four modulation strengths for a chest exam.
2.D. Organ dose prediction
The atlas of computational phantoms and matching technique provide a prior estimation of patient anatomy, whereas the tube current modulation profile can be used to model the specific irradiation field. We further integrate the patient anatomical feature with the TCM in order to determine the radiation field encompassing the organ of interest. More specifically, a weighted organ-specific CTDIvol factor was computed as1
| (4) |
and
| (5) |
where CTDIvol refers to the CTDIvol reported on the CT scanner console, which was derived using the average mAs of the CT exam. mAz is the mAs value at location z, and N is the number of organ voxels in the axial slice at location z. Such organ-specific CTDIvol can be regarded as a regional CTDIvol that reflects the strength of radiation field for a specific organ. The organ dose under TCM was further predicted as
| (6) |
where horgan denotes the h factor estimated based on patient size as noted in Sec. 2.B, and DTCM denotes the predicted organ dose for the patient under tube current modulation.
2.E. Validation of prediction accuracy of organ dose
The accuracy of the proposed prediction method was quantified using the following process: tube current modulation was incorporated into the Monte Carlo program; organ dose was estimated across the 58 patient models; each computational model, regarded as a clinical patient, was matched to one computational phantom in the library using the leave-one-out strategy. Organ dose was then predicted using the proposed method under five modulation strengths. Such a predicted organ dose was compared against the MC simulated organ dose values to quantify the prediction accuracy.
3. RESULTS
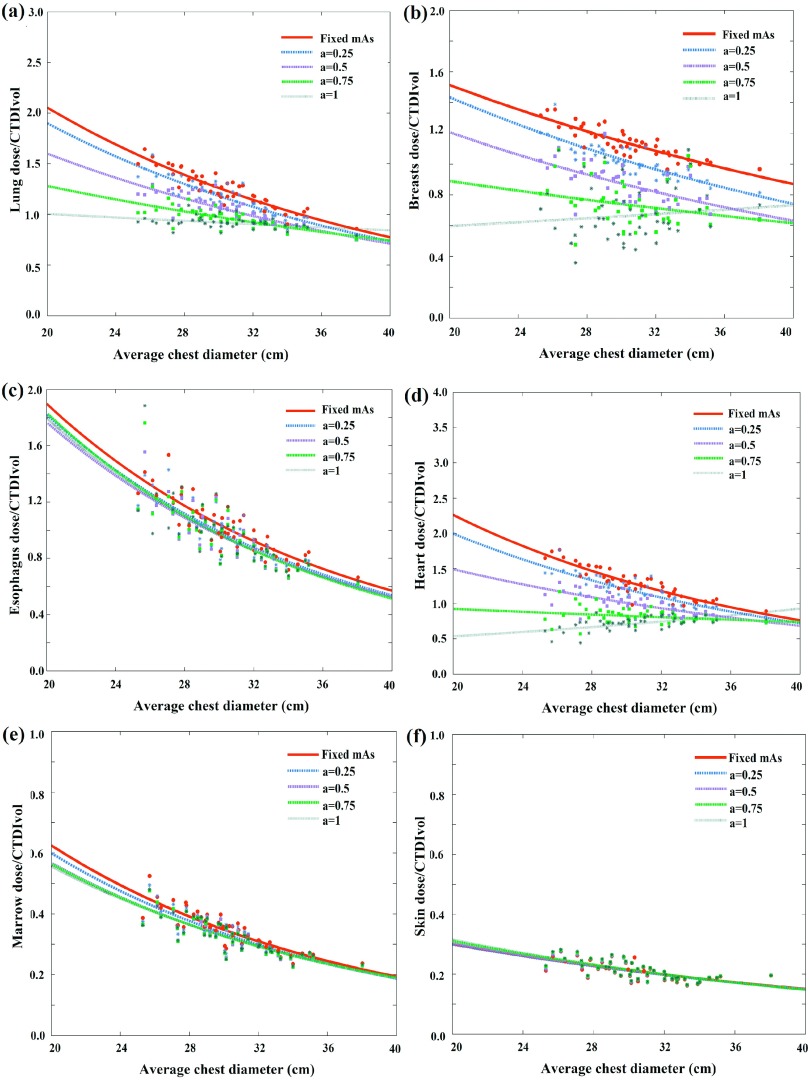
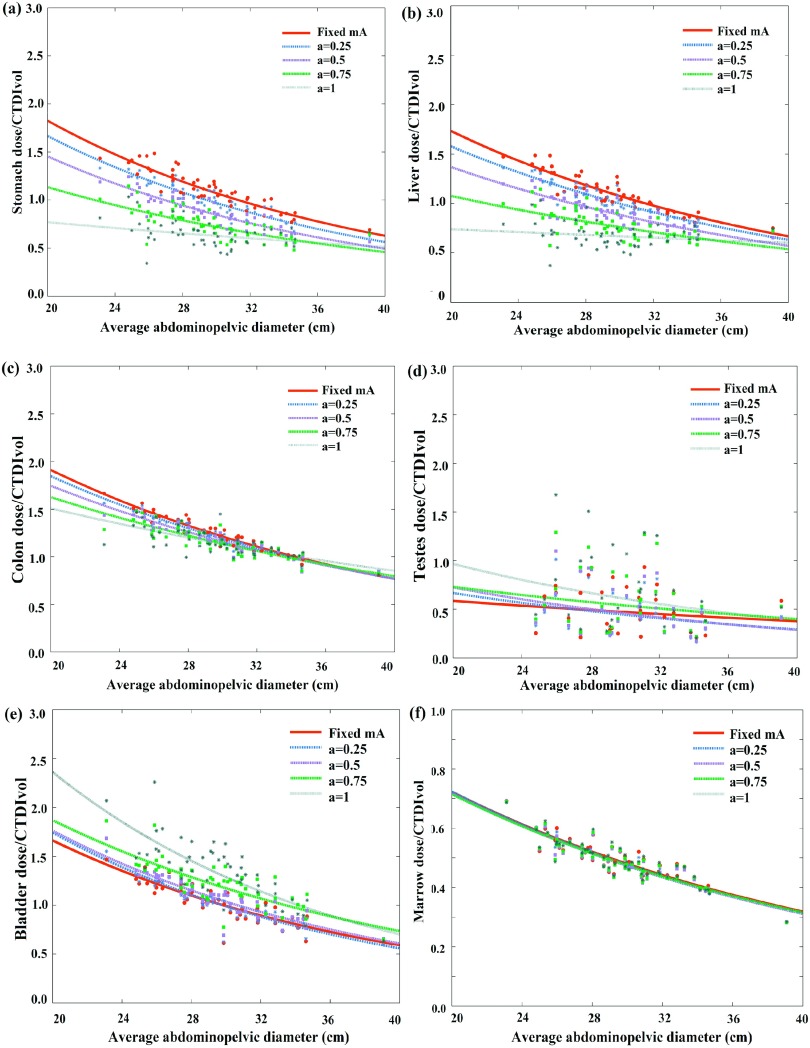
Figures 4 and 5 illustrate CTDIvol-normalized-organ dose based on MC simulation (the gold standard) at five modulation strengths as a function of patient size across 58 computational models for chest and abdominopelvic scans, respectively. For the majority of organs within the scan coverage, organ dose coefficients show a gradual decrease with the increase of tube current modulation level. For chest scan, the average organ dose coefficients decreased 42.8% for the heart, and 25.0% for the lungs for scans with a = 1 as compared to no modulation (a = 0). For the abdominopelvic scan, the average organ dose coefficients decreased 33.8% for the stomach and 31.6% for the liver when implemented with full TCM modulation (a = 1) as compared to no modulation (a = 0). For a few organs located at specific regions (shoulder and pelvic), the organ dose coefficients increased when tube current is modulated. The thyroid dose coefficients under chest exam increased 73.4% as compared with fixed mA scans. Similarly, the testes dose coefficients under abdominopelvic scan increased 39.5% for full modulation condition as compared to no modulation (a = 0). Further, for constant tube current condition, organ dose coefficients show a strong exponential relationship with patient size. But with TCM, since the TCM profile is different for each patient, this exponential relationship is less definitive.
FIG. 4.
Example CTDIvol-normalized-organ dose coefficients for chest scans plotted against the average chest diameter at five modulation strengths. Among the five curves, the CTDIvol-normalized-organ dose at fixed mA condition (a = 0) was used as the prediction basis. The other four curves were used as the gold standard for the prediction.
FIG. 5.
Example CTDIvol-normalized-organ dose coefficients for abdominopelvic scans plotted against the average abdominopelvic diameter at five modulation strengths. Among the five curves, the CTDIvol-normalized-organ dose at fixed mA condition (a = 0) was used as the prediction basis. The other four curves were used as the gold standard for the prediction.
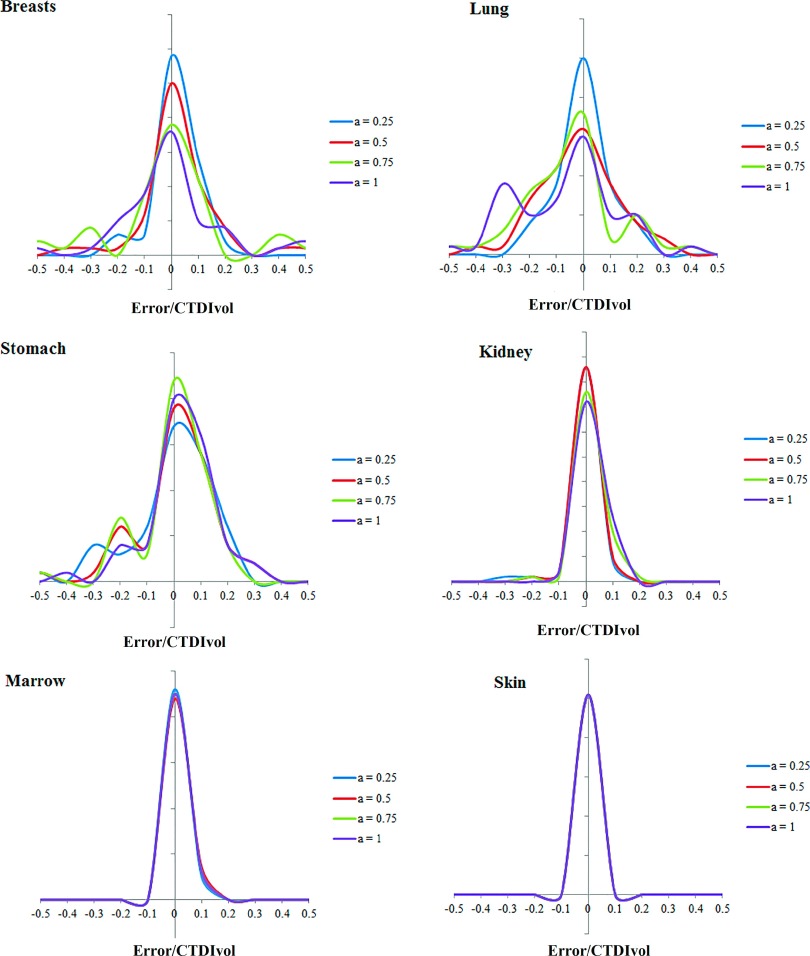
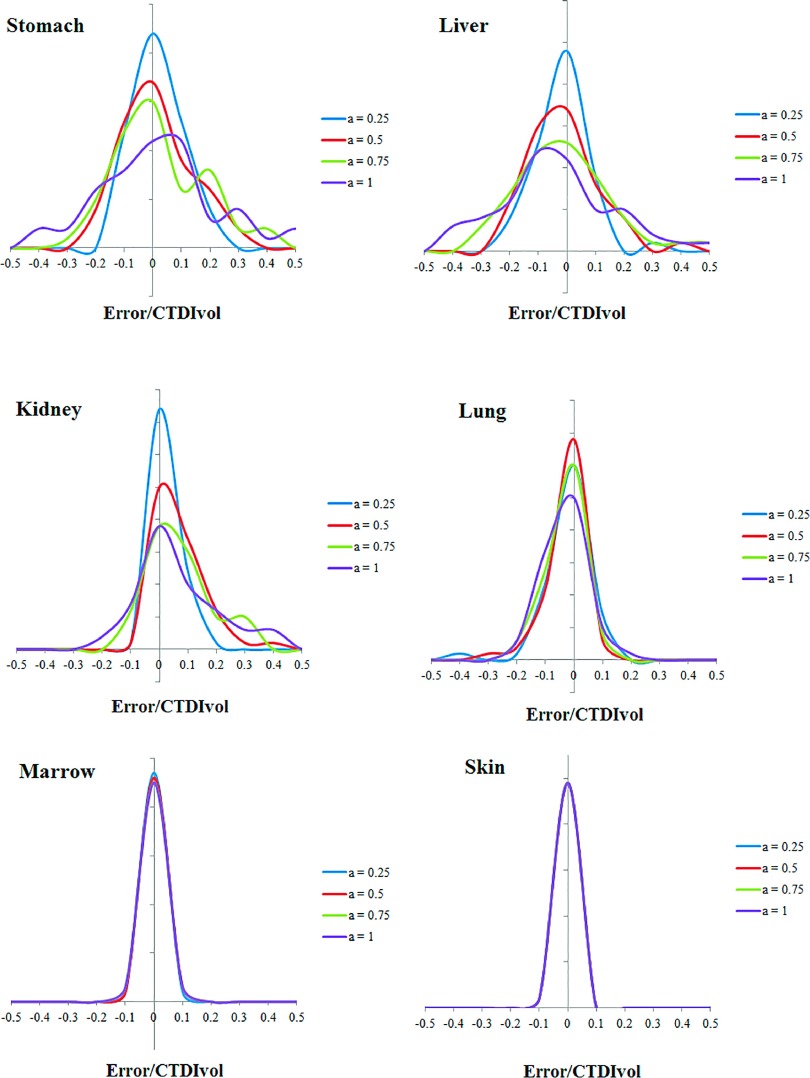
Comparing the results of Eq. (3) and full Monte Carlo simulation, Figs. 6 and 7 illustrate the prediction accuracy of organ dose at five tube current modulated strengths for chest and abdominopelvic scans, respectively. The histograms of prediction errors for six organs were plotted for each exam. The errors were further normalized by CTDIvol so that the accuracy of a given CT exam can be estimated. Given the average CTDIvol of a CT exam to be 10 mGy, the average error across all organs at full modulation (a = 1) was 0.91 mGy for chest exams and 0.82 mGy for abdominopelvic exams.
FIG. 6.
Histogram of error in predicting organ dose for chest scans. The x axis is determined as the differences between predicted and simulated organ dose normalized by the CTDIvol of the exam.
FIG. 7.
Histogram of error in predicting organ dose for abdominopelvic scans. The x axis is determined as the differences between predicted and simulated organ dose normalized by the CTDIvol of the exam.
As tabulated in Tables I and II, the average percentage error in organ dose estimation was generally within 20% across all organs and modulation profiles, except for organs located in the pelvic and shoulder regions. For organs within the image coverage, the prediction error generally increased with the increasing level of tube current modulation. This can be explained by the fact that this prediction technique approximates the organ dose under TCM scan using the organ dose coefficients estimated from fixed mAs. Such approximation may produce less accurate results when the tube is changing rapidly within the axial dimension. Furthermore, the error is larger and more varied for organs within the scan range. This is because the organ mismatch error, which refers to the location difference of an organ in the patient compared to the corresponding matched computational model, is more influential for these organs compared with distributed organs and organs outside the scan range. For organs within the scan range, if the organ is mismatched, the dose field we applied for the organ [quantified by ] can be different from the actual dose field. However, such organ mismatch error is less prominent for distributed organs and organs outside the scan range.
TABLE I.
Average differences between organ dose simulated by Monte Carlo (gold standard) and predicted by the patient matching method for chest scans. The differences are normalized by the CTDIvol of the exam.
| a = 0.25 (%) | a = 0.5 (%) | a = 0.75 (%) | a = 1 (%) | |
|---|---|---|---|---|
| Kidneys | 5.1 | 4.1 | 5.5 | 5.8 |
| Liver | 10.6 | 9.9 | 9.4 | 9.6 |
| Gall bladder | 8.2 | 7.8 | 7.9 | 8.4 |
| Spleen | 17.0 | 15.8 | 14.5 | 14.1 |
| Stomach | 14.9 | 13.8 | 12.5 | 12.4 |
| Brain | 0.4 | 0.7 | 1.0 | 1.1 |
| Bladder | 0.0 | 0.0 | 0.0 | 0.0 |
| Large intestine | 2.5 | 2.4 | 2.5 | 2.6 |
| Pancreas | 8.9 | 9.6 | 10.4 | 10.8 |
| Prostate | 0.0 | 0.0 | 0.0 | 0.0 |
| Adrenals | 10.4 | 10.1 | 10.1 | 10.3 |
| Eyes | 0.3 | 0.5 | 0.7 | 0.8 |
| Testes | 0.0 | 0.0 | 0.0 | 0.0 |
| Small intestine | 2.2 | 2.3 | 2.6 | 2.8 |
| Ovaries | 0.0 | 0.0 | 0.0 | 0.0 |
| Uterus | 0.0 | 0.0 | 0.0 | 0.0 |
| Vagina | 0.0 | 0.0 | 0.0 | 0.0 |
| Breasts | 6.7 | 10.1 | 14.4 | 16.9 |
| Heart | 8.8 | 8.5 | 9.4 | 12.3 |
| Lungs | 9.3 | 12.3 | 16.0 | 18.6 |
| Thyroid | 23.2 | 33.2 | 37.2 | 39.2 |
| Thymus | 13.5 | 14.4 | 17.1 | 21.6 |
| Esophagus | 15.7 | 21.7 | 26.0 | 27.3 |
| Bones | 4.3 | 4.3 | 5.1 | 5.9 |
| Marrow | 3.8 | 4.4 | 4.5 | 4.5 |
| Skin | 1.8 | 1.8 | 1.8 | 1.8 |
TABLE II.
Average differences between organ dose simulated by Monte Carlo (gold standard) and predicted by the patient matching method for abdominopelvic scans. The differences are normalized by the CTDIvol of the exam.
| a = 0.25 (%) | a = 0.5 (%) | a = 0.75 (%) | a = 1 (%) | |
|---|---|---|---|---|
| Kidneys | 3.5 | 4.6 | 8.7 | 11.7 |
| Liver | 5.5 | 6.7 | 8.8 | 13.1 |
| Gall bladder | 6.6 | 7.1 | 7.6 | 10.5 |
| Spleen | 5.8 | 6.3 | 6.9 | 9.3 |
| Stomach | 7.6 | 8.8 | 9.9 | 15.1 |
| Brain | 0.0 | 0.0 | 0.0 | 0.0 |
| Bladder | 13.4 | 23.2 | 30.6 | 33.9 |
| Large intestine | 4.3 | 6.1 | 7.3 | 8.1 |
| Pancreas | 4.7 | 5.2 | 7.3 | 9.5 |
| Prostate | 8.4 | 15.4 | 21.9 | 24.8 |
| Adrenals | 4.0 | 4.4 | 6.8 | 9.0 |
| Testes | 18.8 | 19.8 | 25.0 | 30.3 |
| Eyes | 0.0 | 0.0 | 0.0 | 0.0 |
| Small intestine | 5.4 | 7.0 | 7.9 | 8.3 |
| Ovaries | 4.5 | 7.6 | 12.3 | 18.2 |
| Uterus | 6.7 | 12.4 | 15.7 | 19.8 |
| Vagina | 7.8 | 11.3 | 16.8 | 24.8 |
| Breasts | 5.9 | 5.7 | 5.7 | 5.8 |
| Heart | 9.0 | 8.3 | 8.1 | 8.2 |
| Lungs | 4.7 | 3.8 | 3.9 | 4.2 |
| Thyroid | 0.7 | 0.8 | 0.9 | 1.1 |
| Thymus | 3.2 | 4.3 | 5.5 | 6.4 |
| Esophagus | 4.9 | 4.4 | 3.9 | 3.7 |
| Bones | 3.6 | 3.8 | 4.2 | 4.9 |
| Marrow | 2.4 | 2.4 | 2.4 | 2.4 |
| Skin | 1.5 | 1.5 | 1.5 | 1.6 |
4. DISCUSSION
The governing principle for dose optimization is to determine the minimum amount of radiation dose that achieves the targeted image quality. The fundamental step to achieve that is to prospectively quantify the radiation dose and image quality so that the optimization can be performed prior to the exam in order to minimize individual radiation burden. Within this study, we proposed prediction models for organ dose for clinical chest and abdominopelvic CT exams. The prior information for prediction includes patient anatomical information (trunk height and chest/abdominopelvic diameter), the CTDIvol for the exam, and the tube current modulation profile. The prediction was achieved by combining a patient matching technique and a library of organ dose coefficients from Monte Carlo simulation. Such prediction allows one to potentially optimize the CT protocol by dynamically adjusting the scanning parameters in advance of a CT exam in order to achieve a target diagnostic performance.
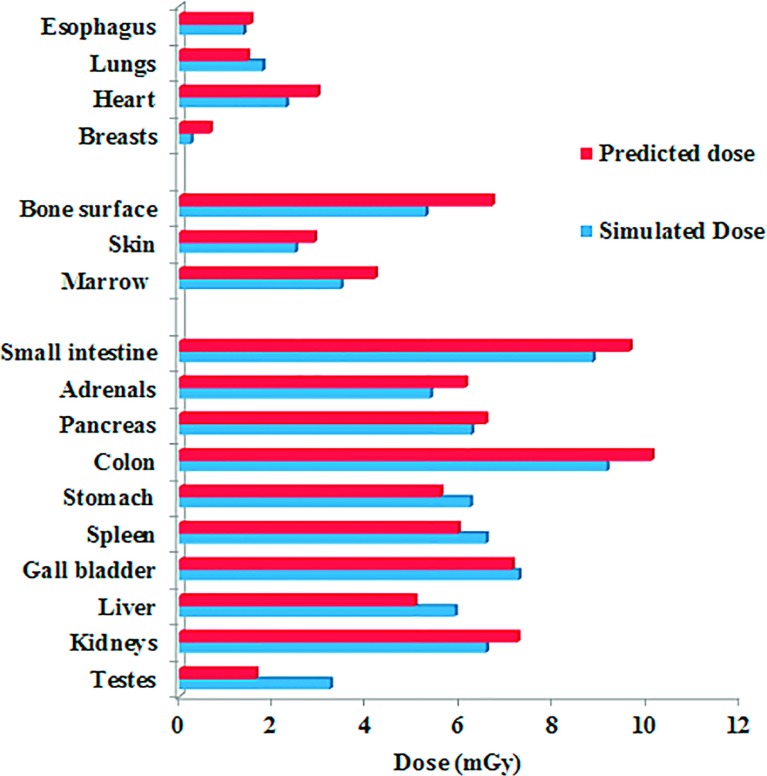
As an example of how the prediction models proposed in this study can be implemented for a clinical patient, a 31-year-old male patient who undergoes an abdominopelvic CT examination is considered. The CTDIvol for the examination (based on a 32-cm-diameter CTDI phantom) is 7.01 mGy. Given that patients’ trunk height is 60.3 cm, one computational phantom in the library was matched to the patient (age 35, trunk height 60.1). Using the h factor estimated based on patient size and the TCM profile of the patient (TCM modulation strength a = 0.5), the organ doses were predicted for the patient. The predicted organ doses were compared with the Monte Carlo simulated organ doses with the TCM profile modeled. As shown in Fig. 8, the predicted organ doses agreed well with the expected organ doses.
FIG. 8.
Predicted and simulated organ dose for a patient (age 31 year old, trunk height 60.3 cm, weight 77.9 kg) undergoing a clinical abdominopelvic protocol.
Several studies have reported the estimation of organ dose under tube current modulation. Schlattl et al. proposed organ dose coefficients under tube current modulation for four computational phantoms.20 The effects of axial and longitudinal TCM modulation were reported. The impact of body stature on dose conversion coefficients was also comprehensively studied. To compare our results against Schlattl et al., three phantoms in Schlattl et al. (RCP-AM, RCP-AF, Donna) were matched to phantoms in the XCAT library based on patient height and weight information. The comparison was made for chest scans (TCM modulation strength a = 0.5). The differences in TCM organ dose coefficients between the two studies were in the range of 2%–63% across different organs. This difference may be explained by the discrepancies in TCM profiles and adipose composition of the phantoms. Khatonabadi et al. studied the organ dose for 32 chest and 39 abdominopelvic exams for a clinical CT system (Sensation 64, Siemens Healthcare, Forchheim, Germany).12 The study developed an organ-specific CTDIvol to effectively account for the local radiation field under tube current modulation. Li et al. estimated organ dose for chest and abdominopelvic scans for a XCAT phantom under five modulation strengths.1 The study derived a weighted organ-specific CTDIvol, which included not only the effect of local mAs variation but also the variation of organ volume along the z dimension. These prior studies mostly focused on retrospective estimation of organ dose. Our study used a methodology consistent with the previous work to prospectively approximate the local radiation field using weighted CTDIvol values. By using an atlas-based patient matching strategy, our study enables one to predict the organ dose across a large library of patient models at multiple modulation strengths. Such prospective estimation can aid in the design of individualized protocols in relation to a targeted level of image quality.
In this study, we took an empirical approach to assess and predict organ doses in advance of a CT examination. While this empirical approach yielded reasonable accuracy, certain elements of CT irradiation conditions are better to be more fully integrated in this approach. In particular, better accuracy would be expected if the actual dose profile under the TCM irradiation condition was incorporated.21 This is the topic of continued investigation in our laboratory.
Our study has several limitations. First, we did not explicitly model the tube current modulation profiles to precisely agree with a specific CT system. Furthermore, the TCM profiles generated based on the report from the IMPACT group (published in 2005) may not represent the TCM profiles of more recent CT systems. Further investigation should be conducted in order to model the realistic tube current modulation profiles of the system. Second, the prediction error, while small for the majority of the organs, was relatively large for a few organs (thyroid for chest scans; bladder, testes, prostate, ovaries, uterus for abdominopelvic scans). These organs were located centrally in asymmetrical regions of the body. Since the photon flux is highly nonuniform in the x-y plane in these regions, the approximation using fixed-mA coefficients would have limited the accuracy to reflect the dynamic change in the x-y plane. Furthermore, the error induced by patient mismatching may be more prominent for these organs. We are developing correction factors to account for such effects.
5. CONCLUSION
In this study, we developed an atlas-based method to predict organ dose for clinical chest and abdominopelvic exams under tube current modulation. The prediction was achieved by accurately modeling the patient anatomy and the x-ray irradiation field. The predicted organ dose agrees well with the simulate dose with average differences within 1 mGy for both chest and abdominopelvic exams. Such prediction model allows one to optimize the CT protocol by dynamically adjusting the scanning parameters to achieve a target diagnostic performance with the knowledge of organ dose in advance of a CT exam.
REFERENCES
- 1.Li X., Segars W. P., and Samei E., “The impact on CT dose of the variability in tube current modulation technology: A theoretical investigation,” Phys. Med. Biol. 59, 4525–4548 (2014). 10.1088/0031-9155/59/16/4525 [DOI] [PMC free article] [PubMed] [Google Scholar]
- 2.McCollough C. H., Guimaraes L., and Fletcher J. G., “In defense of body CT,” AJR, Am. J. Roentgenol. 193, 28–39 (2009). 10.2214/AJR.09.2754 [DOI] [PMC free article] [PubMed] [Google Scholar]
- 3.Brenner D. J. and Hall E. J., “Computed tomography–An increasing source of radiation exposure,” N. Engl. J. Med. 357, 2277–2284 (2007). 10.1056/NEJMra072149 [DOI] [PubMed] [Google Scholar]
- 4.McCollough C. H., Chen G. H., Kalender W., Leng S., Samei E., Taguchi K., Wang G., Yu L., and Pettigrew R. I., “Achieving routine submillisievert CT scanning: Report from the summit on management of radiation dose in CT,” Radiology 264, 567–580 (2012). 10.1148/radiol.12112265 [DOI] [PMC free article] [PubMed] [Google Scholar]
- 5.Frush D. P., Donnelly L. F., and Rosen N. S., “Computed tomography and radiation risks: What pediatric health care providers should know,” Pediatrics 112, 951–957 (2003). 10.1542/peds.112.4.951 [DOI] [PubMed] [Google Scholar]
- 6.Larson D. B., Wang L. L., Podberesky D. J., and Goske M. J., “System for verifiable CT radiation dose optimization based on image quality. Part I. Optimization model,” Radiology 269, 167–176 (2013). 10.1148/radiol.13122320 [DOI] [PubMed] [Google Scholar]
- 7.Ding A., Mille M. M., Liu T., Caracappa P. F., and Xu X. G., “Extension of RPI-adult male and female computational phantoms to obese patients and a Monte Carlo study of the effect on CT imaging dose,” Phys. Med. Biol. 57, 2441–2459 (2012). 10.1088/0031-9155/57/9/2441 [DOI] [PMC free article] [PubMed] [Google Scholar]
- 8.Turner A. C., Zhang D., Khatonabadi M., Zankl M., DeMarco J. J., Cagnon C. H., Cody D. D., Stevens D. M., McCollough C. H., and McNitt-Gray M. F., “The feasibility of patient size-corrected, scanner-independent organ dose estimates for abdominal CT exams,” Med. Phys. 38, 820–829 (2011). 10.1118/1.3533897 [DOI] [PMC free article] [PubMed] [Google Scholar]
- 9.Tian X., Li X., Segars W. P., Paulson E. K., Frush D. P., and Samei E., “Pediatric chest and abdominopelvic CT: Organ dose estimation based on 42 patient models,” Radiology 270, 535–547 (2014). 10.1148/radiol.13122617 [DOI] [PMC free article] [PubMed] [Google Scholar]
- 10.Li X., Samei E., Segars W. P., Sturgeon G. M., Colsher J. G., and Frush D. P., “Patient-specific radiation dose and cancer risk for pediatric chest CT,” Radiology 259, 862–874 (2011). 10.1148/radiol.11101900 [DOI] [PMC free article] [PubMed] [Google Scholar]
- 11.Sahbaee P., Segars W. P., and Samei E., “Patient-based estimation of organ dose for a population of 58 adult patients across 13 protocol categories,” Med. Phys. 41, 072104(12pp.) (2014). 10.1118/1.4883778 [DOI] [PMC free article] [PubMed] [Google Scholar]
- 12.Khatonabadi M., Zhang D., Mathieu K., Kim H. J., Lu P., Cody D., Demarco J. J., Cagnon C. H., and McNitt-Gray M. F., “A comparison of methods to estimate organ doses in CT when utilizing approximations to the tube current modulation function,” Med. Phys. 39, 5212–5228 (2012). 10.1118/1.4736807 [DOI] [PMC free article] [PubMed] [Google Scholar]
- 13.Segars W. P., Bond J., Frush J., Hon S., Eckersley C., Williams C. H., Feng J., Tward D. J., Ratnanather J. T., Miller M. I., Frush D., and Samei E., “Population of anatomically variable 4D XCAT adult phantoms for imaging research and optimization,” Med. Phys. 40, 043701(11pp.) (2013). 10.1118/1.4794178 [DOI] [PMC free article] [PubMed] [Google Scholar]
- 14.Segars W. P., Mahesh M., Beck T. J., Frey E. C., and Tsui B. M., “Realistic CT simulation using the 4D XCAT phantom,” Med. Phys. 35, 3800–3808 (2008). 10.1118/1.2955743 [DOI] [PMC free article] [PubMed] [Google Scholar]
- 15.ICRP, “Basic anatomical and physiological data for use in radiological protection: Reference values,” ICRP No. 89 (International Commission on Radiological Protection, 2002). [Google Scholar]
- 16.ICRP, “The 2007 recommendations of the international commission on radiological protection,” ICRP No. 103 (International Commission on Radiological Protection, 2007). [Google Scholar]
- 17.Sempau J., Baro J., Fernandezvarea J. M., and Salvat F., “Penelope - An algorithm for Monte Carlo simulation of the penetration and energy-loss of electrons and positrons in matter,” Nucl. Instrum. Methods Phys. Res., Sect. B 100, 31–46 (1995). 10.1016/0168-583x(95)00349-5 [DOI] [Google Scholar]
- 18.Fernandez-Varea J. M., Sempau J., Acosta E., and Salvat F., “Experimental benchmarks of the Monte Carlo code PENELOPE,” Nucl. Instrum. Methods Phys. Res., Sect. B 207, 107–123 (2003). 10.1016/s0168-583x(03)00453-1 [DOI] [Google Scholar]
- 19.Keat N., Report 05016 CT scanner automatic exposure control systems, London, England, ImPACT , http://www.impactscan.org/reports/Report05016.htm, accessed January 2014.
- 20.Schlattl H., Zankl M., Becker J., and Hoeschen C., “Dose conversion coefficients for CT examinations of adults with automatic tube current modulation,” Phys. Med. Biol. 55, 6243–6261 (2010). 10.1088/0031-9155/55/20/013 [DOI] [PubMed] [Google Scholar]
- 21.Dixon R. L. and Boone J. M., “Dose equations for tube current modulation in CT scanning and the interpretation of the associated CTDIvol,” Med. Phys. 40, 111920(14pp.) (2013). 10.1118/1.4824918 [DOI] [PubMed] [Google Scholar]


