

Abstract
Social anxiety disorder (SAD) is characterized by over-reactivity of fear-related circuits in social or performance situations and associated with marked social impairment. We used dynamic causal modeling (DCM), a method to evaluate effective connectivity, to test our hypothesis that SAD patients would exhibit dysfunctions in the amygdala–prefrontal emotion regulation network. Thirteen unmedicated SAD patients and 13 matched healthy controls performed a series of facial emotion and object discrimination tasks while undergoing fMRI. The emotion-processing network was identified by a task-related contrast and motivated the selection of the right amygdala, OFC, and DLPFC for DCM analysis. Bayesian model averaging for DCM revealed abnormal connectivity between the OFC and the amygdala in SAD patients. In healthy controls, this network represents a negative feedback loop. In patients, however, positive connectivity from OFC to amygdala was observed, indicating an excitatory connection. As we did not observe a group difference of the modulatory influence of the FACE condition on the OFC to amygdala connection, we assume a context-independent reduction of prefrontal control over amygdalar activation in SAD patients. Using DCM, it was possible to highlight not only the neuronal dysfunction of isolated brain regions, but also the dysbalance of a distributed functional network.
Keywords: amygdala, DLPFC, fMRI, orbitofrontal cortex, social anxiety disorder
Introduction
With a 12-month prevalence of 14%, anxiety disorders range among the most common psychiatric disorders and are associated not only with a substantial impairment of individual health-related quality of life, but also a high burden on public health (Wittchen et al. 2011). Social anxiety disorder (SAD), as one of the most prevalent anxiety disorders, is affecting about 10.1 million individuals in the EU (Wittchen et al. 2011; American Psychiatric Association Task Force on DSM-IV. 2000, for a review on international prevalence data on SAD refer to Hofmann et al. (2010)). According to DSM-IV, the disorder is defined as marked and persistent fear of one or more social or performance situations in which the person is exposed to unfamiliar people or to scrutiny by others. These situations are avoided or endured with intense anxiety and distress and therefore lead to a marked impairment of social life (American Psychiatric Association Task Force on DSM-IV. 2000).
The clinical phenotype of SAD is thus characterized by an over-reactivity of the protective function of anxiety, entailing a perceptual and cognitive bias toward threat (Robinson et al. 2012). On a neurobiological level, these symptoms suggest a dysbalance within fear-related neuronal circuits.
It is well established that the amygdala in conjunction with regions of the prefrontal cortex plays a fundamental role in the generation, encoding and regulation of affective values (Phillips et al. 2008). Within this network, it is assumed that the amygdala mediates fast evaluation of novel stimuli (Larson et al. 2006), recognition of potential threat (Davis 1992), and autonomous assignment of affective values (Phan et al. 2002; Wager et al. 2003). In animal studies, electric stimulation of the amygdala was shown to lead to social withdrawal, and to provoke fear and anxiety (Drevets 2001). Concordantly, abnormal patterns of amygdalar activation in patients with SAD and other anxiety disorders have been observed during confrontation with emotional faces (Stein et al. 2002; Phan et al. 2006; Stein, Simmons et al. 2007b; Monk et al. 2008) and exposition to other social stimuli, such as speech anticipation (Lorberbaum et al. 2004) and reception of praise or criticism (Blair et al. 2008).
Besides the amygdala, abnormal activations within the orbitofrontal cortex (OFC) or ventromedial PFC (vmPFC) have been reported for (social) anxiety disorder patients (McClure et al. 2007; Monk et al. 2008; Labuschagne et al. 2012; Price et al. 2011) and nonclinical volunteers with heightened anxiety trait (Stein, Simmons et al. 2007b; Etkin et al. 2004). It is well established (see Phillips et al. 2008; Bechara et al. 2000; Barbas 2000 for a review) that the amygdala and parts of the prefrontal cortex sustain strong bidirectional anatomical and functional connections via the uncinate fasciculus (Pollak et al. 2010), where indications of decreased structural connectivity were observed in SAD patients (Phan et al. 2009; Baur et al. 2013; Liao et al. 2011).
With regard to emotion regulation, the OFC is assumed to act as a central hub to integrate and modulate neural activation to monitor and control emotional responses (Rule et al. 2002). Notably, SAD patients exhibit decreased functional connectivity (Liao, Chen et al. 2010a; Hahn et al. 2011) and structural connectivity (Phan et al. 2009; Baur et al. 2013; Liao et al. 2011), as well as abnormal neural habituation within this amygdala–orbitofrontal network (Sladky et al. 2012). A study using Granger causality on a resting-state dataset revealed increased effective connectivity of this connection in SAD patients (Liao, Qiu et al. 2010b).
While medial PFC regions are assumed to be involved in autonomous regulation processes (Phillips et al. 2008), lateral prefrontal areas, predominantly the dorsolateral PFC (DLPFC), are associated with the utilization of cognitive reappraisal strategies and voluntary downregulation of (negative) emotional affects (Ochsner and Gross 2005; Kalisch et al. 2006; Erk et al. 2007; Goldstein et al. 2007) and unwanted memory associations (Anderson et al. 2004). The importance of this region in the context of anxiety disorders is further implicated by a study reporting a reduction of regulatory efficiency of the DLPFC in individuals with high trait anxiety (Bishop 2008).
Although activation mapping of emotion regulation processes and functional as well as anatomical connectivity analyses have pinpointed important constituents of a brain network relevant for affective regulation and the pathophysiology of SAD, it remains unclear how to delineate the effective functional relationships and causal dependencies. In the last years, continuous refinements of high-field MRI and analysis techniques have significantly broadened our empirical possibilities to facilitate conclusions on a network level beyond mere description of regions with altered neural activation. Whereas some studies have evaluated the functional relationship between distinct brain regions based on their time-synchronized activity, these studies do not allow for conclusions about the directionality of these interactions and their causal relationships. To investigate and model this effective connectivity, DCM (Friston et al. 2003) is a validated state of the art research method (Daunizeau et al. 2009; Schuyler et al. 2010; Moran et al. 2011) that has already provided very promising results in the context of clinical disorders (see Seghier et al. (2010) for a review and methodological recommendations).
DCM is a hypothesis-driven analysis approach based on Bayesian model comparison procedures (Bayes 1763; Jeffkeys 1939) that has been introduced to fMRI data analysis by Friston et al. (2003). In contrast to conventional fMRI analysis methods such as statistical parametric mapping (SPM), which are mainly used for a descriptive representation of brain activation changes, the application of DCM allows for the creation of models to assess the dynamic behavior of specific brain regions regarding their causal relationships under the influence of external perturbations, such as the applied experimental conditions. Compared with other connectivity modeling approaches, DCM comprises a neuronal model where the not directly observable neuronal behavior is modeled and related using a biophysical forward model (Balloon model, Buxton et al. 1998) to the hemodynamic changes in brain regions of interest that are observable by the use of functional MRI (Friston et al. 2003). The neural state equation is fundamental for DCM and given by:
where vector z represents the time series of the neural state within a priori defined ROIs and vector u contains the time course(s) (1,…, j,…, n) of the experimental paradigm. Internal steady state connectivity parameters are stored in matrix A, modulatory effects on these connections given stimulus uj are described by matrix B, and matrix C represents the direct influence of a stimulus on a given ROI. DCM can be seen as an expansion of traditional GLM analysis, which can only account for the direct influence (C) of a stimulus regressor. Thus, the above equation represents a linear combination of different internal and external influences (i.e., intrinsic connectivity A, modulation B, and inputs C) that explain the empirically observed neural activity.
In the present study, we applied effective connectivity analysis as implemented in DCM on fMRI data of SAD patients and healthy controls during an emotion discrimination task. We hypothesized that SAD patients would exhibit dysfunctions in the amygdala–OFC regulatory network. More precisely, we expected less inhibition of amygdalar activation by the OFC in SAD patients. This could be a consequence of reduced inhibitory feedback from OFC to amygdala, implying a reduction in top-down neuronal control. Alternatively, decreased excitatory output from amygdala to OFC could indicate a dysfunction in bottom up processes that lead to a decreased neuronal activity in the OFC, causing a less efficient reactivity toward amygdalar hyperactivation. Based on the important role of the DLPFC in voluntary emotion- and attention-regulation mechanisms, we also assessed its interaction with the amygdala–OFC network.
Materials and Methods
Data used for the DCM analysis is based on the study population from Sladky et al. (2012) comprising 15 SAD patients (7 males/8 females, mean age (SD): 26.6 (±8.6) years) and 15 healthy age- and gender-matched controls (HC, 8 males/7 females, mean age (SD): 25.4 (±3.4) years). Before the fMRI measurement, all subjects were clinically assessed by a medical doctor and had to be free from any neurological peculiarities, pregnancy and any former or current psychiatric DSM-IV diagnosis, except SAD in the patient group. All subjects were tested for current drug use and reported abstinence from any psychotropic medication within the last 3 months and denied any history of substance abuse. All subjects were financially reimbursed for their participation and provided informed written consent. Withdrawing from this study at any time did not entail negative consequences for the subjects. The study protocol was approved by the institutional review board of the Medical University of Vienna.
Subjects were presented with a sequence of emotional face discrimination tasks (FACE) and object discrimination tasks (OBJECT) in an interleaved blocked design (20 s baseline, 20 s FACE, 20 s baseline, 20 s OBJECT × 5 repetitions) (Fig. 1) (Hariri et al. 2002), while undergoing functional magnetic resonance imaging. For the FACE stimuli, photos from the NimStim set of facial expressions (human faces expressing anger, disgust, fear, happiness, sadness, surprise, or calmness) (Tottenham et al. 2009) were positioned in a triangular arrangement. The image in the center acted as a reference face and subjects had to decide using a custom-built MRI-compatible response pad whether the outer left or right image matches the emotional valence of the reference image. After each button press, new triplets were presented until the total duration of the task block elapsed. As a control condition (OBJECT), contours of 2D polygons overlaid on a skin-toned ellipsoidal background were shown using the same presentation and task setup. These stimuli were created in-house and optimized to avoid differences between experimental conditions regarding their visual impression (color, outer form, spatial frequencies) and task difficulty. A white crosshair placed on a black background was used as a baseline conditions. An illustration of the fMRI paradigm and the stimuli can be found in (Sladky et al. 2012, Fig. 1).
Figure 1.

Experimental paradigm. Facial emotion and object discrimination tasks were presented in alternating individual blocks for 20 s. Between task conditions, a white fixation cross was presented for 20 s to serve as a baseline condition. Each task block was repeated 5 times, yielding a total paradigm length of ∼7 min. The vertical lines depict the individual stimulus onsets in one randomly selected subject, the black time course presents the paradigm regressor convolved with SPM's canonical hemodynamic response function, which was used for the GLM and DCM analyses.
All measurements were carried out on a Siemens 3 T TIM Trio whole-body MR scanner with a 32-channel head coil. Two hundred twenty-five whole-brain volumes (matrix size: 128 px × 128 px × 20 slices; in-plane resolution 1.5 × 1.5 mm2, 3 mm slice thickness, and 2.1-mm interslice gap to reduce intravoxel dephasing effects (Robinson et al. 2004) were obtained at a repetition time of TR = 1.8 s (TE = 40 ms) employing a single-shot echo planar imaging (EPI) sequence.
The acquired functional data were preprocessed and analyzed in SPM8 (FIL Methods Group, Wellcome Trust Centre for Neuroimaging, University College London, http://www.fil.ion.ucl.ac.uk). Due to the interleaved slice acquisition, preprocessing comprised slice-timing correction (Kiebel et al. 2007; Sladky et al. 2011). Furthermore, we performed realignment to compensate for subject movement, segmentation (Ashburner and Friston 2005), normalization to standard MNI space, and spatial smoothing (8 mm FWHM) using the default settings in SPM8.
To localize the task-relevant brain network, we used FACE > OBJECT as contrast of interest in a second level t-test, with age, gender, and Liebowitz Social Anxiety Scale score as covariates. Among other brain areas, bilateral amygdalae (rAmy [16, −8, −16], lAmy [−18, −12, −18] MNI [mm]), medial OFC ([2, 48, −18] MNI [mm]), and bilateral dorsolateral PFC (rDLPFC [56, 34, 8], lDLPFC [−42, 30, 2] MNI [mm]) were activated in all subjects (P < 0.05 FWE corrected) (Sladky et al. 2012) (Fig. 2). As SAD-related group effects were of primary interest, our DCM analysis was restricted to the right hemisphere of the amygdala–prefrontal networks, where the strongest task × group interaction effects were found in our previous study. The observed lateralization is also in accordance with previous findings, which suggested a functional specialization of the right amygdala for the processing and encoding of nonverbal affective stimuli (Anderson et al. 2003; Ochsner et al. 2004).
Figure 2.
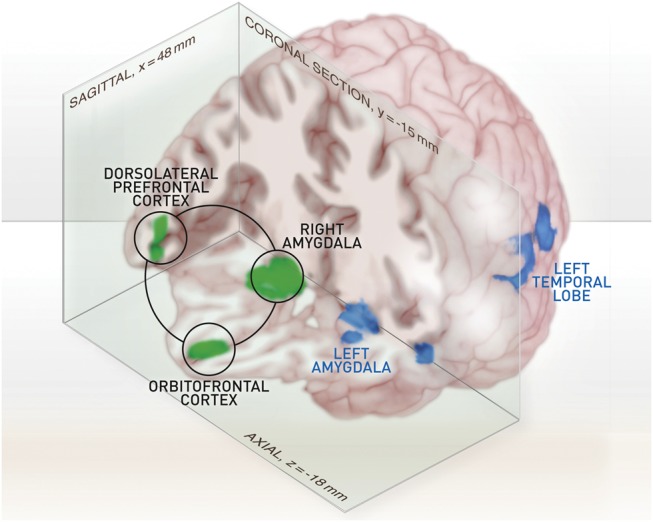
Rendering of the statistical parametric map from the emotion discrimination tasks. This map is based on the group-level result from all subjects (n = 30), with FACE > OBJECT as contrast of interest, thresholded at P < 0.05 (FWE whole-brain corrected for multiple comparisons) with n = 75 voxels minimum cluster size. Right amygdala, OFC, and right DLPFC are highlighted and were used as volumes of interest for the subsequent DCM analysis.
Whitened and detrended time courses of these regions were extracted for each subject using SPM8's volume of interest (VOI) extraction batch script (individual activation maxima within a search radius of r = 10 mm from first-level analysis used as centers, VOI radius r = 10 mm, single-subject significance threshold P < 0.05 uncorrected, first eigenvariate used as summary statistics). Two subjects from each group were excluded, as they did not exhibit significant activation in the search radius of all 3 VOIs. Based on these time courses, DCM, as implemented in DCM10 (SPM8, Build 4548, November 2011), was used to model the effective connectivity between these regions. All inputs (i.e., the time courses from our experimental conditions) were mean-centered.
Our DCM analysis was split up into 2 parts. First, we investigated task-dependent effective connectivity between our regions of interest to select connections with significant posterior evidence. Then, based on the results from the first analysis, we analyzed the connectivity parameters and their modulation by the face condition. Bayesian model averaging (BMA) (Hoeting et al. 1999; Penny et al. 2010) was used to infer on the model structure (i.e., the significant connections between the ROIs), the connectivity parameters, and their modulations across the group.
Initial Model Space
Converging neurobiological findings suggest bidirectional anatomical connections between the OFC and the amygdala. The DLPFC is assumed to interact with this emotion regulation network. However, it is not fully understood at what point this interaction occurs. It has been argued (e.g., by Ray and Zald 2012) that there are no direct anatomical connections from the DLPFC to the amygdala. However, particularly with respect to the pathophysiology of SAD, it might be conceivable that DLPFC affects amygdalar activation via unknown anatomical pathways or without inducing significant changes within the OFC. This prior uncertainty motivated the comparison of models containing all possible connectivity configurations of the DLPFC with the OFC and the amygdala, yielding a model space of 24 = 16 models (Supplementary Fig. S1).
The model allowed the fMRI task (i.e., combination of the FACE and OBJECT regressors) to act on the investigated system as a driving input via an affective (amygdala) and a cognitive (DLPFC) brain region. There is strong evidence for a direct visual input to the DLPFC (BA46/47 is assumed to correspond to area 12 in monkeys) (Ongür and Price 2000). We have no reason to assume a direct visual pathway to the brain region that is here identified as OFC (BA11). However, given the strong bidirectional connections within the prefrontal network (Phillips et al. 2008), visual information that enters this network can be further relayed to the OFC via the DLPFC and subsequent nodes.
One method to evaluate the relative performance of the models would be Bayesian Model Selection (Penny et al. 2004), which could also be used to compare the model structures of the winning models of the SAD and HC groups. However, to avoid the potential of false-negative results, the inference on model structure alone might be insufficient, as the deficits of SAD could be mediated by modulation differences and not by alterations in the model structure.
An alternative method is BMA (Hoeting et al. 1999; Penny et al. 2010), which provides an average over all parameter estimates within a model space weighted by their respective posterior probability.
In this study, BMA has been selected as it can account for the uncertainty of the model structure and, at the same time, allows for inference on the connectivity parameters (Stephan et al. 2010). BMA overcomes the methodological limitations of earlier implementations of DCM that required a 2-step approach of model selection and parameter averaging (Seghier et al. 2010).
Revised Model Space
For the sake of computational complexity, connections that were not significant in both groups were removed from the initial model space. All other connections were considered for our revised model space, reducing the bias of an improper a priori exclusion resulting from potential sensitivity constraints in the first-level analysis. In this second step, the FACE condition was introduced to the models as an additional driving stimulus, entering also through the amygdala and the DLPFC. Furthermore, all variations of possible modulatory effects of FACE on the individual connections were modeled (Supplementary Fig. S2). BMA was used once more to estimate the model parameters for patients and healthy controls. Employing a 2-sample t-test, we compared the resulting connectivity parameter estimates and their modulations, using Bonferroni correction to account for multiple comparisons.
Results
Model Structure
The first analysis step was to determine the connectivity between the right amygdala, medial OFC, and DLPFC under perturbation by the TASK (i.e., the combination of FACE and OBJECT time courses). In both groups, no significant interaction was found for the connection from rDLPFC to rAMY (2-sample t-test, P > 0.8 in HC, P > 0.4 in SAD). Consequently, this connection was excluded from the revised model space. All other connections were found to be significant (Supplementary Fig. S1).
Intrinsic Connections
After we justified a principal functional network, a set of 128 models covering all possible interactions for the emotional face discrimination task were modeled (27 = 128 models, Supplementary Fig. S2). Again, BMA was applied for both groups individually and a 2-sided 2-sample t-test was used for comparisons. See Supplementary Figure S2 for a visualization of the model structure, Supplementary Figures S3 and S4 for the averaged connectivity parameter estimates, and Table 1 for a numerical representation of the results.
Table 1.
BMA results
| HC |
SAD |
P (corr.) | |||||
|---|---|---|---|---|---|---|---|
| Mean | SD | Sign. | Mean | SD | Sign. | ||
| Intrinsic connectivity (A) | |||||||
| Amygdala to OFC | 0.73 | 0.23 | ** | 0.25 | 0.28 | ** | <0.01 |
| OFC to amygdala | −0.24 | 0.12 | ** | 0.10 | 0.16 | * | <0.01 |
| Amygdala to DLPFC | 1.28 | 0.29 | ** | 0.49 | 0.28 | ** | <0.01 |
| DLPFC to amygdala | – | – | – | – | – | ||
| DLPFC to OFC | 0.06 | 0.14 | n.s. | 0.16 | 0.16 | ** | n.s. |
| OFC to DLPFC | −0.38 | 0.18 | ** | −0.10 | 0.21 | n.s. | <0.01 |
| Modulation by FACE (B) | |||||||
| Amygdala to OFC | 0.08 | 0.16 | n.s. | −0.11 | 0.17 | * | <0.05 |
| OFC to amygdala | −0.19 | 0.14 | ** | −0.14 | 0.15 | ** | n.s. |
| Amygdala to DLPFC | −0.06 | 0.20 | n.s. | −0.25 | 0.19 | ** | n.s. |
| DLPFC to amygdala | – | – | – | – | – | ||
| DLPFC to OFC | 0.01 | 0.11 | n.s. | −0.13 | 0.17 | * | n.s. |
| OFC to DLPFC | −0.06 | 0.17 | n.s. | −0.08 | 0.18 | n.s. | n.s. |
| Driving Inputs (C) | |||||||
| TASK to amygdala | −0.05 | 0.03 | ** | −0.07 | 0.04 | ** | n.s. |
| TASK to DLPFC | −0.09 | 0.06 | ** | −0.14 | 0.05 | ** | n.s. |
| FACE to amygdala | 0.18 | 0.04 | ** | 0.14 | 0.06 | ** | n.s. |
| FACE to DLPFC | 0.28 | 0.08 | ** | 0.32 | 0.08 | ** | n.s. |
Note: Numerical representation of the intrinsic connectivity and modulation effects of the emotional face discrimination task.
n.s., not significant. OFC, orbitofrontal cortex. DLPFC, dorsolateral prefrontal cortex. See Supplementary Figures S3 and S4 for a bar chart representation of these values.
t-Test: *P < 0.05; **P < 0.01.
Connection Between Amygdala and OFC
Both groups showed a significant bottom-up connection from the amygdala to the OFC (Fig. 3). However, connectivity parameter estimates were significantly increased in HC (P < 0.05 corrected). In the top-down connection (OFC to amygdala), we found negative functional connectivity in HC (P < 0.01) and positive connectivity in SAD patients (P < 0.05) with a significant group difference (P < 0.05 corr.) (Fig. 4).
Figure 3.

DCM networks for healthy controls (left) and SAD patients (right). BMA results reveal a group difference in model structure, connectivity parameter estimates, and modulatory effects of emotional faces (significant group differences highlighted in Fig. 4).
Figure 4.

Significant group differences between healthy controls (left) and SAD patients (right). Most importantly, the negative feedback loop between amygdala and OFC, found in HC, is dysfunctional in SAD (also see Fig. 5). SAD patients further exhibited decreased effective connectivity from amygdala and OFC to the DLPFC.
Connection Between Amygdala and DLPFC
We found positive connectivity from amygdala to DLPFC (P < 0.01), which was significantly lower in SAD patients (P < 0.05 corr.). Note that based on a priori knowledge from previous studies and our own first analysis step, a direct functional connection from DLPFC to amygdala was excluded.
Connection Between OFC and DLPFC
In HC, we observed a statistically significant negative connection (representing an inhibitory influence) from OFC to DLPFC (P < 0.01). In SAD patients, this connection was found not significant (P > 0.09). Comparing groups showed significantly less inhibition of OFC on DLPFC in SAD patients (P < 0.05 corr.). The positive connection from DLPFC to OFC, on the other hand, was only significant in SAD patients (P < 0.01). The difference between group means was not significant for this connection.
Self-connections
Self-connections in these models did not differ between groups.
Modulatory Influence of the FACE Condition
In healthy controls, faces had a negative influence only on the backward connection from OFC to amygdala. This was found also in SAD patients where faces also significantly reduced the connectivity from amygdala to DLPFC and DLPFC to OFC. A positive direct influence on amygdala and DLPFC was found for emotional faces in both groups (Fig. 3).
Importantly, while we did not observe a significant modulation difference in the OFC to amygdala connection, the sum of the posterior intrinsic connectivity parameters and modulation parameters in SAD patients yields a net modulation that is not significantly different from zero (Fig. 5).
Figure 5.

Modulation of the OFC to amygdala connection by emotional faces. The modulatory influence of the emotion decimation task was not different between groups. However, in combination with the positive intrinsic connectivity, the negative modulatory influence was not sufficient to effectively downregulate amygdalar activation in SAD patients. Group BMA results and SD are shown, *P < 0.05 in 2-sided 2-sample t-test.
Discussion
DCM has highlighted 2 crucial differences between healthy volunteers and SAD patients within the examined anxiety regulation network. Most importantly, patients show a functional disruption in the negative feedback loop between the amygdala and the OFC. In addition, connections from DLPFC, a structure that is implicated in executive functions and voluntary emotion regulation, exhibit altered connectivity patterns in SAD patients, particularly in combination with the processing of emotional faces. Using a reduced model, we found marked connectivity differences between the patient group and healthy controls already in the first DCM analysis step. These findings were corroborated by the results of the revised level model that also accounted for our experimental perturbation of this network using an emotional face discrimination task.
Reduced Effective Connectivity Between OFC and Amygdala in SAD Patients
As reported previously by our group (Sladky et al. 2012), in SAD patients, the amygdala in conjunction with the OFC shows abnormal BOLD reactivity toward emotional faces. Activations in these regions were increased in SAD patients at the beginning of the emotion discrimination task, which indicated a disruption in this emotion regulation network. Based on these findings obtained with SPM, we analyzed the activation time courses of the task-active amygdala–prefrontal network using DCM to assess the underlying temporal and causal dependency. While in healthy controls, the forward connection from the task-active region in the OFC to the amygdala showed inhibitory influence, our results clearly demonstrate positive (excitatory) connectivity between OFC and the amygdala in SAD patients, suggesting an SAD-specific disruption of the prefrontal top-down regulation mechanism of amygdalar activation.
The existence of this connection has been repeatedly demonstrated by invasive studies in rodents (Krettek and Price 1977; McDonald 1991) and nonhuman primates (Amaral and Price 1984; Barbas and Olmos 1990; Ghashghaei and Barbas 2002). The use of diffusion tensor imaging (DTI) also allowed for noninvasive examination of this connection, known as the uncinate fasciculus, in humans (Pollak et al. 2010). In fact, DTI of the uncinate fasciculus also revealed a decrease in structural connectivity in SAD patients (Phan et al. 2009; Baur et al. 2013; Liao et al. 2011). Its functional importance has been shown by direct electrophysiological recordings (Quirk et al. 2003) and neuroimaging studies (Stein, Wiedholz et al. 2007a; Robinson et al. 2008). It is assumed that this particular connection is crucial for fear extinction (Phelps et al. 2004), perceiving and interpreting threat signals (Cannistraro and Rauch 2003) and other emotional valences (Barbas et al. 2003; Gusnard et al. 2003). Noteworthy, activation in distinct neural clusters within the OFC are assumed to have both inhibitory and excitatory influence on amygdalar activation, as shown by direct microstimulation of homologous brain structures in rats (Vidal-Gonzalez et al. 2006; Sierra-Mercado et al. 2011).
In concert with these findings, the positive intrinsic connectivity between OFC and amygdala in SAD patients observed in this study could explain the increased trait and state anxiety. While the modulatory effect of the emotion discrimination task was negative and showed no difference between groups, it was not sufficient to decrease the resulting total connectivity (i.e., A + B, as described in detail in the Introduction) to a significantly negative level in SAD patients (Fig. 5). The decreased forward connection from amygdala to OFC in SAD patients could indicate a missing automatic recruitment of OFC's regulatory functions, which, actually, could be considered an adequate adaptive strategy under consideration of the absent negative orbitofrontal feedback. This assumption is supported by the negative modulatory influence of the emotion discrimination task on this connection in SAD patients found here and the decreased functional resting-state connectivity reported by others (Hahn et al. 2011).
These new findings, thus, might offer an alternative and more parsimonious interpretation for our previously presented results (Sladky et al. 2012). Therein, we concluded that relative hyperactivation of the OFC in SAD patients, compared with healthy subjects, could indicate an increased effort in affective top-down regulation. The positive effective connectivity from OFC to amygdala, however, clearly suggests that emotional faces alone do not fully account for the observed activation. Instead, parts of the SAD patients' amygdalar reactivity could be explained by the enforcing nature of the neural influences from OFC.
A resting-state fMRI study revealed increased effective connectivity from both amygdalae to several clusters within the ventral part of the prefrontal cortex in SAD patient (Liao, Qiu et al. 2010b). Therein, it is suggested that the increased connectivity during resting state (i.e., in absence of a specific task condition) could indicate an impaired regulation between OFC and amygdala. This notion is strongly supported by the results from our study, as we also observed increased connectivity (i.e., positive in SAD patients, negative in HC, see Figs 3–5) in the connection from OFC to amygdala. However, one has to note that there are important differences between these 2 studies. First, it can be expected that there are fundamentally different brain processes involved in task-based and resting-state fMRI. While former is strongly influenced by the external perturbation of a task that is designed to mimic certain features of social interaction, latter can be associated with introspection and self-referring thoughts including rumination or brooding. Furthermore, there are profound methodological differences between DCM and Granger causality, which was used in (Liao, Qiu et al. 2010b). It is not fully clear how those 2 metrics can be related to each other. Finally, the 2 studies report clusters in the prefrontal cortex that are anatomically distinct, which could indicate that they are responsible for completely different brain functions due to the functional heterogeneity of the frontal lobe.
The Role of the DLPFC in the Proposed Network
In healthy controls, compared with SAD patients, DLPFC exhibits significantly increased positive effective connectivity in afferents from the amygdala and increased negative connectivity in connections from the OFC. The latter connection was found not significant in patients. The first-level DCM analysis allowed us to reject the hypothesis of direct effective connectivity from DLPFC to amygdala. Removing this connection from the second analysis step was based not only on past literature but also corroborated by our empirical findings.
The reduced negative feedback from OFC could indicate a missing neurobiological signal that, in healthy persons, initiates the release and redeployment of cognitive resources. This missing feedback could provide a neurobiological explanation for the biased attention toward threat signals and increased distractibility that are hallmark symptoms of anxiety (Desimone and Duncan 1995; Eysenck 1997; Mathews and Mackintosh 1998; Bishop et al. 2004; Schneier et al. 2011). In major depression, however, functional connectivity between OFC and rDLPFC was found to be increased (Frodl et al. 2010). Alternatively, in SAD patients, the emotion discrimination task could require an increased processing demand for the DLPFC, for example, for the inhibition of unwanted memory associations (Anderson and Green 2001; Anderson et al. 2004) and attentional shifts (Dias et al. 1996). Then, the regulatory power of the OFC could be insufficient to significantly down-modulate activation of the DLPFC. In SAD patients, a positive connectivity from DLPFC to OFC was found, which was not significant in healthy subjects. However, we did not observe significant group differences for this connection.
Additionally, we found significantly decreased connectivity from amygdala to DLPFC in SAD patients, even more so in the presence of the FACE stimuli (Fig. 4, Supplementary Figs S3 and S4). While we need to acknowledge the explorative nature of this finding, we could conceive of 2 distinct mechanisms responsible for the reduced connectivity. First, the functional dissociation between amygdala and DLPFC could be a neurobiological basis or concomitant of the altered perception of threat signals, dysfunctions in social cognition, and the biased cognitive appraisal of social situations. Second, it could also be suggested that the downregulation of this connection is actually part of an adaptive avoidance strategy.
Recent evidence stresses the importance to exploit new technical possibilities as they provide a considerably more integrated and comprehensive picture of the underlying neuronal mechanisms. The results of this study, for example, point toward a dysbalance of a functional system rather than the dysfunction of one distinct brain region.
Based on the data of this study, it might be reasonable to assume that treatment leads to a rebalancing of the functional system involved in fear-processing and processing of emotional stimuli in general. However, it is unclear, if this rebalancing would lead to a functional normalization of the same network and regions that are active in healthy individuals. Alternatively, it is possible that the recruitment of different functional pathways is required. This might depend on the severity of the clinical symptoms or the progress and scale of remission. Therefore, besides the obvious important possibilities for basic research of brain function and dysfunction, the use of effective connectivity analysis methods, such as DCM, could lead to investigation methods for therapy progress monitoring, outcome prediction, and clinical decision-making.
Limitations and Further Directions
The authors would like to raise awareness of 2 limitations of the current study. First, we need to acknowledge that the current sample might not be fully representative for the total population of SAD patients and subclinical cases, which additionally might suffer from confounding comorbidities. Yet, due to the sensitivity of DCM, the herein observed group differences were highly significant, despite the limited sample size, indicating the presence of relevant group effects. Therefore, this study makes not only a case for the applicability of DCM in psychiatric research due its high sensitivity and low variability; it also highlights the disorder of a crucial neuronal pathway in SAD patients, justifying further research with a larger clinical population.
Second, the investigation of pharmacological and psychotherapeutic interventions was beyond the scope of this study. All volunteering patients were scanned within a few days after their initial admission and before the onset of their facultative therapy plan.
Conclusion
By applying DCM, we observed an important neurophysiologic dysfunction in the emotion regulation circuitry of SAD patients. In matched healthy controls, our model of effective connectivity clearly indicates a downregulating feedback mechanism between the amygdala and the OFC. In SAD patients, however, this particular connection exhibits positive, excitatory effective connectivity, and, therefore, upregulates amygdalar activation. The results of the study presented herein, strongly corroborate previous reports of reduced connectivity between the OFC and amygdala in SAD patients by providing first evidence for the actual causal dependencies within this network. Our study thus provides a neurobiological model that may explain the altered appreciation of affective stimuli typically observed in SAD patients.
Supplementary Material
Supplementary material can be found at: http://www.cercor.oxfordjournals.org/
Funding
This research was supported by an OeNB grant (Austrian National Bank, P12982) awarded to C. Windischberger and a FWF grant (Austrian Science Fund, P23021) awarded to R. Lanzenberger. The funders had no role in study design, data collection, and analysis, decision to publish, or preparation of the manuscript. R.L. received travel grants and conference speaker honoraria from AstraZeneca and Lundbeck A/S. Funding to pay the Open Access publication charges for this article was provided by R. Lanzenberger (FWF, Austrian Science Fund, P23021).
Supplementary Material
Notes
We thank A. Holik for generating the face stimulus triplets, J. Tröstl for helpful comments on the manuscript, and S. Hackhofer, I. Hofer-Irmler, and S. Kasper for medical support. Conflict of Interest: None declared.
References
- Amaral DG, Price JL. Amygdalo-cortical projections in the monkey (macaca fascicularis) J Comp Neurol. 1984;230:465–496. doi: 10.1002/cne.902300402. [DOI] [PubMed] [Google Scholar]
- American Psychiatric Association Task Force on DSM-IV. Diagnostic and statistical manual of mental disorders: DSM-IV-TR. 4th ed. Arlington, VA, USA: American Psychiatric Publishing, Inc; 2000. [Google Scholar]
- Anderson AK, Christoff K, Panitz D, De Rosa E, Gabrieli JDE. Neural correlates of the automatic processing of threat facial signals. J Neurosci. 2003;23:5627–5633. doi: 10.1523/JNEUROSCI.23-13-05627.2003. [DOI] [PMC free article] [PubMed] [Google Scholar]
- Anderson MC, Green C. Suppressing unwanted memories by executive control. Nature. 2001;410:366–369. doi: 10.1038/35066572. [DOI] [PubMed] [Google Scholar]
- Anderson MC, Ochsner KN, Kuhl B, Cooper J, Robertson E, Gabrieli SW, Glover GH, Gabrieli JDE. Neural systems underlying the suppression of unwanted memories. Science. 2004;303:232–235. doi: 10.1126/science.1089504. [DOI] [PubMed] [Google Scholar]
- Ashburner J, Friston KJ. Unified segmentation. Neuroimage. 2005;26:839–851. doi: 10.1016/j.neuroimage.2005.02.018. [DOI] [PubMed] [Google Scholar]
- Barbas H. Proceedings of the human cerebral cortex: from gene to structure and function connections underlying the synthesis of cognition, memory, and emotion in primate prefrontal cortices. Brain Res. 2000;52:319–330. doi: 10.1016/s0361-9230(99)00245-2. [DOI] [PubMed] [Google Scholar]
- Barbas H, Olmos JD. Projections from the amygdala to basoventral and mediodorsal prefrontal regions in rhesus monkey. J Comp Neurol. 1990;300:549–571. doi: 10.1002/cne.903000409. [DOI] [PubMed] [Google Scholar]
- Barbas H, Saha S, Rempel-Clower N, Ghashghaei T. Serial pathways from primate prefrontal cortex to autonomic areas may influence emotional expression. BMC Neurosci. 2003;4:25. doi: 10.1186/1471-2202-4-25. [DOI] [PMC free article] [PubMed] [Google Scholar]
- Baur V, Brühl AB, Herwig U, Eberle T, Rufer M, Delsignore A, Jäncke L, Hänggi J. Evidence of frontotemporal structural hypoconnectivity in social anxiety disorder: a quantitative fiber tractography study. Hum Brain Mapp. 2013;34:437–446. doi: 10.1002/hbm.21447. [DOI] [PMC free article] [PubMed] [Google Scholar]
- Bayes T. An essay towards solving a problem in the doctrine of chances. Philos Trans R Soc Lond. 1763;53:370–418. [PubMed] [Google Scholar]
- Bechara A, Damasio H, Damasio AR. Emotion, decision making and the orbitofrontal cortex. Cereb Cortex. 2000;10:295–307. doi: 10.1093/cercor/10.3.295. [DOI] [PubMed] [Google Scholar]
- Bishop S. Trait anxiety and impoverished prefrontal control of attention. Nat Neurosci. 2008;12:92–98. doi: 10.1038/nn.2242. [DOI] [PubMed] [Google Scholar]
- Bishop S, Duncan J, Brett M, Lawrence A. Prefrontal cortical function and anxiety: controlling attention to threat-related stimuli. Nat Neurosci. 2004;7:184–188. doi: 10.1038/nn1173. [DOI] [PubMed] [Google Scholar]
- Blair K, Geraci M, Devido J, McCaffrey D, Chen G, Vythilingam M, Ng P, Hollon N, Jones M, Blair RJR, et al. Neural response to self- and other referential praise and criticism in generalized social phobia. Arch Gen Psychiatry. 2008;65:1176–1184. doi: 10.1001/archpsyc.65.10.1176. [DOI] [PMC free article] [PubMed] [Google Scholar]
- Buxton RB, Wong EC, Frank LR. Dynamics of blood flow and oxygenation changes during brain activation: the balloon model. Magn Reson Med. 1998;39:855–864. doi: 10.1002/mrm.1910390602. [DOI] [PubMed] [Google Scholar]
- Cannistraro PA, Rauch SL. Neural circuitry of anxiety: evidence from structural and functional neuroimaging studies. Psychopharmacol Bull. 2003;37:8. [PubMed] [Google Scholar]
- Daunizeau J, David O, Stephan KE. Dynamic causal modelling: a critical review of the biophysical and statistical foundations. Neuroimage. 2009;58:312–322. doi: 10.1016/j.neuroimage.2009.11.062. [DOI] [PubMed] [Google Scholar]
- Davis M. The role of the amygdala in fear and anxiety. Annu Rev Neurosci. 1992;15:353–375. doi: 10.1146/annurev.ne.15.030192.002033. [DOI] [PubMed] [Google Scholar]
- Desimone R, Duncan J. Neural mechanisms of selective visual attention. Annu Rev Neurosci. 1995;18:193–222. doi: 10.1146/annurev.ne.18.030195.001205. [DOI] [PubMed] [Google Scholar]
- Dias R, Robbins TW, Roberts AC. Dissociation in prefrontal cortex of affective and attentional shifts. Nature. 1996;380:69–73. doi: 10.1038/380069a0. [DOI] [PubMed] [Google Scholar]
- Drevets WC. Neuroimaging and neuropathological studies of depression: implications for the cognitive-emotional features of mood disorders. Curr Opin Neurobiol. 2001;11:240–249. doi: 10.1016/s0959-4388(00)00203-8. [DOI] [PubMed] [Google Scholar]
- Erk S, Kleczar A, Walter H. Valence-specific regulation effects in a working memory task with emotional context. Neuroimage. 2007;37:623–632. doi: 10.1016/j.neuroimage.2007.05.006. [DOI] [PubMed] [Google Scholar]
- Etkin A, Klemenhagen KC, Dudman JT, Rogan MT, Hen R, Kandel ER, Hirsch J. Individual differences in trait anxiety predict the response of the basolateral amygdala to unconsciously processed fearful faces. Neuron. 2004;44:1043–1055. doi: 10.1016/j.neuron.2004.12.006. [DOI] [PubMed] [Google Scholar]
- Eysenck MW. Anxiety and cognition: a unified theory. Hove, UK: Psychology Press; 1997. [Google Scholar]
- Friston KJ, Harrison L, Penny W. Dynamic causal modelling. Neuroimage. 2003;19:1273–1302. doi: 10.1016/s1053-8119(03)00202-7. [DOI] [PubMed] [Google Scholar]
- Frodl T, Bokde ALW, Scheuerecker J, Lisiecka D, Schoepf V, Hampel H, Möller HJ, Brückmann H, Wiesmann M, Meisenzahl E. Functional connectivity bias of the orbitofrontal cortex in drug-free patients with major depression. Biol Psychiatry. 2010;67:161–167. doi: 10.1016/j.biopsych.2009.08.022. [DOI] [PubMed] [Google Scholar]
- Ghashghaei HT, Barbas H. Pathways for emotion: interactions of prefrontal and anterior temporal pathways in the amygdala of the rhesus monkey. Neuroscience. 2002;115:1261–1279. doi: 10.1016/s0306-4522(02)00446-3. [DOI] [PubMed] [Google Scholar]
- Goldstein M, Brendel G, Tuescher O, Pan H, Epstein J, Beutel M, Yang Y, Thomas K, Levy K, Silverman M, et al. Neural substrates of the interaction of emotional stimulus processing and motor inhibitory control: an emotional linguistic go/no-go fMRI study. Neuroimage. 2007;36:1026–1040. doi: 10.1016/j.neuroimage.2007.01.056. [DOI] [PubMed] [Google Scholar]
- Gusnard DA, Ollinger JM, Shulman GL, Cloninger CR, Price JL, Van Essen DC, Raichle ME. Persistence and brain circuitry. Proc Natl Acad Sci USA. 2003;100:3479–3484. doi: 10.1073/pnas.0538050100. [DOI] [PMC free article] [PubMed] [Google Scholar]
- Hahn A, Stein P, Windischberger C, Weissenbacher A, Spindelegger C, Moser E, Kasper S, Lanzenberger R. Reduced resting-state functional connectivity between amygdala and orbitofrontal cortex in social anxiety disorder. Neuroimage. 2011;56:881–889. doi: 10.1016/j.neuroimage.2011.02.064. [DOI] [PubMed] [Google Scholar]
- Hariri AR, Mattay VS, Tessitore A, Kolachana B, Fera F, Goldman D, Egan MF, Weinberger DR. Serotonin transporter genetic variation and the response of the human amygdala. Science. 2002;297:400. doi: 10.1126/science.1071829. [DOI] [PubMed] [Google Scholar]
- Hoeting JA, Madigan D, Raftery AE, Volinsky CT. Bayesian model averaging: a tutorial. Stat Sci. 1999;14:382–417. [Google Scholar]
- Hofmann SG, Asnaani A, Hinton DE. Cultural aspects in social anxiety and social anxiety disorder. Depress Anxiety. 2010;27:1117–1127. doi: 10.1002/da.20759. [DOI] [PMC free article] [PubMed] [Google Scholar]
- Jeffkeys H. Theory of probability. Oxford, UK: Oxford University Press; 1939. [Google Scholar]
- Kalisch R, Wiech K, Herrmann K, Dolan RJ. Neural correlates of self-distraction from anxiety and a process model of cognitive emotion regulation. J Cogn Neurosci. 2006;18:1266–1276. doi: 10.1162/jocn.2006.18.8.1266. [DOI] [PMC free article] [PubMed] [Google Scholar]
- Kiebel S, Klöppel S, Weiskopf N, Friston K. Dynamic causal modeling: a generative model of slice timing in fMRI. Neuroimage. 2007;34:1487–1496. doi: 10.1016/j.neuroimage.2006.10.026. [DOI] [PubMed] [Google Scholar]
- Krettek JE, Price JL. Projections from the amygdaloid complex to the cerebral cortex and thalamus in the rat and cat. J Comp Neurol. 1977;172:687–722. doi: 10.1002/cne.901720408. [DOI] [PubMed] [Google Scholar]
- Labuschagne I, Phan KL, Wood A, Angstadt M, Chua P, Heinrichs M, Stout JC, Nathan PJ. Medial frontal hyperactivity to sad faces in generalized social anxiety disorder and modulation by oxytocin. Int J Neuropsychopharmacol. 2012;15:883–889. doi: 10.1017/S1461145711001489. [DOI] [PubMed] [Google Scholar]
- Larson CL, Schaefer HS, Siegle GJ, Jackson CAB, Anderle MJ, Davidson RJ. Fear is fast in phobic individuals: amygdala activation in response to fear-relevant stimuli. Biol Psychiatry. 2006;60:410–417. doi: 10.1016/j.biopsych.2006.03.079. [DOI] [PubMed] [Google Scholar]
- Liao W, Chen H, Feng Y, Mantini D, Gentili C, Pan Z, Ding J, Duan X, Qiu C, Lui S. Selective aberrant functional connectivity of resting state networks in social anxiety disorder. Neuroimage. 2010a;52:1549–1558. doi: 10.1016/j.neuroimage.2010.05.010. [DOI] [PubMed] [Google Scholar]
- Liao W, Qiu C, Gentili C, Walter M, Pan Z, Ding J, Zhang W, Gong Q, Chen H. Altered effective connectivity network of the amygdala in social anxiety disorder: a resting-state FMRI study. PLOS One. 2010b;5:e15238. doi: 10.1371/journal.pone.0015238. [DOI] [PMC free article] [PubMed] [Google Scholar]
- Liao W, Xu Q, Mantini D, Ding J, Machado-de Sousa JP, Hallak JEC, Trzesniak C, Qiu C, Zeng L, Zhang W, et al. Altered gray matter morphometry and resting-state functional and structural connectivity in social anxiety disorder. Brain Res. 2011;1388:167–177. doi: 10.1016/j.brainres.2011.03.018. [DOI] [PubMed] [Google Scholar]
- Lorberbaum JP, Kose S, Johnson MR, Arana GW, Sullivan LK, Hamner MB, Ballenger JC, Lydiard RB, Brodrick PS, Bohning DE, et al. Neural correlates of speech anticipatory anxiety in generalized social phobia. Neuroreport. 2004;15:2701–2705. [PubMed] [Google Scholar]
- Mathews A, Mackintosh B. A cognitive model of selective processing in anxiety. Cogn Ther Res. 1998;22:539–560. [Google Scholar]
- McClure EB, Monk CS, Nelson EE, Parrish JM, Adler A, Blair RJR, Fromm S, Charney DS, Leibenluft E, Ernst M, et al. Abnormal attention modulation of fear circuit function in pediatric generalized anxiety disorder. Arch Gen Psychiatry. 2007;64:97–106. doi: 10.1001/archpsyc.64.1.97. [DOI] [PubMed] [Google Scholar]
- McDonald AJ. Organization of amygdaloid projections to the prefrontal cortex and associated striatum in the rat. Neuroscience. 1991;44:1–14. doi: 10.1016/0306-4522(91)90247-l. [DOI] [PubMed] [Google Scholar]
- Monk CS, Telzer EH, Mogg K, Bradley B, Xiaoqin M, Hugo L, Gang C, McClure-Tone E, Ernst M, Pine D. Amygdala and ventrolateral prefrontal cortex activation to masked angry faces in children and adolescents with generalized anxiety disorder. Arch Gen Psychiatry. 2008;65:568–576. doi: 10.1001/archpsyc.65.5.568. [DOI] [PMC free article] [PubMed] [Google Scholar]
- Moran RJ, Jung F, Kumagai T, Endepols H, Graf R, Dolan RJ, Friston KJ, Stephan KE, Tittgemeyer M. Dynamic causal models and physiological inference: a validation study using isoflurane anaesthesia in rodents. PLOS One. 2011;6:e22790. doi: 10.1371/journal.pone.0022790. [DOI] [PMC free article] [PubMed] [Google Scholar]
- Ochsner K, Gross J. The cognitive control of emotion. Trends Cogn Sci. 2005;9:242–249. doi: 10.1016/j.tics.2005.03.010. [DOI] [PubMed] [Google Scholar]
- Ochsner KN, Ray RD, Cooper JC, Robertson ER, Chopra S, Gabrieli JDE, Gross JJ. For better or for worse: neural systems supporting the cognitive down- and up-regulation of negative emotion. Neuroimage. 2004;23:483–499. doi: 10.1016/j.neuroimage.2004.06.030. [DOI] [PubMed] [Google Scholar]
- Ongür D, Price JL. The organization of networks within the orbital and medial prefrontal cortex of rats, monkeys and humans. Cereb Cortex. 2000;10:206–219. doi: 10.1093/cercor/10.3.206. [DOI] [PubMed] [Google Scholar]
- Penny WD, Stephan KE, Daunizeau J, Rosa MJ, Friston KJ, Thomas M, Leff AP. Comparing families of dynamic causal models. PLOS Comput Biol. 2010;6:e1000709. doi: 10.1371/journal.pcbi.1000709. doi:10.1371/journal.pcbi.1000709. [DOI] [PMC free article] [PubMed] [Google Scholar]
- Penny WD, Stephan KE, Mechelli A, Friston KJ. Comparing dynamic causal models. Neuroimage. 2004;22:1157–1172. doi: 10.1016/j.neuroimage.2004.03.026. [DOI] [PubMed] [Google Scholar]
- Phan KL, Fitzgerald DA, Nathan PJ, Tancer ME. Association between amygdala hyperactivity to harsh faces and severity of social anxiety in generalized social phobia. Biol Psychiatry. 2006;59:424–429. doi: 10.1016/j.biopsych.2005.08.012. [DOI] [PubMed] [Google Scholar]
- Phan KL, Orlichenko A, Boyd E, Angstadt M, Coccaro EF, Liberzon I, Arfanakis K. Preliminary evidence of white matter abnormality in the uncinate fasciculus in generalized social anxiety disorder. Biol Psychiatry. 2009;66:691–694. doi: 10.1016/j.biopsych.2009.02.028. [DOI] [PMC free article] [PubMed] [Google Scholar]
- Phan KL, Wager T, Taylor SF, Liberzon I. Functional neuroanatomy of emotion: a meta-analysis of emotion activation studies in PET and fMRI. Neuroimage. 2002;16:331–348. doi: 10.1006/nimg.2002.1087. [DOI] [PubMed] [Google Scholar]
- Phelps EA, Delgado MR, Nearing KI, LeDoux JE. Extinction learning in humans: role of the amygdala and vmPFC. Neuron. 2004;43:897–905. doi: 10.1016/j.neuron.2004.08.042. [DOI] [PubMed] [Google Scholar]
- Phillips ML, Ladouceur CD, Drevets WC. A neural model of voluntary and automatic emotion regulation: implications for understanding the pathophysiology and neurodevelopment of bipolar disorder. Mol Psychiatry. 2008;13:829–833. doi: 10.1038/mp.2008.65. 57. [DOI] [PMC free article] [PubMed] [Google Scholar]
- Pollak DD, Rogan MT, Egner T, Perez DL, Yanagihara TK, Hirsch J. A translational bridge between mouse and human models of learned safety. Ann Med. 2010;42:115–122. doi: 10.3109/07853890903583666. [DOI] [PubMed] [Google Scholar]
- Price RB, Eldreth DA, Mohlman J. Deficient prefrontal attentional control in late-life generalized anxiety disorder: an fMRI investigation. Transl Psychiatry. 2011;1:46. doi: 10.1038/tp.2011.46. [DOI] [PMC free article] [PubMed] [Google Scholar]
- Quirk GJ, Likhtik E, Pelletier JG, Pare D. Stimulation of medial prefrontal cortex decreases the responsiveness of central amygdala output neurons. J Neurosci. 2003;23:8800–8807. doi: 10.1523/JNEUROSCI.23-25-08800.2003. [DOI] [PMC free article] [PubMed] [Google Scholar]
- Ray RD, Zald DH. Anatomical insights into the interaction of emotion and cognition in the prefrontal cortex. Neurosci Biobehav Rev. 2012;36:479–501. doi: 10.1016/j.neubiorev.2011.08.005. [DOI] [PMC free article] [PubMed] [Google Scholar]
- Robinson JL, Monkul ES, Tordesillas-Gutierrez D, Franklin C, Bearden CE, Fox PT, Glahn DC. Fronto-limbic circuitry in euthymic bipolar disorder: evidence for prefrontal hyperactivation. J Psychiatr Res. 2008;164:106–113. doi: 10.1016/j.pscychresns.2007.12.004. [DOI] [PubMed] [Google Scholar]
- Robinson OJ, Charney DR, Overstreet C, Vytal K, Grillon C. The adaptive threat bias in anxiety: amygdala-dorsomedial prefrontal cortex coupling and aversive amplification. Neuroimage. 2012;60:523–9. doi: 10.1016/j.neuroimage.2011.11.096. [DOI] [PMC free article] [PubMed] [Google Scholar]
- Robinson S, Windischberger C, Rauscher A, Moser E. Optimized 3 T EPI of the amygdalae. Neuroimage. 2004;22:203–210. doi: 10.1016/j.neuroimage.2003.12.048. [DOI] [PubMed] [Google Scholar]
- Rule RR, Shimamura AP, Knight RT. Orbitofrontal cortex and dynamic filtering of emotional stimuli. Cogn Affect Behav Neurosci. 2002;2:264–270. doi: 10.3758/cabn.2.3.264. [DOI] [PubMed] [Google Scholar]
- Schneier FR, Rodebaugh TL, Blanco C, Lewin H, Liebowitz MR. Fear and avoidance of eye contact in social anxiety disorder. Compr Psychiatry. 2011;52:81–87. doi: 10.1016/j.comppsych.2010.04.006. [DOI] [PMC free article] [PubMed] [Google Scholar]
- Schuyler B, Ollinger JM, Oakes TR, Johnstone T, Davidson RJ. Dynamic causal modeling applied to fMRI data shows high reliability. Neuroimage. 2010;49:603–611. doi: 10.1016/j.neuroimage.2009.07.015. [DOI] [PMC free article] [PubMed] [Google Scholar]
- Seghier ML, Zeidman P, Neufeld NH, Leff AP, Price CJ. Identifying abnormal connectivity in patients using dynamic causal modeling of FMRI responses. Front Syst Neurosci. 2010;4:1–14. doi: 10.3389/fnsys.2010.00142. [DOI] [PMC free article] [PubMed] [Google Scholar]
- Sierra-Mercado D, Padilla-Coreano N, Quirk GJ. Dissociable roles of prelimbic and infralimbic cortices, ventral hippocampus, and basolateral amygdala in the expression and extinction of conditioned fear. Neuropsychopharmacology. 2011;36:529–538. doi: 10.1038/npp.2010.184. [DOI] [PMC free article] [PubMed] [Google Scholar]
- Sladky R, Friston KJ, Tröstl J, Cunnington R, Moser E, Windischberger C. Slice-timing effects and their correction in functional MRI. Neuroimage. 2011;58:588–594. doi: 10.1016/j.neuroimage.2011.06.078. [DOI] [PMC free article] [PubMed] [Google Scholar]
- Sladky R, Höflich A, Atanelov J, Kraus C, Baldinger P, Moser E, Lanzenberger R, Windischberger C. Increased neural habituation in the amygdala and orbitofrontal cortex in social anxiety disorder revealed by FMRI. PLOS One. 2012;7:e50050. doi: 10.1371/journal.pone.0050050. [DOI] [PMC free article] [PubMed] [Google Scholar]
- Stein JL, Wiedholz LM, Bassett DS, Weinberger DR, Zink CF, Mattay VS, Meyer-Lindenberg A. A validated network of effective amygdala connectivity. Neuroimage. 2007a;36:736–745. doi: 10.1016/j.neuroimage.2007.03.022. [DOI] [PubMed] [Google Scholar]
- Stein MB, Goldin PR, Sareen J, Zorrilla LTE, Brown GG. Increased amygdala activation to angry and contemptuous faces in generalized social phobia. Arch Gen Psychiatry. 2002;59:1027–1034. doi: 10.1001/archpsyc.59.11.1027. [DOI] [PubMed] [Google Scholar]
- Stein MB, Simmons AN, Feinstein JS, Paulus MP. Increased amygdala and insula activation during emotion processing in anxiety-prone subjects. Am J Psychiatry. 2007b;164:318–327. doi: 10.1176/ajp.2007.164.2.318. [DOI] [PubMed] [Google Scholar]
- Stephan KE, Penny WD, Moran RJ, den Ouden HEM, Daunizeau J, Friston KJ. Ten simple rules for dynamic causal modeling. Neuroimage. 2010;49:3099–3109. doi: 10.1016/j.neuroimage.2009.11.015. [DOI] [PMC free article] [PubMed] [Google Scholar]
- Tottenham N, Tanaka JW, Leon AC, McCarry T, Nurse M, Hare Ta, Marcus DJ, Westerlund A, Casey BJ, Nelson C. The NimStim set of facial expressions: judgments from untrained research participants. Psychiatry Res. 2009;168:242–249. doi: 10.1016/j.psychres.2008.05.006. [DOI] [PMC free article] [PubMed] [Google Scholar]
- Vidal-Gonzalez I, Vidal-Gonzalez B, Rauch SL, Quirk GJ. Microstimulation reveals opposing influences of prelimbic and infralimbic cortex on the expression of conditioned fear. Learn Mem. 2006;13:728–733. doi: 10.1101/lm.306106. [DOI] [PMC free article] [PubMed] [Google Scholar]
- Wager TD, Phan KL, Liberzon I, Taylor SF. Valence, gender, and lateralization of functional brain anatomy in emotion: a meta-analysis of findings from neuroimaging. Neuroimage. 2003;19:513–531. doi: 10.1016/s1053-8119(03)00078-8. [DOI] [PubMed] [Google Scholar]
- Wittchen HU, Jacobi F, Rehm J, Gustavsson A, Svensson M, Jonsson B, Olesen J, Allgulander C, Alonso J, Faravelli C, et al. The size and burden of mental disorders and other disorders of the brain in europe 2010. Eur Neuropsychopharmacol. 2011;21:655–679. doi: 10.1016/j.euroneuro.2011.07.018. [DOI] [PubMed] [Google Scholar]
Associated Data
This section collects any data citations, data availability statements, or supplementary materials included in this article.