

Abstract
What neural mechanisms underlie the ability to attend to a complex object in the presence of competing overlapping stimuli? We evaluated whether object-based attention might involve pattern-specific feedback to early visual areas to selectively enhance the set of low-level features corresponding to the attended object. Using fMRI and multivariate pattern analysis, we found that activity patterns in early visual areas (V1–V4) are strongly biased in favor of the attended object. Activity patterns evoked by single faces and single houses reliably predicted which of the 2 overlapping stimulus types was being attended with high accuracy (80–90% correct). Superior knowledge of upright objects led to improved attentional selection in early areas. Across individual blocks, the strength of the attentional bias signal in early visual areas was highly predictive of the modulations found in high-level object areas, implying that pattern-specific attentional filtering at early sites can determine the quality of object-specific signals that reach higher level visual areas. Through computational modeling, we show how feedback of an average template to V1-like units can improve discrimination of exemplars belonging to the attended category. Our findings provide a mechanistic account of how feedback to early visual areas can contribute to the attentional selection of complex objects.
Keywords: fMRI, fusiform face area, human visual cortex, multivariate pattern analysis, parahippocampal place area, visual attention
Introduction
According to prominent theories of object-based attention, the attentional system is predisposed to select entire visual objects during top-down enhancement (Duncan 1984; Kahneman et al. 1992; Baylis and Driver 1993; Blaser et al. 2000; Driver et al. 2001; Scholl 2001). The ability to enhance the visual representation of entire objects, even in the presence of spatially overlapping distractors, may be particularly useful for distinguishing objects in cluttered real-world scenes (Peelen et al. 2009; Cohen et al. 2011). For example, consider a predator attempting to identify its prey hiding in a thicket of ferns. In such situations, object-based attention could be used to selectively enhance the relevant portions of the image belonging to the partially hidden animal, and to suppress information from competing objects, such as the leafy branches that lie before or around the attended object.
Most neural investigations of object-based attention have relied on simple stimuli, such as intersecting lines, simple shapes, or overlapping sets of moving dots, which can be readily segmented and perceptually organized based on their spatiotemporal continuity. These studies suggest that top-down feedback to early visual areas is important for the attentional selection of simple objects or perceptual groups (Roelfsema et al. 1998; Valdes-Sosa et al. 1998; Blaser et al. 2000; Muller and Kleinschmidt 2003; Schoenfeld et al. 2003; Fallah et al. 2007; Ciaramitaro et al. 2011; Hou and Liu 2012).
However, real-world stimuli such as people, vehicles, or buildings are far more complex in their featural and spatial characteristics. Correspondingly, a more sophisticated mechanism appears necessary to explain how top-down attention can enhance the representation of a complex object when it appears in the presence of a competing overlapping distractor. In this case, object-based selection would need to be informed by high-level knowledge regarding the detailed visual structure of the attended object; otherwise, there would be little basis for distinguishing the features of one object from those of another under conditions of spatial overlap (see Fig. 1a). Only a few studies have investigated this more challenging form of object-based attentional selection, focusing on the modulatory effects of attention in high-level object areas and the activation of frontoparietal control networks during this top-down selection process (O'Craven et al. 1999; Serences et al. 2004; Furey et al. 2006). However, recent work by Al-Aidroos et al. (2012) has provided evidence to suggest that feedback to early visual areas may also contribute to the attentional selection of complex objects. They found that the functional connectivity between category-selective object areas and early visual areas was reliably modulated, depending on whether participants were attending to faces or scenes presented under conditions of spatial overlap. These findings suggest a possible role for early visual areas in the attentional selection of complex objects; however, it is unclear what types of visual signals might be enhanced in these early areas to mediate this selection process.
Figure 1.
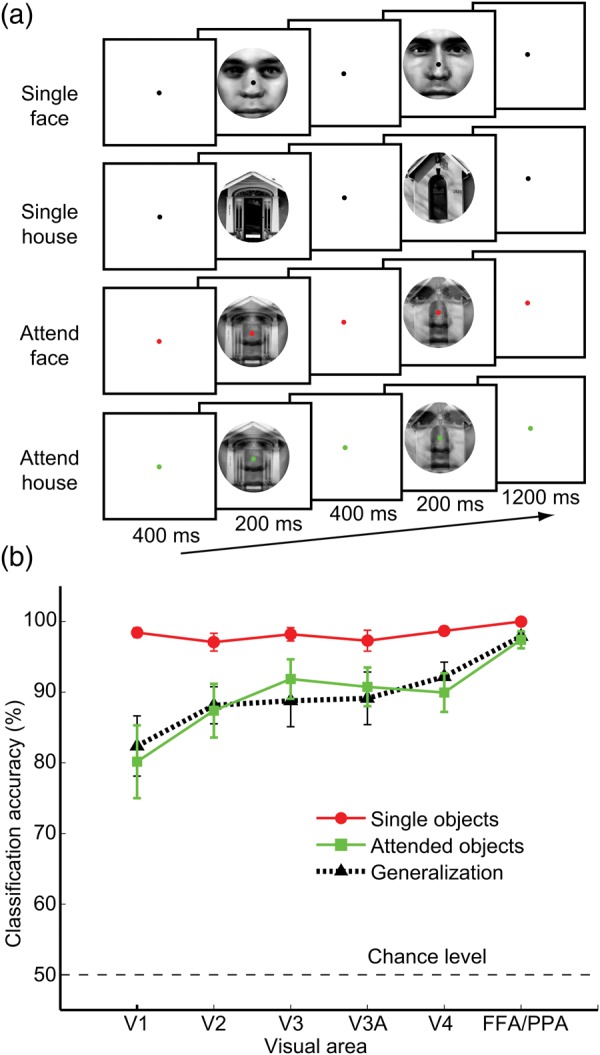
Experimental design and results of fMRI decoding. (a) Examples of trial sequences for the 4 experimental conditions: single faces, single houses, attended faces, and attended houses. Color of fixation point indicated the target object category in “attended” blocks. (Here, red indicates attend face and green indicates attend house; note that color assignment rule was switched halfway through the experiment.) Observers performed a same–different matching task for sequential stimuli within the target (face or house) class. Sequential pairs of objects in each class matched on 50% of trials. (b) Object decoding performance for areas V1 through V4 and pooled FFA/PPA. Mean accuracy of object decoding for single faces versus houses (red circles), attended faces versus houses (green squares), and generalization performance across conditions (black triangles). Linear support vector machines were used to classify multivoxel patterns of activity with mean amplitude removed, using the 125 most visually responsive voxels in each area. Error bars indicate ± 1 SEM. Decoding for FFA alone was 98 ± 1% for single objects, 95 ± 2% for attended, and 92 ± 3% for generalization. For PPA, decoding was 99 ± 0.3% for single objects, 95 ± 2% for attended, and 95 ± 2% for generalization.
The goal of our study was to determine whether object-based attention might rely on pattern-specific feedback to early visual areas to selectively enhance the set of low-level features corresponding to the attended object. Although early visual areas are primarily tuned to local features and insensitive to complex object properties, we hypothesized that attending to 1 of 2 overlapping objects may depend on selectively enhancing the visual representations of the local features corresponding to the attended object. This hypothesis leads to the following predictions. First, when covert attention is directed toward 1 of 2 overlapping objects, activity patterns in early visual areas should be biased toward the pattern that would result if the attended stimulus were presented in isolation. Such a prediction can be viewed as an extension of the biased competition model (Desimone and Duncan 1995). Second, if feedback to early visual areas contributes to the attentional selection of object-relevant signals, then the strength of this pattern-specific attentional bias signal in early visual areas should be predictive of the strength of attentional modulation found in high-level object areas. Such functional coupling would imply that early-stage attentional filtering can determine the quality of object-selective information that ultimately reaches higher level visual areas. Finally, we predicted that attentional modulation in early visual areas should be reliant upon high-level object knowledge, such that relevant features can be attentionally selected more effectively when objects are presented in a familiar way.
We used functional magnetic resonance imaging (fMRI) and multivariate pattern analysis (Tong and Pratte 2012) to investigate the functional role of early visual areas in object-based attention. Across multiple experiments, we evaluated whether activity patterns in early visual areas were reliably biased in favor of the attended object category when participants viewed overlapping face–house images (Fig. 1a). We devised a novel correlational analysis to test for functional coupling between selective attentional bias signals in low-level visual areas and high-level object-selective areas. In Experiment 2, we evaluated whether attending to face or house in overlapping face–house blends involves biased patterns of activity in early visual areas that resemble those evoked under stimulus-driven conditions by unattended faces or houses. In Experiment 3, we investigated the spatial specificity of these attentional bias effects in early visual areas by manipulating the location of attended objects. In Experiment 4, we investigated the potential contributions of high-level knowledge to object-based attention, by testing whether the presentation of objects in a familiar orientation leads to more efficient attentional selection in early visual areas.
To complement this experimental work, we developed a computational model to gain insight into how high-level feedback to early visual areas might benefit performance at this object-based attention task. We show that feedback of an “average” object template (i.e., average face or house) to V1 complex units can provide a sufficiently specific yet flexible attentional template for improving the visual discrimination between multiple exemplars from the attended category. Taken together, our findings provide a mechanistic account of how feedback to early visual areas can contribute to the attentional selection of complex objects.
Materials and Methods
Participants
A total of 10 healthy observers, aged 23–32, participated in one or more of the following experiments, with 6 observers in Experiment 1 (observers 1, 2, 3, 4, 5, 6), 5 observers in Experiment 2 (1, 2, 4, 5, 7), 5 observers in Experiment 3 (1, 3, 7, 8, 9), and 5 observers in Experiment 4 (1, 2, 3, 7, 10). Each experiment took place in a separate MRI scanning session. The study was approved by the Vanderbilt University Institutional Review Board, and all participants provided informed written consent.
Stimuli
Visual stimuli were generated by a Macbook Pro computer running Matlab, and displayed on a rear-projection screen using an Eiki LC-X60 LCD projector with a Navitar zoom lens. The stimuli were comprised 33 faces and 33 houses, centrally presented in an 8.3°-diameter window on a white background. Images of Caucasian male faces were obtained from a database provided by the Max Planck Institute for Biological Cybernetics in Tübingen, Germany (Troje and Bulthoff 1996), and adapted for this study. House stimuli were adapted from original photographs taken by the authors. All images were cropped and resized to control for the position of the objects within the circular presentation window. House images were centered and resized so that each contained a central door of fixed size. This manipulation regularized each image so that it contained a roughly equal portion of each house's porch. Face images were cropped to contain the internal features of the face and centered with the fixation point lying on the nose region. Luminance values for all images (faces and houses) were first equated for mean and standard deviation. Finally, the relative contrast between stimulus types was adjusted to equate difficulty in the behavioral task. Behavioral piloting revealed faces presented at 62% contrast and houses at 38% allowed performance at near ceiling levels in both tasks.
Face–house blends were constructed by combining individual faces and houses, and calculating the luminance-based average of each face–house pair. During the experiment, a color cue (red/green) at fixation indicated whether the participant should attend to face or house when presented with blended stimuli. The correspondence between fixation color and the attended category was reversed halfway through the experiment for each participant, to ensure that the color cue was not predictive of the attended object category.
Design for Experiment 1
In the main experiment, there were 4 experimental conditions that required observers to report whether sequential pairs of task-relevant objects were same or different on each 2-s trial (Fig. 1a). Experimental conditions occurred in 16-s blocks (8 trials per block), in a randomized order with 12 blocks in each run. Observers were instructed to maintain fixation on a central dot (12-min arc diameter) throughout each experimental run, and eye position was monitored with an Applied Science Laboratories EYE-TRAC 6 MRI-compatible eye-tracking system. Participants completed 16 experimental runs to obtain 48 blocks for each condition. Two additional runs served as functional localizers, during which subjects viewed 16-s blocks of faces or houses (presentation rate, 2.5 items/s) while performing a 1-back matching task.
Experiment 2
The purpose of this experiment was to evaluate the similarity of activity patterns evoked by attended and unattended stimuli. Participants performed 11–12 experimental runs involving unattended single objects, 11–12 runs involving attention directed to face–house blends, and 2 visual localizer runs. Stimuli were identical to those used in Experiment 1, with the exception that a larger fixation bull's eye of 1° visual angle was used so that legible letters could be presented within the fixation dot for the rapid serial visual presentation (RSVP) task.
For “attended object” runs, subjects attended to faces or houses within the face–house blends and performed the visual discrimination task, while ignoring the stream of RSVP letters presented within the fixation dot. For “unattended object” runs, single faces or single houses were displayed during each stimulus block while observers had to attend to letters at central fixation and to press one of 2 keys indicating whenever the target letters “J” or “K” appeared. Nontarget letters consisted of the remaining 24 letters. Letters were presented at a rate of 6–8 items/s, with targets appearing at random times within the sequence, on average once every 2 s. Subjects were required to perform the letter detection/identification task at an accuracy level of 60% or higher, otherwise the rate would be slowed from 8 to 6 items/s.
Experiment 3
The purpose of this experiment was to examine the position specificity of the attentional bias effects in early visual areas. Each observer participated in 16 experimental runs (8 runs for each of 2 stimulus locations) and 2 functional localizer runs. Stimuli were presented either above and to the left of fixation, or below and to the right of fixation, centered at 4.3° horizontal eccentricity and 2.8° vertical eccentricity. Stimulus size remained the same as in previous experiments. Only face–house blends were presented, and observers were centrally cued to attend to faces or houses at the beginning of each 16-s stimulus block.
Experiment 4
In this experiment, face–house blends were presented upright or upside-down to evaluate the influence of high-level object knowledge on the efficacy of attentional selection in early visual areas. Participants performed a total of 16 experimental runs and 2 visual localizer runs. This experiment relied on an event-related design, with each run consisting of 24 test trials and 6 blank trials that occurred in a randomized order. Each test trial lasted 6 s (see Fig. 7a), beginning with a central color cue (2 s) indicating whether to attend to face, followed by the brief presentation of the first face–house blend (133 ms) and a visual mask (67 ms), an interstimulus interval (400 ms), and the second face–house blend (133 ms) and visual mask (67 ms). Participants had to report within the response period (3.2 s) whether same or different items were presented within the attended object category. Multiple visual mask images were created by blending 2 Fourier phase-scrambled images (1 face, 1 house) drawn from the original set of stimuli. Face–house blends were randomized for orientation, appearing either upright or inverted with equal likelihood. Thus, there were 4 trial types: attend face/upright, attend house/upright, attend face/inverted, attend house/inverted, and each trial type occurred 6 times per run in a randomly generated order.
Figure 7.

Experimental design and fMRI results for face–house blends presented upright or inverted. (a) Examples of trial sequences in Experiment 4; pairs of upright or inverted face–house blends were briefly displayed for a same–different judgment task. Color of fixation point indicated whether to attend to faces or houses; orientation of stimuli was randomized and could not be anticipated. (b) Accuracy of decoding attention to faces or houses, plotted separately for upright objects (squares) and inverted objects (diamonds) for each visual area. Error bars indicate ± 1 SEM. The rapid event-related trial design led to lower overall levels of classification performance. Nonetheless, we found a general advantage for upright stimuli. Upright stimuli could be classified reliably in every visual area tested (P < 0.05), but for inverted stimuli only, the FFA/PPA performed at above-chance levels. Analysis of variance revealed a main effect between upright and inverted classification (F1,4 = 12.99, P < 0.05), with specific comparisons revealing better decoding for upright stimuli in area V1 (P < 0.05) and marginal effects in V2 and V4 (P < 0.10).
MRI Acquisition
Scanning was performed on a 3.0-Tesla Philips Intera Achieva MRI scanner using an 8-channel head coil at the Vanderbilt University Institute of Imaging Science. A high-resolution 3D anatomical T1-weighted scan was acquired from each participant (FOV 256 × 256, 1 × 1 × 1 mm resolution, TR 7.992 ms, TE 3.69 ms, flip angle 7°). To measure BOLD contrast, standard gradient-echo echo planar T2*-weighted imaging was used to collect 28 slices perpendicular to the calcarine sulcus, which covered the entire occipital lobe as well as the posterior parietal and temporal cortex (TR 2000 ms; TE 35 ms; flip angle 80°; FOV 192 × 192; slice thickness, 3 mm with no gap; in-plane resolution, 3 × 3 mm). Participants used a custom-made bite bar system to stabilize head position, which minimized total head displacement across the session to <1.2 mm on average.
Functional MRI Data Preprocessing
All fMRI data underwent 3D motion correction using FSL software. This was followed by slice scan-time correction to correct for the different times of slice acquisition, and linear trend removal to eliminate slow drifts in signal intensity, performed using Brain Voyager software (Brain Innovation). No spatial or temporal smoothing was directly applied to the data. The fMRI data were aligned to retinotopic mapping data collected from a separate session. All automated alignment was subjected to careful visual inspection and manual fine-tuning to correct for potential residual misalignment. Rigid-body transformations were performed to align fMRI data to the within-session 3D anatomical scan, and then to the 3D anatomical data collected from the retinotopy session. After across-session alignment, fMRI data underwent Talairach transformation and reinterpolation using 3 × 3 × 3 mm voxels. This procedure allowed us to delineate individual visual areas on flattened cortical representations and to restrict the selection of voxels around the gray–white matter boundary.
Regions of Interest
Functionally defined regions of interest consisted of visual areas V1, V2, V3, V3A, V4, FFA, and PPA. A separate experimental session was used to collect data for retinotopic mapping, following established methods (Sereno et al. 1995; Engel et al. 1997). While maintaining fixation, subjects viewed “traveling wave” stimuli consisting of rotating wedges and expanding rings, which were used to construct phase-encoded retinotopic maps of polar angle and eccentricity, respectively. Boundaries between retinotopic visual areas V1 through V4 were delineated on flattened cortical representations based on reversals in polar-angle phase encoding, and informed by inspection of the eccentricity maps as well. Foveal representations of V1, V2, and V3 were delineated by extending the boundaries between these areas, in the dorsal and ventral portions, through the foveal confluence (Schira et al. 2009). The fusiform face area (FFA) was localized by identifying the set of contiguous voxels in the fusiform gyrus that responded significantly more to faces than houses on the functional localizer runs (Kanwisher et al. 1997), using a minimum statistical threshold of P < 0.001. The parahippocampal place area (PPA) was identified as the set of contiguous voxels in the region of the parahippocampal cortex that responded significantly more to houses than faces using a similar threshold (Epstein and Kanwisher 1998). Additional analyses were performed on visually responsive regions in the posterior parietal cortex. This region was localized by selecting all contiguous voxels in the posterior parietal cortex that were reliably activated during the functional localizer runs, focusing on regions clearly anterior to the occipital-parietal fissure. This typically encompassed portions of the intraparietal sulcus and the superior parietal lobe (see Fig. 4).
Figure 4.

Regions with attentional bias signals correlated with bias in V1–V4. Searchlight analyses were conducted to detect block-by-block variations in local activity patterns that predicted the strength and categorical direction of attentional bias in early visual areas. Pattern classification was applied to local 3× 3 × 3 voxel regions, and this local searchlight analysis was performed repeatedly throughout the entire scanned cortex (occipital, posterior parietal, and temporal regions). For each iteration of the searchlight, within-category (face or house) bias was correlated (R) with bias in V1–V4 (cf. Fig. 2). Correlation maps for attend face and attend house were averaged for each subject, and aligned in Talairach space for group analysis. Group-based statistical maps were calculated by performing a t-test on all Fisher's z-corrected voxels, using false discovery rate to correct for multiple comparisons (Genovese et al. 2002). The color-coded statistical map above shows the mean correlation strength (blue to green, R = 0.06–0.60, P < 0.025 corrected) with attentional bias signals in V1–V4 (shaded region) plotted on the flattened cortex of a representative subject, with functionally defined visual areas delineated for that subject.
Voxels used for decoding analysis were selected bilaterally from the cortical surface for each defined visual area. First, voxels near the gray–white matter boundary were identified within each visual area using retinotopic or functional maps delineated on a flattened cortical surface representation. Next, voxels were sorted according to the reliability of their responses (based on a t-statistic) to 2 separate localizer runs in which single faces or houses were displayed in separate blocks at a rate of 2.5 items/s. These stimuli appeared at the same size and location as those in the specified experiment. To facilitate comparison of decoding performance across visual areas, we aimed to select an equal number of voxels from each area while ensuring that these selected voxels were highly responsive to the visual localizer stimulus. We used the 125 most active voxels from each of areas V1 through V4 and also from the FFA and PPA regions combined. Note that the size of the visual areas varied across individuals and, in some cases, fewer than 125 voxels were available in areas V3A and V4.
Owing to peripheral presentation of stimuli in Experiment 3, the activated region in the retinotopic visual cortex was comparatively smaller in this study. We defined 2 separate regions of interest for each visual area, corresponding to the 2 retinotopic locations of the stimuli, and selected all voxels that responded to either location during the functional localizer runs, based a statistical threshold of T > 2.58, P < 0.01 2-tailed. For each visual area, we combined these activated regions in the 2 hemispheres into a single region of interest, prior to performing our classification analysis.
Amplitude Estimation
A general linear model (GLM) was used to estimate the response amplitudes for each stimulus block in an fMRI run. GLM predictors were determined by convolving the boxcar stimulus time course with a standard gamma function to account for the BOLD hemodynamic response. Amplitudes for each block were estimated by applying the GLM to the z-transformed time series of each voxel. For decoding analysis, an fMRI data sample consisted of the spatial pattern of amplitudes for all selected voxels within a given region of interest and the experimental condition or “label” associated with that particular stimulus block. To minimize the potential contribution of gross amplitude changes, we subtracted the mean amplitude from the spatial pattern of activity in each region of interest, for each fMRI data sample.
In Experiment 4, a GLM was used to estimate the response amplitude for each stimulus trial. To provide more stability for classification analysis, we created fMRI samples based on the mean responses from 3 trials of the same condition within a run; otherwise, the decoding analysis was performed in the same manner.
Decoding Analysis
We used support vector machines to obtain linear discriminant functions to distinguish between activity patterns corresponding to face and house. To evaluate decoding performance, we used an iterative leave-one-run-out procedure for cross-validation, so that independent fMRI samples were used for training and testing each classifier. Classification accuracy provided a measure of the amount of discriminating information that was available in the patterns of activity for a region of interest. Classification accuracy was assessed separately for single faces/houses and for attended faces/houses. Generalization performance was assessed by training a classifier in one experimental condition and testing it on the other (e.g., train single face–house and test attend face–house), with performance averaged across both directions of generalization.
We conducted additional analyses to confirm that our classification analysis was not biased, by conducting permutation tests on fMRI samples, using randomized labels with 1000 iterations per participant. The results closely approximated a binomial distribution with 0.5 probability, as was evaluated by a Kolmogorov–Smirnov statistical test. We also evaluated whether the application of a t-test to binomial classification results would inflate the likelihood of Type I errors. For our randomized label data with 1000 iterations per subject, we observed a false-positive rate of 0.058 at the 1-tailed t-value cutoff for P < 0.05, and a false-positive rate of 0.031 at the 1-tailed t-value cutoff for P < 0.025, indicating minimal inflation of false-positive estimates. Thus, the statistical approach taken here was robust and rigorous.
Analysis of Correlations Between Attentional Bias Signals in Low- and High-Level Visual Areas
We measured the strength of the attentional bias signal on individual stimulus blocks for low-level areas (V1–V4 pooled) and high-level areas (FFA/PPA pooled). Because of the large cortical size of areas V1–V4 combined, we used the 400 most visually active voxels in this region for pattern analysis. First, we trained a classifier on fMRI samples for single faces and houses, and then used this classifier to determine the distance between the decision boundary and each fMRI sample obtained in the attention (face–house blend) condition. The bias effect of attention for each stimulus block was determined based on the Euclidean distance of the fMRI sample from the classifier decision boundary in normalized units (positive values, face bias; negative values, house bias, see Fig. 2). We evaluated whether this measure of attentional bias strength was reliably correlated between low-level areas (V1–V4 pooled) and high-level areas (FFA and PPA pooled) across individual stimulus blocks. We also performed this same correlational analysis on visually active regions in the posterior parietal cortex, to determine whether object-selective attentional bias signals in this region might be also be correlated with the bias signals observed in early visual areas. Finally, we measured the correlations between the attentional bias signals in the FFA/PPA region and those in individual early visual areas, using 125 voxels for each region (see Fig. 3).
Figure 2.

Relationship between the attentional bias signal in low-level and high-level visual areas for each of 6 observers. Scatter plots show the degree of attentional bias in favor of “face” or “house” for individual stimulus blocks while subjects attended to faces (red circles) or houses (blue diamonds). Bias strength for each stimulus block reflects the Euclidean distance of this fMRI sample from the classifier decision boundary in normalized units (positive values, face bias; negative values, house bias). Plots show bias strength for 400 voxels from V1 to V4 pooled (abscissa) and for the pooled FFA/PPA region (ordinate). Correlations between low-level and high-level areas were calculated separately for attend face blocks (red ellipse) and attend house blocks (blue ellipse), to reveal functional relationships between brain areas when observers performed a common attentional task. Correlations for data combined across the 2 attentional tasks are also shown (black ellipse). Ellipses depict variance along the first and second principal components to 2 standard deviations. All data points depict generalization performance; the classifier was trained with fMRI activity for single faces and houses, and then tested with attended faces and houses.
Figure 3.

Relationship between the attentional bias signal in individual low-level and high-level visual areas. Mean correlations across subjects between the attentional bias strength in the FFA/PPA and those in individual retinotopic areas (V1, V2, V3, V3A, and V4). Correlations for attended faces (squares), and attended houses (circles) remain strong across visual areas. The correlation for combined data (triangles) reflects both within-condition correlations as well as the overall classification accuracy in the respective brain areas.
Gabor Wavelet Pyramid Model
We used a Gabor wavelet pyramid (Lee 1996) to simulate the responses of arrays of V1 simple cells as well as complex cells, to evaluate the visual similarity of the exemplars within each object category. Some degree of shared visual similarity would allow for robust generalization between the early visual activity patterns evoked by a set of single faces viewed in one stimulus block and a separate set of faces viewed in another stimulus block. The pyramid consisted of Gabor wavelets at 4 levels of size/spatial frequency (3 cycles per receptive field), 8 orientations, and 2 phases, which were tiled evenly across the image. Simple-cell responses were half-wave rectified; complex-cell responses were derived from pairs of simple cells (same orientation, 90° phase difference) by squaring and then summing their individual responses. By applying this V1 model to our stimulus set of 33 faces and 33 houses, we could calculate the pattern of feedforward responses to single stimuli and determine the pairwise correlations between responses for all possible stimulus pairs within each stimulus class.
For simulated simple cells, the mean pairwise correlation was 0.39 and 0.19 for the stimulus set of faces and houses, respectively. For simulated complex cells, the mean pairwise correlation was 0.63 and 0.39 for faces and houses, respectively.
Computational Modeling of an Attentional Template
We further used the Gabor model to determine whether attentional feedback of an average face (or house) template might improve the ability to classify V1 activity patterns according to the individual exemplar that appeared within face–house blends. The attentional feedback was implemented by a multiplicative gain mechanism, in which an average face or house template was multiplied with the pattern of feedforward responses to a face–house blend and scaled by a gain factor of 20%, before determining the combined pattern of feedforward and feedback responses.
For each simulated trial, the face and house stimuli were randomly assigned to separate subsets, which we used to calculate the average V1 responses to 11 faces or 11 houses (attentional template), to train a simple linear classifier on 10 different face–house blends (training set), and to test the classifier at discriminating an “old” face or house, randomly selected from the training set, but now presented with a new distractor from the other category. The classifier was based on a 1-nearest-neighbor measure of correlation to evaluate the similarity of responses to the training and test stimuli. We adopted a 10-alternative forced choice procedure to enhance the difficulty of discrimination and to better evaluate the potential benefits of attentional feedback. Varying levels of independent Gaussian noise was added to each V1 unit's response to simulate internal noise in the visual system and to evaluate the robustness of any observed effects. The mean noise amplitude was systematically increased from 0 to 20 times that of the mean response across all V1 units. We measured the effects of attentional feedback applied to simple cells, complex cells, both cell types, or neither, by classifying activity patterns across the entire simulated V1 population. The attentional template always matched the category of the target to be identified, and was applied during both training and test. Each data point in Figure 8 was generated by calculating the overall percentage of correct discriminations using each of the 33 faces (or houses) as target, and repeating this procedure 100 times for each object category and noise level.
Figure 8.
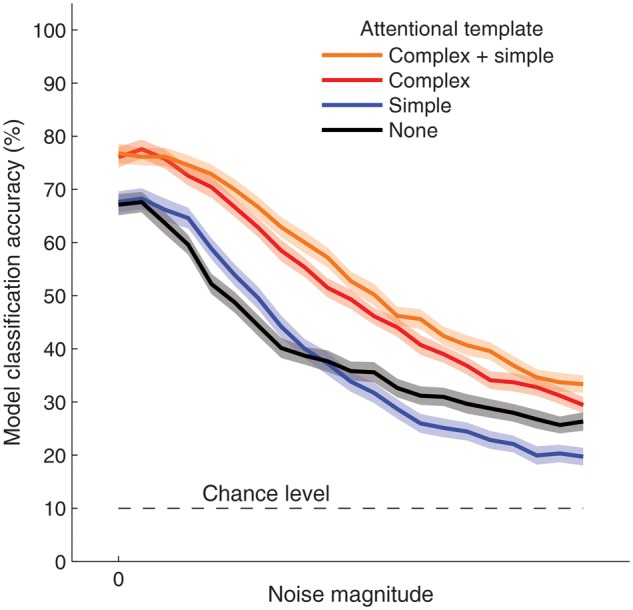
Accuracy of model performance with object-based attentional feedback to V1 simple or complex units. Model accuracy at classifying the identity of the attended object in face–house blends, using 10-alternative forced choice discrimination of simulated V1 responses. In comparison to no feedback (black curve), attentional feedback of an average face or house template to complex-cell units (red curve) led to better discrimination of individual exemplars from the attended category, across varying levels of independent Gaussian noise. By contrast, feedback to simple cell units failed to improve performance consistently (blue curve). Shaded regions indicate 95% confidence intervals, based on 200 simulations of 33 trials per noise level.
Results
Behavioral Results
In the main experiment, participants performed very well at the same–different judgment task for all experimental conditions (mean ± SD accuracy: face only, 97 ± 1% correct; house only, 98 ± 1% correct; attend face, 94 ± 3% correct, attend house, 95 ± 1% correct). Although discrimination performance was impaired by the presence of an overlapping spatial distractor (F1,5 = 40.5, P < 0.01), participants discriminated changes in the attended object category with high accuracy, suggesting that they could attend selectively to task-relevant objects.
In Experiment 2, participants were presented with face–house stimuli while a series of letters appeared within the central fixation point at a rapid rate (6–8 items/s). Participants had to discriminate either the object stimuli or the letters in separate runs. Behavioral discrimination of the attended objects was somewhat poorer than in Experiment 1, presumably because of the flashing central letters (attend face 79 ± 6%, attend house 85 ± 4% for same–different judgment task). Performance at the letter detection/identification task led to a mean accuracy of 70 ± 21%, which was far from ceiling, implying that the task was attentionally demanding.
In Experiment 3, the behavioral task was also made more challenging due to the peripheral presentation of the face–house blends (mean ± SD accuracy: face upper left 72 ± 7%, house upper left 79 ± 4%, face lower right 76 ± 5%, house lower right 86 ± 8%). No statistically reliable differences were observed between locations or object types.
In Experiment 4, participants performed the same–different discrimination task on face–house blends that appeared either upright or inverted. Behavioral performance revealed a reliable face-inversion effect (mean ± SD accuracy: upright faces 83 ± 5%, inverted faces 72 ± 5%, upright houses 89 ± 4%, inverted houses 88 ± 3%), as was indicated by a statistical main effect of stimulus inversion (F1,4 = 23.8, P < 0.05), object type (F1,4 = 17.5, P < 0.05), as well as an interaction between inversion and object type (F1,4 = 10.6, P < 0.05).
fMRI Results for Experiment 1
Multivoxel pattern analysis was performed to examine the hypothesis that attention directed to 1 of 2 overlapping objects should bias the pattern of cortical activation to more closely resemble the pattern that would be evoked if the attended object were viewed in isolation. Such bias effects would support the predictions of the biased competition model of attention (Desimone and Duncan 1995), but under novel conditions in which the competing stimuli occupy a common spatial location.
First, we evaluated whether single faces and single houses led to distinct patterns of activity throughout the visual hierarchy. Classification was performed on fMRI activity patterns evoked by the 2 object types in individual visual areas. As expected, activity patterns in early retinotopic visual areas led to near-perfect decoding (93–100% correct classification, chance level 50%) of the stimulus category being viewed for each of areas V1 through V4 (Fig. 1b, red curve). These results indicate that the local feature content in our face stimuli and house stimuli led to highly distinguishable patterns of activity in the early visual areas, as was predicted by our results obtained from simulated visual responses using a Gabor wavelet model (see Materials and Methods).
We applied the same analysis to object-selective areas that respond preferentially to faces and houses, focusing on the FFA and PPA, respectively. Activity patterns from the FFA and PPA were combined to obtain a compound face–house discriminating signal from these category-selective object areas. The pooled information from these areas accurately predicted whether faces or houses were being viewed. Given the category selectivity of these higher level visual areas, the accurate decoding exhibited by these regions can be attributed to sensitivity to higher order object properties.
To test for bias effects of attention, we evaluated whether a linear classifier could decode when subjects were attending to faces or houses while viewing the face–house blends. Because the same stimuli were presented in both conditions, reliable decoding of the attended object category would indicate top-down biasing of cortical activity. Activity in the FFA and PPA was strongly modulated by the attentional task, as was expected (O'Craven et al. 1999; Serences et al. 2004), allowing for highly accurate decoding of the attended object category. Of particular interest, we found that activity patterns in early visual areas also led to highly reliable decoding of the attended object category (Fig. 1b, green curve). Reliable bias effects were found in individual areas for each of the 6 subjects tested (classification exceeded 75% accuracy for 35 of 36 individual classification tests, P < 0.001, 2-tailed binomial test). Information about the attended object predominated in the detailed activity patterns; classification accuracy was poor when applied to the mean fMRI amplitude in early visual areas, and substantially better when applied to the multivariate pattern of activity (with mean amplitude removed). We also performed a generalization analysis to evaluate whether these bias effects of attention resembled the patterns of activity evoked by single objects. Analyses indicated that classifiers trained on independent faces and houses could effectively predict the attended object category when subjects viewed face–house blends, and vice versa (Fig. 1b, black curve). Generalization performance was comparable to that of training and testing with the attention condition alone. Thus, by attending to 1 of 2 overlapping objects, the activity pattern resulting from the 2 simultaneously viewed objects was strongly biased in the direction of the activity pattern that would be observed if the attended item were viewed alone. These findings support the notion that object-based attention involves biased competition, operating at early sites of the visual pathway.
Functional Associations Between Visual Areas
The purpose of this analysis was to determine whether the strength of the pattern-specific attentional bias found in early visual areas might be correlated with the attentional biasing of activity found in high-level object areas. For each visual area, we calculated the hyperplane that distinguished between the activity patterns evoked by single faces and single houses, and then for each block involving face–house blends, we determined the absolute distance and the direction (faces, positive; houses, negative) in which the cortical activity pattern was biased away from this hyperplane during the performance of the selective attentional task. Next, we performed an analysis to determine whether the attentional signals we observed in early visual areas were correlated with the bias signals found in high-level object-selective areas, based on activity patterns pooled across areas V1 through V4. A positive result would imply a functional relationship between these areas during object-based attentional selection.
The results indicated that the bias signal found in high-level object areas was highly correlated with the strength and categorical direction of attentional bias found in early visual areas V1–V4 (Fig. 2). Critically, reliable correlations between attentional signals across brain areas could be seen within each attention condition for each of the 6 participants, that is when subjects carried out a common task of attending to faces (red ellipses) or houses (blue ellipses). Thus, when subjects attend repeatedly to a particular object category, one can nonetheless observe large block-by-block variations in the efficacy of object-based attentional selection in high-level areas, and these modulations are strongly predicted by the degree of attentional selection found in early visual areas. This functional relationship was also observed when we performed the same correlational analysis between individual early visual areas and the FFA/PPA region of interest (Fig. 3).
Searchlight Analysis of Correlated Modulations with Attentional Bias Signal in V1–V4
We performed a multivariate searchlight analysis (Kriegeskorte et al. 2006) to explore whether any other brain areas showed pattern-specific modulations that correlated with the strength and direction of attentional modulations in early visual areas. This pattern analysis depended on a local region's sensitivity to both the magnitude of attentional modulation and the object category being attended on individual face-blend blocks. For each iteration of the searchlight, we measured the attentional bias signal in a local 3 × 3 × 3 voxel region for all stimulus blocks, and then determined whether within-category (face or house) bias was correlated (R) with bias in V1–V4.
As expected, strong correlations from this searchlight analysis emerged within early visual areas V1–V4, confirming the efficacy of this approach. Outside of V1–V4, the searchlight analysis revealed reliable modulations in the ventral occipitotemporal cortex around the FFA and PPA, as well as more restricted regions in the posterior parietal lobe (Fig. 4).
We also performed a modified searchlight analysis to determine whether any brain areas exhibited changes in amplitude that predicted the magnitude of attentional bias in areas V1–V4, independent of the object category being attended. Previous research has shown widespread changes in brain activity during fluctuations of general attentiveness or vigilance (Weissman et al. 2006), and in theory, such fluctuations could potentially account for the correlated attentional signals that we found across low- and high-level visual areas. For the modified searchlight analysis, we correlated the mean BOLD amplitude in local 3 × 3 × 3 voxel regions with the magnitude of attentional bias in areas V1–V4, and performed this local analysis repeatedly throughout the scanned volume. The resulting individual maps of correlation values were statistically evaluated at the group level by performing a t-test on Fisher's z-corrected values for all voxels, using false discovery rate to correct for multiple comparisons (Genovese et al. 2002). Employing a statistical threshold of P < 0.05, we found that there were no local regions that displayed a reliable relationship with the magnitude of attentional bias in V1–V4. The combined results of the 2 searchlight analyses suggest that the strong functional coupling we found between early visual areas and higher level areas depends on selective attentional bias effects in favor of one object category or the other, rather than on nonspecific effects of vigilance or alertness.
Posterior Parietal Cortex
We performed an additional region-of-interest analysis on visually active voxels in the posterior parietal cortex, because of the positive results found in this region based on the group searchlight analysis. Here, we selected all contiguous posterior parietal voxels that were significantly activated by the functional localizer runs during which participants performed discrimination tasks involving the same face and house stimuli.
Activity patterns in this parietal region accurately discriminated between attended faces and houses (mean classification accuracy, 92%). Overall, the attentional bias signal in this region correlated quite well with the attentional bias signal found in early visual areas (mean R = 0.38 and 0.39 for attend face and attend house, respectively). The positive results found here are consistent with previous reports of shape-selective processing in the parietal cortex (Sereno and Maunsell 1998; Konen and Kastner 2008).
In comparison, however, the attentional bias signal was more strongly correlated between early visual areas and the FFA/PPA regions (mean R = 0.65 and 0.66 for attend face and attend house, respectively). Statistical comparisons were performed by applying a t-test to Fisher's z-transformed correlation values, which indicated significantly stronger correlations between V1–V4 and FFA/PPA than between V1–V4 and posterior parietal cortex when participants attended to houses (T(5) = 4.49, P < 0.01), and a marginally significant difference when attending to faces (T(5) = 2.39, P = 0.06). Stronger correlations suggest stronger functional coupling between early visual areas and the FFA/PPA region, which could reflect both the consequences of early stage attentional filtering on the visual signals that subsequently reach these higher level object areas as well as the top-down influence of FFA/PPA on early visual areas. Indeed, bidirectional interactions between low- and high-level visual areas are believed to be important for effective visual processing according to interactive models (Lamme and Roelfsema 2000; Lee and Mumford 2003; Tong 2003).
In addition, the attentional bias signal in PPC correlated moderately with the attentional bias signal found in FFA/PPA (mean R = 0.35 and 0.29 for attend face and attend house, respectively). Future work is needed to tease out the collective attentional relationship between the 3 interconnected areas. The above analyses indicate that we find strongest correlations between early visual areas and FFA/PPA.
Control Analyses
Multiple control analyses were performed to address whether these correlated modulations between low- and high-level visual areas might instead be attributable to nonattentional factors such as head motion, eye movements, or fluctuations in general alertness. First, we analyzed eye-position signals to determine whether they reliably distinguished between attending to faces or houses. Reliable eye-tracking data were successfully obtained for 4 of the 6 subjects who participated in Experiment 1. (Technical difficulties prevented the collection of reliable signals from the infrared camera from the remaining 2 subjects.) Eye positions were generally well centered at fixation, with mean horizontal (x) and vertical (y) positions of 0.11° and 0.19°, respectively. We performed statistical comparisons to determine whether eye position might differ between the single face and single house conditions, or between the attend face and attend house conditions (see Table 1). We also submitted the eye-tracking data as input to a linear classifier to determine whether small shifts in eye position could be a reliable predictor of the target condition. Input to the classifier consisted of the mean horizontal and vertical positions of the eye over each experimental block, their product, as well as the standard deviations in eye position.
Table 1.
Analysis of eye-position data
| Subject | 1 | 2 | 3 | 4 |
|---|---|---|---|---|
| (a) Differences in eye position for single face and single house | ||||
| Mean ΔX (°) | 0.08 | 0.14 | −0.22 | 0.01 |
| t-Test (ΔX) | 1.18 | 1.06 | −1.40 | 0.02 |
| P | 0.24 | 0.29 | 0.17 | 0.98 |
| Mean ΔY (°) | 0.05 | 0.01 | −0.04 | 0.34 |
| t-Test (ΔY) | 0.27 | 0.07 | −0.44 | 2.93 |
| P | 0.79 | 0.94 | 0.66 | <0.01 |
| DF | 62 | 62 | 58 | 60 |
| Eye-position decoding accuracy (%) | 48.4 | 50 | 53.3 | 66.1 |
| P | n.s. | n.s. | 0.52 | <0.01 |
| (b) Differences in eye position for attend face and attend house | ||||
| Subject | 1 | 2 | 3 | 4 |
| Mean ΔX (°) | 0.19 | 0.22 | 0.09 | 0.44 |
| t-Test (ΔX) | 1.31 | 1.77 | 0.88 | 2.49 |
| P | 0.20 | 0.08 | 0.38 | 0.02 |
| Mean ΔY (°) | 0.08 | −0.20 | 0.07 | 0.45 |
| t-Test (ΔY) | 0.36 | −1.14 | 0.57 | 3.77 |
| P | 0.72 | 0.26 | 0.57 | 0.00 |
| DF | 62 | 62 | 58 | 61 |
| Eye-position decoding accuracy (%) | 56.2 | 54.6 | 53.3 | 82.5 |
| P | 0.26 | 0.38 | 0.52 | <0.001 |
Note: Vertical (x) and horizontal (y) differences in eye position between single-face and single-house conditions (a), and between attend face and attend house conditions (b). Differences reported in degrees of visual angle; statistical comparisons performed using t-tests. Also, a linear classifier was trained to decode object category based on mean and standard deviation of eye-position values for each stimulus block. Deviations from 50% chance-level decoding accuracy was evaluated using a 2-tailed binomial test.
For 3 of 4 subjects, we found no reliable differences in eye position for any comparisons between conditions. One of the 4 subjects did show statistically reliable differences in eye position between single faces and houses and also between attended faces and houses, but even here, eye-position differences were quite modest and <0.5° of shift. Classification analyses indicated that eye-position shifts from only the fourth subject were predictive of the target object category. However, given that all of our subjects showed highly reliable effects of object-based attention in every visual area tested, the lack of reliable eye-position shifts in most of our subjects indicates that this was not an important or necessary factor for reliable fMRI decoding.
Moreover, our analyses of head motion data, eye-position data, and the frequency/duration of eye blinks failed to reveal reliable correlations with the magnitude of attentional bias in early visual areas. Previous neuroimaging studies have demonstrated widespread changes in cortical responses during lapses of visual attention, including diminished activity throughout visual cortex and compensatory increases in parietal control-related activity (Weissman et al. 2006). However, our modified searchlight analysis failed to reveal any brain regions that predicted the magnitude of attention modulation in early visual areas, independent of the attended object category. Taken together, these control analyses indicate that nonattentional factors cannot readily account for the strong functional coupling that was found across distinct levels of the visual hierarchy. Instead, the strong functional coupling between areas can be better attributed to fluctuations in the efficacy of a common object-based attentional mechanism.
Experiments 2–3: Spatial and Featural Specificity of Object-Based Attentional Signals
The first experiment revealed discriminating patterns of top-down attentional bias in early visual areas when participants attended to either faces or houses in the overlapping face–house blends. In Experiment 2, we further compared the patterns of activity evoked by unattended faces and houses with those observed during object-based attention. In the unattended condition, participants had to discriminate letters presented at central fixation while task-irrelevant faces or houses were presented in the region surrounding the fixation point. Activity patterns evoked by unattended faces and houses could reliably predict the attended target when observers viewed face–house blends in separate experimental runs (Fig. 5). These findings suggest that the attentional bias found in early visual areas serves to enhance the stimulus representation of the attended object.
Figure 5.

Object decoding performance for attended and unattended objects. Mean accuracy of decoding for attended faces versus attended houses while viewing face–house blends (squares), unattended single faces versus single houses while performing a challenging letter detection task at central fixation (diamonds), and generalization performance across attended and unattended tasks (triangles). Error bars indicate ± 1 SEM. Decoding accuracy significantly exceeded chance-level performance for every visual area and experimental condition.
We conducted a third experiment to determine whether these object-specific bias signals were spatially specific to the retinotopic regions receiving direct stimulation or whether they might also be found in unstimulated portions of the visual field. Recent neuroimaging studies have suggested that feature-based attention and attention directed to different object classes can lead to widespread modulatory effects in early visual areas, even in unstimulated regions such as the foveal confluence (Serences and Boynton 2007; Williams et al. 2008; Jehee et al. 2011). Might such a global modulatory effect account for the object-discriminating signals found in this study?
In Experiment 3, observers maintained central fixation while face–house blends were presented peripherally in either the upper left or lower right visual quadrant. For early visual areas (V1–V3), classifiers trained on activity patterns for one location led to much better prediction of attended objects when the test stimuli were presented at same location in comparison to the other stimulus location (Fig. 6a). The positional specificity of these attentional bias effects in V1–V3 sharply contrasted with the position-invariant effects found in the FFA/PPA region. However, we also observed a modest degree of generalization across changes in position, with statistically significant or marginally significant effects found in early visual areas. These results imply the presence of both position-specific and position-general components of the attentional feedback signal, with position-specific feedback signals providing the majority of the discriminating information in early visual areas.
Figure 6.

Object-based attention across changes in retinotopic location. Mean accuracy of decoding the attended object for face–house blends presented in the upper left (circles) or lower right visual field (squares). Accuracy of generalization performance across changes in position (triangles). (a) Decoding performance in visual areas V1–V4 and FFA/PPA for retinotopic regions corresponding to the 2 stimulated locations. All conditions displayed above-chance decoding (by 1-tailed t-test), with the exception of generalization for V1 and V3A, which reached marginal significance (P = 0.07 and P = 0.09, respectively). Decoding was significantly greater for either location when compared with generalization across locations for every area except FFA/PPA. (b) Decoding performance for the foveal representation in areas V1–V3, shown for individual and combined areas. Statistical reliability of generalization performance for foveal regions of V1, V2, V3, and V1–V3 combined was indicated by P-values of 0.21, 0.31, 0.07, and 0.09, respectively. Error bars indicate ± 1 SEM.
We performed further decoding analyses of the foveal representation of areas V1–V3, which were delineated based on individual retinotopic maps obtained in these subjects. Because the face–house blends were presented away from the fovea in this experiment, they would be expected to minimally activate this region. Decoding of the attended object was generally poor for the foveal representation in early visual areas, and fell to chance levels in V1, indicating that the unstimulated foveal region did not show much evidence of top-down feedback of object information (Fig. 6b). Moreover, generalization performance was at chance level for foveal regions of V1, V2, and V3, indicating that the information contained in these feedback signals were quite specific to the retinal position of the attended object. The above findings show that object-based attention primarily involves the enhancement of the local features belonging to the attended object, and that these highly specific bias effects can be distinguished from previous reports of global top-down modulations (Serences and Boynton 2007; Williams et al. 2008; Jehee et al. 2011).
Experiment 4: Contributions of High-Level Object Knowledge
In Experiment 4, we investigated whether greater familiarity with an object might lead to more efficient object-based attentional selection in early visual areas, by manipulating object orientation. We hypothesized that under challenging viewing conditions, high-level object knowledge might be especially helpful to the top-down selection process.
Observers were randomly cued to attend to faces or houses at the beginning of each trial, and then viewed brief presentations of upright or upside-down blends that were immediately followed by masking noise patterns (Fig. 7a). Prestimulus cues indicated the object category to be attended but did not indicate the object's orientation. This randomized trial design required the use of rapid event-related fMRI, which led to generally lower but still reliable levels of decoding performance.
Behavioral performance indicated an advantage for stimuli presented in a familiar upright orientation, specifically for upright faces when compared with inverted faces (83% and 72% correct, respectively). Decoding analyses revealed that activity patterns in early visual areas reliably predicted the attended object category for upright stimuli but not for inverted stimuli, with overall better performance found for upright objects (Fig. 7b). These results indicate that object familiarity facilitates the efficiency of this attentional selection process in early visual areas. This suggests that the attentional feedback to early visual areas was informed by high-level areas with relevant object knowledge. Although the source of this feedback cannot be conclusively determined based on correlational measures of brain activity, possible sources identified in this study include the FFA/PPA region, other portions of the ventral temporal cortex, and regions of the posterior parietal cortex.
Given that we found better behavioral performance for upright than inverted faces, but no reliable difference in performance for upright and inverted houses (89% and 88% correct, respectively), one might also ask whether this category-specific behavioral benefit was also evident in the pattern of fMRI results. Our experimental design relied on decoding which of 2 overlapping object types was being attended; thus, decoding would be expected to improve if top-down knowledge led to enhanced attentional selection of only one or both object types. It would be interesting for future studies to investigate whether attentional selection of faces is specifically enhanced by upright presentation, when compared with the attentional selection of other categories of objects. One possibility is that current results are largely driven by the well-documented face-inversion effect (Valentine 1988; McKone and Yovel 2009), which is known to disrupt both perceptual and recognition processes.
Modeling of Pattern-Specific Feedback to Early Visual Areas
We developed a computational model to understand how feedback to early visual areas might improve performance at this object-based attention task. The problem can be understood as follows. If an observer is trying to discern the unique identifying information about a face that is partially masked by an overlapping house, what type of attentional feedback might enhance the visual system's representation of the attended object? For example, if high-level areas make a very specific prediction about the face's structural identity for determining feedback, then activity patterns in early visual areas will simply be biased to conform with this initial prediction. Such highly specific feedback could lead to “confirmation bias,” with minimal information to be gained if the identity prediction proves correct, and with incorrect predictions leading to biased activity patterns that could result in error. To reduce bias, an alternative strategy might be to use the average of many faces as an attentional template for feedback. However, how would feedback of a single average face template improve the visual system's ability to discriminate between multiple individual faces?
We investigated the effects of pattern-specific feedback using a Gabor wavelet pyramid (Lee 1996) to simulate the responses of an array of V1 simple cells and complex cells. We hypothesized that feedback of an average face (or house) template might be beneficial if that feedback signal can successfully generalize across local variations in the position of discriminating features across the stimuli in each set. For example, the dark edge created by an eyebrow will vary in position somewhat from face to face. Whereas simple cells are phase-specific in their orientation preference and may respond poorly to an eyebrow shifted in position, a horizontally tuned complex cell would respond well if that eyebrow appeared anywhere within its receptive field. As a consequence, we hypothesized that feedback to phase-invariant complex cells might provide sufficient flexibility to allow an average attentional template to successfully generalize from one sample stimulus to another.
We compared the performance of a Gabor pyramid of simple cells and complex cells on the ability to classify V1 activity patterns according to the individual face or house that appeared within face–house blends. (Classification can be considered a form of readout performed by the output layer). For each simulation, the face and house stimuli were randomly assigned to separate subsets, which were used to generate a template of averaged V1 responses to faces or houses, and to train a simple linear classifier on multiple face–house blends (see Materials and Methods for details). The classifier was then tested at discriminating a target face or house from the training set, but in the presence of a new superimposed distractor from the other category.
The results of our simulation analysis indicated that feedback of an average template to V1 complex cells, which have modest positional invariance, improved the visual system's ability to distinguish between individual exemplars belonging to the attended category (Fig. 8). By contrast, feedback to V1 simple cells failed to improve discrimination performance in a consistent manner, because this highly specific attentional template failed to generalize well across variations between exemplars. These findings demonstrate how top-down feedback of a single template pattern to early visual units can improve the visual system's ability to distinguish between stimuli belonging to the attended category. Note that here we adopted the simplest possible architecture, akin to a 2-layer network with an input layer of V1 units and an object representation layer. Of course, one could incorporate a greater degree of positional and featural invariance by introducing intermediate layers to this network. For example, a prominent feedforward model of object recognition includes an intermediate V4-like layer whose units are sensitized to combinations of V1 complex cell responses and are more invariant than the V1 units (Riesenhuber and Poggio 1999). If object-specific feedback were realized through such a multilayer network, an even broader population of V1 units would be modulated, thereby allowing for better generalization across different examples of the object category. For the present study, our goal was to characterize the potential benefits of attentional feedback to early visual units using the simplest possible architecture for our model.
Discussion
This study provides compelling evidence of how pattern-specific feedback to early visual areas contributes to the attentional selection of complex objects. In areas V1–V4, activity patterns evoked by face–house blends were strongly biased by object-based attention in favor of the item that was voluntarily attended. The efficacy of this early attentional selection was highly correlated with the degree of attentional bias found in high-level object-selective areas, with robust effects observed in every participant. These results imply that pattern-specific attentional filtering at early sites can determine the quality of object-specific signals that ultimately reach higher level visual areas. Moreover, we found that high-level object knowledge, namely greater familiarity with upright objects, contributed to the efficiency of this selection process in early visual areas.
Our findings represent an advance over previous theories and models of object-based attention (Duncan 1984; Kahneman et al. 1992; Baylis and Driver 1993; Logan 1996; Behrmann et al. 1998; Blaser et al. 2000; Driver et al. 2001; Scholl 2001; van Der Velde and de Kamps 2001). Most previous models have not specified the mechanism by which attention might select among competing overlapping objects, nor have they addressed what types of feedback might be most effective for discriminating the attended object. Through computational modeling, we demonstrated how feedback of an average face (or house) template to V1 complex units can improve the visual system's ability to distinguish between individual exemplars within the attended category. Feedforward models of object recognition have highlighted the importance of complex cell-like computations for acquiring invariance to image variations of objects (Riesenhuber and Poggio 1999). Here, we show how feedback to complex units can allow for more flexible, adaptive top-down selection of a target object. Taken together, our fMRI and modeling results provide a mechanistic account for understanding how specific patterns of feedback to early visual areas can contribute to object-based attentional selection.
Although the focus of the current study was to investigate the neural mechanisms of object-based attention, there have also been recent reports of top-down effects in early visual areas during object recognition tasks. Following successful recognition of an ambiguous Mooney image, activity patterns in early visual areas become more stable and reliable (Hsieh et al. 2010; Gorlin et al. 2012), and more closely resemble the activity pattern evoked by the unambiguous grayscale version of that stimulus. In addition, some studies have reported evidence of more abstracted object information in early visual areas. For example, Williams et al. (2008) found that activity patterns in the foveal visual cortex could distinguish between different object categories appearing in the periphery, and that these activity patterns remained stable across changes in object location (Williams et al. 2008). This work suggested that top-down object processing can lead to a position-invariant feedback signal in the foveal representation of early visual areas. In the present study, we observed far better decoding of the attended object at the peripheral stimulus location than in the unstimulated foveal visual cortex, and moreover, generalization across changes in location led to near-chance levels of performance. It is possible that our study found minimal evidence of position-invariant object information because we used strict retinotopic mapping methods to delineate foveal regions of V1–V3, whereas such mapping was not performed by Williams and colleagues. However, another important distinction was that our task required attending selectively to an object in the presence of competing overlapping distractors. Based on our modeling work, we would expect that object-based attentional feedback in early visual areas should exhibit a considerable degree of positional specificity, similar to the specificity of complex cells.
In conclusion, our approach of using fMRI pattern classification not only allowed us to isolate object-discriminating activity throughout the visual hierarchy, but also proved useful for comparing the strength of object-selective attentional modulation across areas with distinct visual tuning properties. Previously, we have used fMRI decoding to show that feature-based attention leads to reliable modulations in early visual areas (Kamitani and Tong 2005; Jehee et al. 2011), and such methods have been successfully applied to investigate attentional modulation of high-level object areas (Peelen et al. 2009; Reddy et al. 2009; Cukur et al. 2013). Here, we applied a common pattern classification framework to measure the strength of attentional bias signals in both low- and high-level visual areas, and to investigate their functional relationship. Our results suggest that object-based attention relies on the feedback of pattern-specific information to early visual areas, to enhance visual system's ability to distinguish the attended object in the presence of competing overlapping distractors.
Authors’ Contributions
E.H.C. and F.T. designed the experiments, E.H.C. conducted the experiments and analyses with input from F.T., and E.H.C and F.T. wrote the paper together.
Funding
This work was supported by NSF grant BCS-0642633 and DARPA grant N10AP20003, and also benefited from administrative support by NIH P30-EY008126 center grant to the Vanderbilt Vision Research Center.
Notes
We thank E. Counterman, B. Wolfe, and J. Swisher for technical advice and support, and Dr John Gore and the Vanderbilt University Institute of Imaging Science (VUIIS) for MRI support. Conflict of Interest: None declared.
References
- Al-Aidroos N, Said CP, Turk-Browne NB. Top-down attention switches coupling between low-level and high-level areas of human visual cortex. Proc Natl Acad Sci USA. 2012;109:14675–14680. doi: 10.1073/pnas.1202095109. [DOI] [PMC free article] [PubMed] [Google Scholar]
- Baylis GC, Driver J. Visual attention and objects: evidence for hierarchical coding of location. J Exp Psychol Hum Percept Perform. 1993;19:451–470. doi: 10.1037//0096-1523.19.3.451. [DOI] [PubMed] [Google Scholar]
- Behrmann M, Zemel RS, Mozer MC. Object-based attention and occlusion: evidence from normal participants and a computational model. J Exp Psychol Hum Percept Perform. 1998;24:1011–1036. doi: 10.1037//0096-1523.24.4.1011. [DOI] [PubMed] [Google Scholar]
- Blaser E, Pylyshyn ZW, Holcombe AO. Tracking an object through feature space. Nature. 2000;408:196–199. doi: 10.1038/35041567. [DOI] [PubMed] [Google Scholar]
- Ciaramitaro VM, Mitchell JF, Stoner GR, Reynolds JH, Boynton GM. Object-based attention to one of two superimposed surfaces alters responses in human early visual cortex. J Neurophysiol. 2011;105:1258–1265. doi: 10.1152/jn.00680.2010. [DOI] [PMC free article] [PubMed] [Google Scholar]
- Cohen MA, Alvarez GA, Nakayama K. Natural-scene perception requires attention. Psychol Sci. 2011;22:1165–1172. doi: 10.1177/0956797611419168. [DOI] [PubMed] [Google Scholar]
- Cukur T, Nishimoto S, Huth AG, Gallant JL. Attention during natural vision warps semantic representation across the human brain. Nat Neurosci. 2013;16:763–770. doi: 10.1038/nn.3381. [DOI] [PMC free article] [PubMed] [Google Scholar]
- Desimone R, Duncan J. Neural mechanisms of selective visual attention. Annu Rev Neurosci. 1995;18:193–222. doi: 10.1146/annurev.ne.18.030195.001205. [DOI] [PubMed] [Google Scholar]
- Driver J, Davis G, Russell C, Turatto M, Freeman E. Segmentation, attention and phenomenal visual objects. Cognition. 2001;80:61–95. doi: 10.1016/s0010-0277(00)00151-7. [DOI] [PubMed] [Google Scholar]
- Duncan J. Selective attention and the organization of visual information. J Exp Psychol Gen. 1984;113:501–517. doi: 10.1037//0096-3445.113.4.501. [DOI] [PubMed] [Google Scholar]
- Engel SA, Glover GH, Wandell BA. Retinotopic organization in human visual cortex and the spatial precision of functional MRI. Cereb Cortex. 1997;7:181–192. doi: 10.1093/cercor/7.2.181. [DOI] [PubMed] [Google Scholar]
- Epstein R, Kanwisher N. A cortical representation of the local visual environment. Nature. 1998;392:598–601. doi: 10.1038/33402. [DOI] [PubMed] [Google Scholar]
- Fallah M, Stoner GR, Reynolds JH. Stimulus-specific competitive selection in macaque extrastriate visual area V4. Proc Natl Acad Sci USA. 2007;104:4165–4169. doi: 10.1073/pnas.0611722104. [DOI] [PMC free article] [PubMed] [Google Scholar]
- Furey ML, Tanskanen T, Beauchamp MS, Avikainen S, Uutela K, Hari R, Haxby JV. Dissociation of face-selective cortical responses by attention. Proc Natl Acad Sci USA. 2006;103:1065–1070. doi: 10.1073/pnas.0510124103. [DOI] [PMC free article] [PubMed] [Google Scholar]
- Genovese CR, Lazar NA, Nichols T. Thresholding of statistical maps in functional neuroimaging using the false discovery rate. NeuroImage. 2002;15:870–878. doi: 10.1006/nimg.2001.1037. [DOI] [PubMed] [Google Scholar]
- Gorlin S, Meng M, Sharma J, Sugihara H, Sur M, Sinha P. Imaging prior information in the brain. Proc Natl Acad Sci USA. 2012;109:7935–7940. doi: 10.1073/pnas.1111224109. [DOI] [PMC free article] [PubMed] [Google Scholar]
- Hou Y, Liu T. Neural correlates of object-based attentional selection in human cortex. Neuropsychologia. 2012;50:2916–2925. doi: 10.1016/j.neuropsychologia.2012.08.022. [DOI] [PMC free article] [PubMed] [Google Scholar]
- Hsieh PJ, Vul E, Kanwisher N. Recognition alters the spatial pattern of FMRI activation in early retinotopic cortex. J Neurophysiol. 2010;103:1501–1507. doi: 10.1152/jn.00812.2009. [DOI] [PMC free article] [PubMed] [Google Scholar]
- Jehee JF, Brady DK, Tong F. Attention improves encoding of task-relevant features in the human visual cortex. J Neurosci. 2011;31:8210–8219. doi: 10.1523/JNEUROSCI.6153-09.2011. [DOI] [PMC free article] [PubMed] [Google Scholar]
- Kahneman D, Treisman A, Gibbs BJ. The reviewing of object files: object-specific integration of information. Cogn Psychol. 1992;24:175–219. doi: 10.1016/0010-0285(92)90007-o. [DOI] [PubMed] [Google Scholar]
- Kamitani Y, Tong F. Decoding the visual and subjective contents of the human brain. Nat Neurosci. 2005;8:679–685. doi: 10.1038/nn1444. [DOI] [PMC free article] [PubMed] [Google Scholar]
- Kanwisher N, McDermott J, Chun MM. The fusiform face area: a module in human extrastriate cortex specialized for face perception. J Neurosci. 1997;17:4302–4311. doi: 10.1523/JNEUROSCI.17-11-04302.1997. [DOI] [PMC free article] [PubMed] [Google Scholar]
- Konen CS, Kastner S. Two hierarchically organized neural systems for object information in human visual cortex. Nat Neurosci. 2008;11:224–231. doi: 10.1038/nn2036. [DOI] [PubMed] [Google Scholar]
- Kriegeskorte N, Goebel R, Bandettini P. Information-based functional brain mapping. Proc Natl Acad Sci USA. 2006;103:3863–3868. doi: 10.1073/pnas.0600244103. [DOI] [PMC free article] [PubMed] [Google Scholar]
- Lamme VA, Roelfsema PR. The distinct modes of vision offered by feedforward and recurrent processing. Trends Neurosci. 2000;23:571–579. doi: 10.1016/s0166-2236(00)01657-x. [DOI] [PubMed] [Google Scholar]
- Lee TS. Image representation using 2D Gabor wavelets. IEEE Trans Pattern Anal Mach Intell. 1996;18:959–971. [Google Scholar]
- Lee TS, Mumford D. Hierarchical Bayesian inference in the visual cortex. J Opt Soc Am A. 2003;20:1434–1448. doi: 10.1364/josaa.20.001434. [DOI] [PubMed] [Google Scholar]
- Logan GD. The CODE theory of visual attention: an integration of space-based and object-based attention. Psychol Rev. 1996;103:603–649. doi: 10.1037/0033-295x.103.4.603. [DOI] [PubMed] [Google Scholar]
- McKone E, Yovel G. Why does picture-plane inversion sometimes dissociate perception of features and spacing in faces, and sometimes not? Toward a new theory of holistic processing. Psychon B Rev. 2009;16:778–797. doi: 10.3758/PBR.16.5.778. [DOI] [PubMed] [Google Scholar]
- Muller NG, Kleinschmidt A. Dynamic interaction of object- and space-based attention in retinotopic visual areas. J Neurosci. 2003;23:9812–9816. doi: 10.1523/JNEUROSCI.23-30-09812.2003. [DOI] [PMC free article] [PubMed] [Google Scholar]
- O'Craven KM, Downing PE, Kanwisher N. fMRI evidence for objects as the units of attentional selection. Nature. 1999;401:584–587. doi: 10.1038/44134. [DOI] [PubMed] [Google Scholar]
- Peelen MV, Fei-Fei L, Kastner S. Neural mechanisms of rapid natural scene categorization in human visual cortex. Nature. 2009;460:94–97. doi: 10.1038/nature08103. [DOI] [PMC free article] [PubMed] [Google Scholar]
- Reddy L, Kanwisher NG, VanRullen R. Attention and biased competition in multi-voxel object representations. Proc Natl Acad Sci USA. 2009;106:21447–21452. doi: 10.1073/pnas.0907330106. [DOI] [PMC free article] [PubMed] [Google Scholar]
- Riesenhuber M, Poggio T. Hierarchical models of object recognition in cortex. Nat Neurosci. 1999;2:1019–1025. doi: 10.1038/14819. [DOI] [PubMed] [Google Scholar]
- Roelfsema PR, Lamme VA, Spekreijse H. Object-based attention in the primary visual cortex of the macaque monkey. Nature. 1998;395:376–381. doi: 10.1038/26475. [DOI] [PubMed] [Google Scholar]
- Schira MM, Tyler CW, Breakspear M, Spehar B. The foveal confluence in human visual cortex. J Neurosci. 2009;29:9050–9058. doi: 10.1523/JNEUROSCI.1760-09.2009. [DOI] [PMC free article] [PubMed] [Google Scholar]
- Schoenfeld MA, Tempelmann C, Martinez A, Hopf JM, Sattler C, Heinze HJ, Hillyard SA. Dynamics of feature binding during object-selective attention. Proc Natl Acad Sci USA. 2003;100:11806–11811. doi: 10.1073/pnas.1932820100. [DOI] [PMC free article] [PubMed] [Google Scholar]
- Scholl BJ. Objects and attention: the state of the art. Cognition. 2001;80:1–46. doi: 10.1016/s0010-0277(00)00152-9. [DOI] [PubMed] [Google Scholar]
- Serences JT, Boynton GM. Feature-based attentional modulations in the absence of direct visual stimulation. Neuron. 2007;55:301–312. doi: 10.1016/j.neuron.2007.06.015. [DOI] [PubMed] [Google Scholar]
- Serences JT, Schwarzbach J, Courtney SM, Golay X, Yantis S. Control of object-based attention in human cortex. Cereb Cortex. 2004;14:1346–1357. doi: 10.1093/cercor/bhh095. [DOI] [PubMed] [Google Scholar]
- Sereno AB, Maunsell JH. Shape selectivity in primate lateral intraparietal cortex. Nature. 1998;395:500–503. doi: 10.1038/26752. [DOI] [PubMed] [Google Scholar]
- Sereno MI, Dale AM, Reppas JB, Kwong KK, Belliveau JW, Brady TJ, Rosen BR, Tootell RB. Borders of multiple visual areas in humans revealed by functional magnetic resonance imaging. Science. 1995;268:889–893. doi: 10.1126/science.7754376. [DOI] [PubMed] [Google Scholar]
- Tong F. Primary visual cortex and visual awareness. Nat Rev Neurosci. 2003;4:219–229. doi: 10.1038/nrn1055. [DOI] [PubMed] [Google Scholar]
- Tong F, Pratte MS. Decoding patterns of human brain activity. Annu Rev Psychol. 2012;63:483–509. doi: 10.1146/annurev-psych-120710-100412. [DOI] [PMC free article] [PubMed] [Google Scholar]
- Troje NF, Bulthoff HH. Face recognition under varying poses: the role of texture and shape. Vision Res. 1996;36:1761–1771. doi: 10.1016/0042-6989(95)00230-8. [DOI] [PubMed] [Google Scholar]
- Valdes-Sosa M, Bobes MA, Rodriguez V, Pinilla T. Switching attention without shifting the spotlight object-based attentional modulation of brain potentials. J Cogn Neurosci. 1998;10:137–151. doi: 10.1162/089892998563743. [DOI] [PubMed] [Google Scholar]
- Valentine T. Upside- down faces: a review of the effect of inversion upon face recognition. Brit J Psychol. 1988;79:471–491. doi: 10.1111/j.2044-8295.1988.tb02747.x. [DOI] [PubMed] [Google Scholar]
- van Der Velde F, de Kamps M. From knowing what to knowing where: modeling object-based attention with feedback disinhibition of activation. J Cogn Neurosci. 2001;13:479–491. doi: 10.1162/08989290152001907. [DOI] [PubMed] [Google Scholar]
- Weissman DH, Roberts KC, Visscher KM, Woldorff MG. The neural bases of momentary lapses in attention. Nat Neurosci. 2006;9:971–978. doi: 10.1038/nn1727. [DOI] [PubMed] [Google Scholar]
- Williams MA, Baker CI, Op de Beeck HP, Shim WM, Dang S, Triantafyllou C, Kanwisher N. Feedback of visual object information to foveal retinotopic cortex. Nat Neurosci. 2008;11:1439–1445. doi: 10.1038/nn.2218. [DOI] [PMC free article] [PubMed] [Google Scholar]