

Abstract
A circulating tumor cell (CTC) selection microfluidic device was integrated to an electrokinetic enrichment device for preconcentrating CTCs directly from whole blood to allow for the detection of mutations contained within the genomic DNA of the CTCs. Molecular profiling of CTCs can provide important clinical information that cannot be garnered simply by enumerating the selected CTCs. We evaluated our approach using SW620 and HT29 cells (colorectal cancer cell lines) seeded into whole blood as a model system. Because SW620 and HT29 cells overexpress the integral membrane protein EpCAM, they could be immunospecifically selected using a microfluidic device containing anti-EpCAM antibodies immobilized to the walls of a selection bed. The microfluidic device was operated at an optimized flow rate of 2 mm s−1, which allowed for the ability to process 1 mL of whole blood in <40 min. The selected CTCs were then enzymatically released from the antibody selection surface and hydrodynamically transported through a pair of Pt electrodes for conductivity-based enumeration. The efficiency of CTC selection was found to be 96% ± 4%. Following enumeration, the CTCs were hydrodynamically transported at a flow rate of 1 μL min−1 to an on-chip electromanipulation unit, where they were electrophoretically withdrawn from the bulk hydrodynamic flow and directed into a receiving reservoir. Using an electric field of 100 V cm−1, the negatively charged CTCs were enriched into an anodic receiving reservoir to a final volume of 2 μL, providing an enrichment factor of 500. The collected CTCs could then be searched for point mutations using a PCR/LDR/capillary electrophoresis assay. The DNA extracted from the CTCs was subjected to a primary polymerase chain reaction (PCR) with the amplicons used for a ligase detection reaction (LDR) to probe for KRAS oncogenic point mutations. Point mutations in codon 12 of the KRAS gene were successfully detected in the SW620 CTCs for samples containing <10 CTCs in 1 mL of whole blood. However, the HT29 cells did not contain these mutations, consistent with their known genotype.
Colorectal cancer (CRC) accounts for nearly 1 million new cases and 550 000 deaths worldwide each year; it is the fourth most common cancer in the United States and the third leading cause of cancer-related deaths in the western world. Diagnostic and/or prognostic tests for CRC consist primarily of looking for bleeding in the stool (fecal occult blood test, FOBT) and/or endoscopic examinations of the colon and rectum. A critical limitation of the FOBT is the relatively poor sensitivity it affords toward detecting early stage lesions. In addition, FOBT provides poor clinical sensitivity for the detection of colorectal neoplasms, with a sensitivity reported to be 40–85% for CRCs.1-4 On the other hand, endoscopic examinations, such as colonoscopy or flexible sigmoidoscopy, can detect early stage lesions but miss proximal lesions when the distal colon is examined. Even in cases where both stool samples and endoscopy are employed, 25% of cases are expected to be missed.5
In cancer patients with either metastatic or localized disease, there is growing evidence that the presence of circulating tumor cells (CTCs) in the blood may be an important indicator of the potential for metastatic disease and, thus, poor prognosis.6 Various epithelial-based cancers are known to release CTCs into circulation, for example, breast, bladder, prostate, lung, colorectal, cervical, and pancreatic cancers. The attractive attribute associated with CTCs as a cancer biomarker is their ease of securing the sample; a simple blood draw can be used to allow for the selection and enumeration of these cells.7 CTCs can provide valuable clinical information as well, such as early diagnosis of relapse, monitoring the effectiveness of adjuvant therapy, and serving as an independent prognostic factor.
Although surgical resection of diseased tissue in conjunction with chemotherapy is an effective mode of treatment for highly localized CRC, 30–50% of these patients ultimately experience recurrence and may die.8 The high rate of recurrence for CRC could be due to heightened levels of CTCs in peripheral blood following surgery; indeed, elevated levels of CTCs have been found postoperatively in CRC patients.9
In addition to the enumeration of CTCs, mutations in certain genes carried by CTCs can be used to guide therapy and provide opportunities for personalized treatment. For example, CRC patients with mutated KRAS oncogenes do not benefit from anti-EGFR mAB therapy, whereas patients with wild-type KRAS genotypes do benefit from cetuximab- and panitumumab-based treatments.10 Yang and co-workers recently found that 90% of metastatic CRC patients had a KRAS mutational status in their CTCs similar to the primary tumor as determined by genotyping mRNA surrogates.11 The significant challenge in genotyping genomic DNA (gDNA) from mass-limited samples, such as CTCs isolated from cancer patients, is the small copy number of the assay’s input material. Indeed, most studies in which molecular profiling has been invoked using CTCs has focused on using reverse transcription PCR with mRNA surrogates to record gene activity or the presence/absence of mutations in the cDNA due to the higher copy number compared to the gDNA.12
Technological advances have now facilitated the selection, enumeration, and characterization of CTCs using methods such as polymerase chain reaction (PCR),13 flow cytometry,14 image-based immunological approaches,15 immunomagnetic techniques,16 and microchip technologies.17 The FDA-accepted modality for CTC selection has been the use of the Veridex CellSearch system, which uses magnetic beads coated with monoclonal antibodies (anti-EpCAM antibodies) for CTC selection from blood samples.18
Microchip technology has the potential to select with high recoveries, enumerate, and characterize rare CTCs in cancer patients. For example, Nagrath et al. developed a microfluidic device for selecting CTCs directly from peripheral blood.19 Recently, Toner and his group have developed a new version of their CTC chip that consists of a herringbone mixer with the chip made from PDMS and glass.20 The potential utility of these CTC chips in monitoring response to anticancer therapy were also investigated.19,20 Adams et al. and Dharmasiri et al. generated a polymer-based fluidic device for the high recovery and efficient enumeration of CTCs directly from peripheral blood using either anti-EpCAM antibodies or PSMA-specific aptamers as the recognition elements.21,22 Unfortunately the latter work did not perform any type of molecular analyses on the selected CTCs with these cells simply discarded to waste following their selection.21,22
In this work, we describe a microfluidic electrokinetic manipulation unit that was interfaced to a fluidic chip designed for the high-throughput processing of whole blood with high recoveries of the CTCs, coined a high-throughput microsampling unit (HTMSU).21 The electrokinetic manipulation unit used hydrodynamic flow and an electric field to direct CTCs released from the selection surface into a reservoir (2 μL) to allow for the molecular interrogation of low numbers of CTCs. Although any mutation harbored in gDNA could be analyzed using the reported assay, in the present study we used KRAS mutations in the CRC cell lines SW620 and HT29 as a model. Because most KRAS mutations are localized to codon 12, and to a lesser extent, codons 13 and 61, a PCR coupled to a ligase detection reaction (LDR) assay was performed on codon 12 of the KRAS oncogene of the CTCs.23,24 Following PCR/LDR, the resulting products were analyzed via capillary gel electrophoresis (CGE). The attractive nature of this assay format for mass-limited samples, such as the case for CTC analysis, is the double-amplification step employed; PCR provides an exponential amplification of the genes being interrogated while the LDR gives a linear amplification of products formed.
EXPERIMENTAL SECTION
Reagents and Cells
SW620 and HT29 colorectal cancer cell lines, growth media, HEPES buffer, phosphate-buffered saline (PBS), and trypsin were purchased from American Type Culture Collection (ATCC, Manassas, VA). A Cellstripper solution, which was used to remove the cultured cells from the growth medium, was purchased from Mediatech Inc. (Manassas, VA) and was used as received. Citrated rabbit blood was secured from Colorado Serum Company (Denver, CO). Poly(methyl metha-crylate), PMMA, substrates and coverplates (0.5 mm thickness) were purchased from Good Fellow (Berwyn, PA), while the Pt wires were purchased from Alfa Aesar (Boston, MA). Polyimide-coated fused-silica capillaries were obtained from Polymicro Technologies (Phoenix, AZ). Chemicals used for PMMA surface cleaning and modification included reagent grade isopropyl alcohol, 1-ethyl-3-[3-dimethylaminopropyl] carbodiimide hydrochloride (EDC), N-hydroxysuccinimide (NHS), fetal bovine serum, and 2-(4-morpholino)-ethane sulfonic acid (MES) with all acquired from Sigma-Aldrich (St. Louis, MO). Monoclonal anti-EpCAM antibody was obtained from R&D Systems (Minneapolis, MN). Tris–glycine buffer was obtained from Bio-Rad Laboratories (Hercules, CA). All solutions were prepared in nuclease-free water (Invitrogen, Carlsbad, CA). Nuclease-free microfuge tubes were purchased from Ambion (Foster City, CA) and used for preparation and storage of all samples and reagents. A fluorescein cell membrane labeling derivative, PKH67, was secured from Sigma-Aldrich. All oligonucleotide probes and primers were obtained from Integrated DNA Technologies (IDT, Coralville, IA).
Cell Visualization
A Zeiss Axiovert 200 M (Carl Zeiss, Thornwood, NY) inverted microscope was utilized in cases where the cells required optical visualization to assist in device operational optimization. The PMMA devices were fixed onto a programmable motorized stage of the Axiovert 200 M inverted microscope, and video images were collected during each experiment at 30 frames/s using a monochrome CCD (JAI CV252, San Jose, CA). A Xe arc lamp was used to excite fluorescent dyes incorporated into the cells’ membrane.
Fabrication of the HTMSU
The HTMSU and electromanipulation unit were hot-embossed into PMMA substrates via microreplication from a metal mold master. Fabrication of the HTMSU followed steps previously reported (see the Supporting Information for further details).21 The electromanipulation unit possessed one entry, through reservoir a (see Figure 1A) and two exits, via reservoirs b and c. Reservoir a was connected to a “T” intersection labeled e in Figure 1A. All of the channels were rectangular in shape with dimensions of 80 μm × 100 μm, width and depth, respectively. Pt wires of 125 μm diameter served as external electrodes in the b and c reservoirs of the electromanipulation unit.
Figure 1.

Diagrams showing the microfluidic system, which included the HTMSU and the electromanipulation unit. (A) The capture bed consisted of a series of 51 curvilinear channels (30 μm wide and 150 μm deep). The electromanipulation unit contained 80 μm wide, 100 μm deep, and 5 cm long linear channels. Conductometrically enumerated CTCs were introduced into the electromanipulation unit at port a, which served as the entrance port. Port a was connected to a “T” junction labeled e. Exit b served as the sample waste reservoir, while reservoir c was the CTC receiving reservoir (anodic reservoir). (B) Brightfield (left) and fluorescence (right) micrographs (40 ×) of selected SW620 CTCs using the HTMSU. (C) The selected SW620 CTCs were enriched into reservoir c due to their intrinsic electrophoretic mobility and the applied electric field. The total volume of the receiving reservoir was 2 μL.
Antibody Immobilization to the HTMSU
Antibody immobilization onto the UV-photoactivated PMMA chip was carried out using steps reported previously.21,22 The procedural details can be found in the Supporting Information.
Cell Capture/Release and Enumeration Using the HTMSU
A precapture rinse was performed on the HTMSU prior to sample processing using 0.2 mL of 150 mM PBS at 50 mm s−1 linear velocity to maintain isotonic conditions. Then, the appropriate volume of a cell suspension was introduced at 27.5 μL min−1 volumetric flow rate (linear velocity through the selection bed was 2 mm s−1).21 Next, a postcapture rinse was performed with 0.2 mL of 150 mM PBS at 50 mm s−1 to remove any nonspecifically adsorbed cells. Following a postcapture rinse, a 0.25% trypsin solution in 0.2 mM Tris/19.2 mM glycine buffer (pH = 8.3) was infused at 27.5 μL min−1 volumetric flow rate into the HTMSU.
Electrokinetic Cell Manipulation
The released cells were transported into the electromanipulation unit at 1 μL min−1 (3.3 mm s−1) from reservoir a (see Figure 1A). An electric field was applied between reservoirs b and c within the electromanipulation unit when cells were sensed by the conductivity detector. The programmable high-voltage power supply used in the electromanipulation unit was assembled in house and consisted of four individual power supplies (model UR5PN, Matsusada Precision Inc., Santa Clara, CA) capable of delivering ±5 kV. Each power supply was equipped with an independent Reed relay (model RR1A07P06, Ross Engineering Corporation, Campbell, CA) that was used to toggle the polarity, ground, and floating states of the power supply. The power supply was computer-controlled with a 4 channel, 12 bit digital-to-analog converter (model CYDDA 04P, CyberResearch Inc., New Haven, CT) with peripheral component interface and software written in Labview (National Instruments, Austin, TX).
Cell migration velocities in the present study were calculated by measuring consecutive cell events observed microscopically and imaged at video frame rates (30 frames/s). The average velocity was based on values obtained from at least five different cell events.
Colorectal Cancer Cell Lysis
gDNA was released from CTCs using a Lyse-and-Go PCR reagent kit (Pierce Biotechnology, IL, U.S.A.). Following manufacturer’s recommendations, 5 μL of Lyse-and-Go PCR reagent was added to the selected CTCs and heated using the following temperature program: 65 °C for 30 s; 8 °C for 30 s; 65 °C for 90 s; 97 °C for 180 s; 8 °C for 60 s; 65 °C for 180 s; 97 °C for 60 s; 65 °C for 60 s. Prior to the addition of the PCR cocktail, the samples were placed at 80 °C.
PCRs, LDRs, Gel Electrophoresis, and Capillary Electrophoresis
PCRs were carried out on selected CTCs using the following gene-specific primer sequences: exon 1 forward—5′ TTA AAA GGT ACT GGT GGA GTA TTT GAT A 3′, (Tm = 55.4 °C) and exon 1 reverse—5′ AAA ATG GTC AGA GAA ACC TTT ATC TGT 3′ (Tm = 56.3 °C). An amount of 45 μL of PCR cocktail consisting of 10 mM Tris–HCl buffer (pH = 8.3) containing 50 mM KCl, 1.5 mM MgCl2, 200 μM dNTPs, and 0.4 μM of each forward and reverse primers was added to the lysate previously held at 80 °C in the thermocycler. After a 2 min initial denaturation, 1.5 U of AmpliTaq DNA polymerase (Applied Biosystems, Foster City, CA, U.S.A.) was added under hot-start conditions, and amplification was achieved by thermally cycling (30 cycles) at 95 °C for 30 s, 60 °C for 2 min, and a final extension at 72 °C for 3 min.
To test the fidelity and yield of the PCR, slab gel electrophoresis was performed. PCR solutions were mixed with 1 μL of a loading dye and 1× TBE buffer. The mixture was then loaded into a well of an ethidium bromide prestained 3% agarose gel (Bio-Rad Laboratories, Hercules, CA). The slab gel electrophoresis was run at 5 V cm−1 for 30 min with images acquired using a Gel Logic 200 visualizer (Carestream Molecular Imaging, New Haven, CT).
LDRs were executed in a total volume of 20 μL in 0.2 mL polypropylene microtubes using a commercial thermal cycling machine (Eppendorf Thermal Cycler, Brinkmann Instrument, Westbury, NY, U.S.A.). The reaction cocktail consisted of 10 mM Tris–HCl (pH = 8.3), 25 mM KCl, 10 mM MgCl2, 0.5 mM NAD+ (nicotinic adenine dinucleotide, a cofactor for the ligase enzyme), 0.01% Triton X-100, 2 μL of 100 nM of the discriminating primer (5′ AAACTTGTGGTAGTTGGAGCTGT 3′, Tm = 71.3 °C), a fluorescently labeled phosphorylated common primer (5′ Phos/TGGCGTAGGCAAGAGTGCCT/Cy5.5Sp 3′, Tm = 63.5 °C), and 2 μL of the PCR product. An amount of 40 U of Taq DNA ligase (New England Biolabs) was added to the cocktail under hot-start conditions, and the reactions were thermally cycled 20 times for 30 s at 94 °C and 2 min at 65 °C. The LDR products were stored at 4 °C. The CGE analysis used a CEQ 8000 genetic analysis system (Beckman Coulter, Fullerton, CA, U.S.A.).
RESULTS AND DISCUSSION
The cell lines used in these proof-of-concept studies included the SW620 cell line, which is derived from a metastatic lymph node but originated from a primary tumor site contained within the colon. The other cell line used in these studies was HT29, which is derived from a metastatic primary human colorectal adenocarcinoma. These two cell lines were employed to evaluate the applicability of the assay for the analysis of CTCs originating from a primary tumor site and those selected from distant metastatic sites, but possessing the same organ-specific primary site. Both cell lines overexpress the EpCAM membrane antigen, but only the SW620 cells harbor KRAS c12.2V oncogene mutations. SW620 and HT29 cells are typically 15–30 μm in diameter (average ≈23 μm),25 and EpCAM occurs at a frequency of 1 × 10⁶ and 5 × 10⁵ molecules per cell, respectively.26 A combined approach of immunoaffinity-based CTC selection and enumeration as well as genotyping of the selected CTCs for the absence/presence of certain mutations can provide significant clinical information to assist in selecting the appropriate treatment regimen for a particular patient with CRC as well as other solid tumors that produce CTCs. In addition, screening of CRC patients for prognostic mutations in gene fragments can detect potential acquired mutations that could indicate the need for treatment modifications. The attractive nature of CTC molecular profiling is that acquisition of the sample (whole blood) is simpler to acquire compared to a tissue biopsy, making frequent screening a viable approach.
In the work presented herein, we focused on (1) the selection and enumeration of low-abundance CTCs isolated from peripheral blood using SW620 and HT29 CTCs as models, (2) release of the CTCs from the selection surface, (3) electrokinetic enrichment of the selected cells, and (4) molecular profiling of the CTCs using a PCR/LDR/electrophoresis assay (see Scheme 1). Release of the cells intact is critical because the enumeration process depends on counting via conductivity whole cells and the molecular profiling is performed on rare cells selected from peripheral blood. As such, the genetic material should not be diluted extensively or mixed with potential interfering materials, which could occur if the cells were damaged prior to the enrichment phase of the assay.
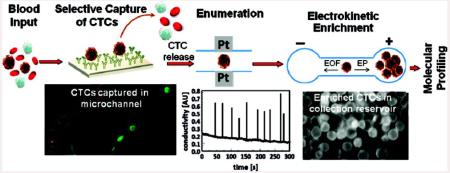
Scheme 1.

Overview for the Cell Selection, Enumeration, Electrokinetic Enrichment, and Molecular Profiling Strategy Adopted for the Analysis of Low-Abundance CTCs Resident in Peripheral Blood
CTC Selection
The specific selection of SW620 or HT29 CTCs was based on the recognition capabilities of anti-EpCAM antibodies that were tethered to the walls of the HTMSU selection bed. The number of interactions between the CTC membrane antigens and the channel wall containing the recognition elements is important in determining the recovery of rare CTCs from blood. Curvilinear-shaped channels were employed to provide a high number of cell/wall interactions to improve recovery.18 As such, the cell-free marginal zone apparent in straight channels was not observed in these curvilinear channels.21 Chang’s model of cell adhesion in flowing systems has been applied in previous reports to describe the encounter rate between the solution-borne cells and the surface-tethered selection elements.27 According to the Chang/Hammer model for cell adhesion, efficient antigen/antibody adhesion is determined primarily by two factors; the encounter rate (ko) and the probability (P) of interaction between the membrane-bound antigen and the channel wall’s tethered antibody.27 The optimum linear velocity for high SW620 and HT29 recovery should be similar (2 mm s−1) as that for the selection of MCF7 CTCs, which has the same mean diameter as SW620 or HT29 CTCs and used EpCAM as the antigen and anti-EpCAM antibodies (KD= 3.3 × 10⁸ M−1)28. Indeed, our data indicated that a linear velocity of 2 mm s−1 produced the maximum recovery of SW620 and HT29 CTCs (data not shown).
The selected cells were observed using fluorescence and brightfield microscopy as shown in Figure 1B. The microscopically observed contact area between the selection surface and the CTC was determined to be 448 ± 18 μm2. The anti-EpCAM antibody density on the selection bed wall has been reported to be 2.3 × 10¹¹ molecules cm−2;21 therefore, 2.4 × 10⁵ EpCAM/anti-EpCAM antibody interactions were involved in one CTC binding event. The CTC recovery was found to be 96% ± 4% at a translational velocity of 2.0 mm s−1 for the SW620 CTCs.
Cell Detachment from the Selection Surface
Enzymatic digestion of the extracellular domain of EpCAM and/or anti-EpCAM antibodies using 0.25% trypsin revealed that the average time for release of the captured SW620 CTCs was ~16 min, which was longer than the values recorded for MCF7 cell release ~7 min).21 This difference could be due to the EpCAM expression level difference between the two cell lines (MCF7 = 5 × 10⁵ and SW620 = 1 × 10⁶ EpCAM molecules per cell).10,29 Due to the higher expression of EpCAM present within the SW620 membrane, higher numbers of EpCAM/anti-EpCAM interactions must be degraded prior to release.
Conductivity Enumeration of the CTCs
The selected and released CTCs were subsequently enumerated using a conductivity sensor described previously.17,18 A typical data stream is shown in Figure 2A. The transducer measured changes in the conductivity of the release buffer with respect to the CTCs present in the buffer as they passed between the two Pt electrodes. Tris–glycine buffer was selected as the major component in the release buffer due to its low conductance, which improved the signal-to-noise ratio (S/N) for the conductivity detection of single CTCs. There were 10 peaks observed in the conductance response shown in Figure 2A that could be assigned to SW620 cells based on an S/N threshold of 3 (99.7% confidence level) giving a recovery of 100% (seed level = 10 CTCs/mL) for this data set. A similar set of experiments was undertaken for HT29 cells and showed similar recoveries as that seen for the SW620 cells.
Figure 2.

(A) Conductometric responses generated for 1.0 mL of whole blood seeded with (a) 10 SW620 CTCs, (b) 32 HT29 CTCs, and (c) 0 CTCs processed using the HTMSU at a linear flow velocity of 2.0 mm s−1. The selected CTCs were released from the capture surface using 0.25% w/v trypsin in Tris–glycine buffer and transported through the conductivity sensor at 1 μL min−1. Conductivity peaks were identified as SW620/HT29 CTCs based on a signal-to-noise ratio of 3 associated with the peak in the data trace. The insets represent a magnified view of sections of the data. The data were smoothed by a Savitsky–Golay 25 point smoothing function. The conductometrically enumerated cells were subjected to PCR followed by LDR analysis. Also shown are CGE analyses of blood samples after processing using the HTMSU and the electromanipulation unit seeded with (B) 0 CTCs, (C) 10 SW620 CTCs, and (D) 50 HT29 CTCs. Peak “a” represents the primer peak, and peak “b” is the 43 nt LDR product. DNA size markers of 20 and 80 nt were coelectrophoresed with the LDR products.
A volume of 1 mL of a blank, which consisted of whole blood seeded with no CTCs, was analyzed by the HTMSU and enumerated via conductivity under the same conditions as described for peripheral blood seeded with CTCs. The resultant trace is shown in Figure 2A. In this case, no single-cell spikes were observed.
Electrokinetic Enrichment of CTCs
In the electromanipulation unit, the total hydrodynamic flow (H) arriving from the inlet a was divided at the T junction into a major flow (Heb) and a minor flow (Hec, see Figure 1A). The ratio between Heb and Hec was equal to 9:1, which was set by the pressure drop ratio (ΔPeb/ΔPec = 0.1) between the two channels. As such, the device was designed to have 10% of the hydrodynamic-driven input entering the CTC collection reservoir, c in Figure 1A, and 90% of the hydrodynamic-driven flow entering reservoir b as seen in Figure 3A-C.
Figure 3.

Micrographs (40×) showing the electromanipulation of SW620 CTCs. The SW620 CTCs were introduced into the system at port a (see Figure 1A). (A–C) The cells were traveling at a hydrodynamic flow rate of 1 μL min−1 in the absence of an electric field. The hydrodynamic flow direction is given by the red arrow. (D–F) SW620 CTC movement in the presence of an electric field (100 V cm−1). The CTC main travel direction is given by the white arrow when in the presence of both the hydrodynamic and electrokinetic flows.
To provide efficient collection and preconcentration of the selected CTCs, an electric field was applied to direct the solution-borne CTCs from the hydrodynamic flow and divert them into the collection reservoir c. As shown in Figure 3D-F, CTCs were electrophoretically diverted from the hydrodynamic flow into reservoir c due to their intrinsic electrophoretic mobility and the applied electric field, which overcame the force exerted on the cell by the pressure-driven flow. The volume of reservoir c was 2 μL providing a 500× enrichment factor for the CTCs (input volume = 1 mL). In addition, reservoir c was free from leukocytes and erythrocytes (see Figure 1C) that were the majority cells in the peripheral blood sample input into the HTMSU.
According to the Smoluchowski equation, the electrophoretic mobility of cells is determined by surface charged groups.30 CTCs possess a net negative surface charge (Q) at pH = 8.3 that can be calculated from
| (1) |
where ρ is the charge density (−5.8 × 10⁻¹⁴ C μm−2)31 and rp is the cell radius (11.5 μm for CTCs). Therefore, the average net surface charge for a typical CTC is approximately −9.6 × 10⁻¹¹ C. Because Q is partially set by protonation/deprotonation of membrane-bound proteins and other groups, the CTCs’ charge can be controlled by altering the properties of the buffer solution (i.e., pH, ionic strength, salt composition). This, along with the size of the CTC and its ζ-potential, will determine its electrophoretic mobility.
The electrophoretic force (FEP) acting on a particle with a net charge Q under the influence of an electric field is given by32
| (2) |
where V is the applied voltage and d is the distance between the cathode and anode. The electrophoretic force acting on the CTC in the present case was calculated to be 9.6 × 10⁻⁷ N.
In this study, we used PBS (50 mM) and Tris–glycine buffer in the cell manipulation studies. It was observed that SW620 cells resident in 50 mM PBS underwent extensive lysis at an electric field strength of 100 V cm−1. However, utilizing a Tris–glycine buffer (0.2 mM Tris/19.2 mM glycine) improved the CTC manipulation because this buffer has been found to increase the target cells’ ζ-potential and, thus, mobility.33 In addition, the buffer capacity must be such to negate possible changes in pH caused by electrolysis at the electrodes and, thus, maintain a constant charge on the cells. The SW620 cells were found not to lyse at fields up to 100 V cm−1 using the Tris–glycine buffer, and the migration velocity was determined to be 130 ± 15 μm s−1. This electric field strength may cause membrane permeation but did not result in cell lysis.34 The cells were found to migrate from the T junction to reservoir c in ~5 min. The use of higher electric fields accelerated the cell migration rate; however, at fields ≥200 V cm−1 extensive cell lysis was observed. We also found that applying an electric field of 100 V cm−1 along with a hydrodynamic flow rate of 1 μL min−1 (linear velocity = 3.3 mm s−1) was sufficient to direct the CTCs into reservoir c with nearly 100% efficiency. Figure 3D-F illustrates two cells moving toward the anode. Above a hydrodynamic flow rate of 1 μL min−1, the CTCs preferentially followed the hydrodynamic flow toward the waste reservoir (reservoir b in Figure 1A).
For an incompressible Newtonian fluid of low Reynolds number, the fluid motion can be determined through the use of the Stoke’s equation. The Stoke’s frictional force on a charged particle is due to the relative motion of the particle with regard to the electro-osmotic flow (EOF) and is given by32
| (3) |
where η is the solution viscosity and is equal to 7.98 × 10⁻⁴ N s m−2 in the current experiments,35 rp is the radius of the CTC, and Uh is the linear velocity of the hydrodynamic flow, Heb = 3.0 × 10⁻³ m s−1. The EOF value for 0.25% w/v trypsin/0.2 mM Tris/19.2 mM glycine buffer was determined to be 3.1 ± 0.23 × 10⁻⁴ cm2 V−1 s−1 at pH = 8.3. Therefore, the linear velocity (UEOF) for the corresponding EOF was 3.1 × 10⁻⁴ m s−1. At pH = 8.3, the PMMA surface consists of negatively charged functional groups producing a cathodic EOF,36 which is in the same direction as the hydrodynamic flow of Uh in the e–b section of the channel. The total Stoke’s force on the SW620 cells at the T junction was therefore calculated to be 5.0 × 10⁻¹⁰ N.
At the T junction, the electrophoretic force (9.6 × 10⁻⁷ N) was larger than the Stoke’s force (5.0 × 10⁻¹⁰ N) acting on the cell. Therefore, CTCs were directed into the collection reservoir c consistent with that observed in our experiments (see Figure 3). In addition, the linear velocity due to the hydrodynamic flow in channel e–c of the electromanipulation unit, Uec, was 3.0 × 10⁻⁴ m s−1, which was 10% of the total hydrodynamic velocity (Uh = 3.0 × 10⁻³ m s−1). It should be noted that this flow is in the opposite direction to that of the EOF in the e–c channel. As such, the hydrodynamic flow was canceled by the EOF. The apparent electrophoretic mobility of the SW620 cells was calculated to be 1.23 × 10⁻⁴ cm2 V−1 s−1. This value was close to the experimental value observed (1.30 ± 0.15 × 10⁻⁴ cm2 V−1 s−1). Chip-to-chip reproducibility of the cell velocities varied slightly; however, the direction of the cell transport was reproducible from chip to chip. For example, in three different PMMA devices, the relative standard deviation (RSD) for the velocities was 10–15%.
PCR/LDR/CGE Analysis of CTCs
Downstream molecular profiling required the analysis of point mutations in gDNA from only a few CTCs, and as such, highly efficient reactions were required on this mass-limited sample. Unfortunately, the presence of trypsin used for cell release could inhibit the enzymatic action of both the Taq polymerase used for PCR and/or the ligase enzyme used for the LDR, thereby lowering the limit of detection of the molecular assay. The cell releasing agent from the selection surface consisted of 0.25% trypsin, which possessed a net positive charge at the pH used for CTC release and electrokinetic manipulation (pI = 10.3).37 Therefore, trypsin migrated almost exclusively toward the cathode, facilitating transfer of trypsin into the waste reservoir b (see Figure 1A). We noticed no degradation in the efficiency of the PCRs and LDRs following selection from blood samples using the HTMSU and subsequent trypsin release indicating efficient removal of trypsin from the enriched CTCs.
A method that can detect single-point mutations in gDNA is the LDR coupled to a PCR (see Scheme 1), and this was used to search for point mutations in the enriched CTCs.23,38 Following PCR amplification of the appropriate gene fragments containing the desired point mutations, the amplicon was mixed with two LDR primers, a common and discriminating primer that flanked the point mutation of interest. The discriminating primer contained a base at its 3′-end coinciding with the single base mutation site. If these bases were not complementary, ligation of the two primers did not occur. A perfect match resulted in a successful ligation event of the two primers and a product length that was the sum of the two oligonucleotide primers.24
In our experiments, enriched CTCs were lysed and the PCR/LDR assay was performed to search for point mutations in codon 12 of the KRAS oncogene (c12.2V). The PCR phase of the assay was first evaluated using different numbers of SW620 cells ranging from 10 to 5000. In these experiments, the cells were added to a PCR tube and lysed, and the PCR reagents added to the tube. As shown in Figure S1A in the Supporting Information, cells ranging from 5000 to as low as 10 were successfully amplified to yield a 300 bp PCR product based on the primers used for the amplification of codon 12 of the SW620 cells.
To demonstrate the capability of our HTMSU with electrokinetic cell enrichment to permit subsequent molecular profiling, 1 mL of whole blood containing low-abundance CTCs was processed. Ten SW620 cells were selected and enriched from 1 mL of whole blood and subjected to PCR yielding the results shown in Figure S1B of the Supporting Information. Successful PCRs on 10 CTCs were confirmed by both the positive (CTCs present) and negative (no CTCs present) control experiments as shown in the Figure S1B, lanes a and c, respectively (see the Supporting Information).
Figure S2 in the Supporting Information shows results for the PCR/LDR analysis of CTCs seeded into whole blood and processed using the HTMSU and electromanipulation unit with CTC counts ranging from 0 to 5000 CTCs. The results indicated the ability to identify point mutations from as few as 10 CTCs seeded into a whole blood sample for SW620 CTCs. HT29 CTCs lack the KRAS c12.2V point mutation, which was confirmed by the absence of the 43 nt LDR product as shown by the CGE results of 50 HT29 cells (see Supporting Information Figure S2).
Three samples, one containing whole blood without CTCs, a second one containing 32 HT29 CTCs, and a third sample containing 10 SW620 CTCs, were processed using the HTMSU and enriched with the electromanipulation unit. The processed samples were then subjected to PCR/LDR/CGE and yielded the results shown in Figure 2B-D. As expected, our results confirmed the presence of no KRAS mutations in whole blood that contained no CTCs (Figure 2B). The sample containing 32 HT29 cells did not show any LDR product as well (Figure 2D) because these cells do not harbor the point mutation being interrogated. Conversely, the results of whole blood that contained 10 SW620 cells produced the desired 43 nt LDR product indicative of a c12.2V point mutation as shown in Figure 2C.
To determine the CTC limit of detection for the molecular assay adopted herein, we calculated the minimum distinguishable analytical signal based on the noise shown in the electropherogram depicted in Figure 2C (peak b). Using this data (peak height), the minimum detectable signal was calculated to be 801 counts/s at the 99.5% confidence level. Using the LDR peak height produced from 10 CTCs, the calculated analytical signal that would be generated for only 1 CTC was determined to be 869 counts/s, which is well above the 99.5% confidence level for the minimum detectable signal noted above. Therefore, our current assay possesses the ability to genetically profile gDNA isolated from a single CTC.
CONCLUSIONS
Previously, we reported with high recoveries the positive selection of MCF7 and LNCaP CTCs spiked into peripheral blood using a polymer-based microfluidic device. Here, we successfully demonstrated the integration of this rare cell selection device with an electromanipulation unit to allow for the ability to search for point mutations in the gDNA of selected CTCs even for cases when the CTC number was low and found to be a significant minority in a mixed population (i.e., whole blood). Therefore, a series of analytical processes were successfully carried out on this mass-limited sample including affinity selection of these low-abundance CTCs, quantification of the selected CTCs via conductivity sensing, and electrophoretic enrichment of the selected CTCs for the subsequent PCR/LDR/CGE interrogation of potential point mutations within their gDNA. We also showed the ability to recover the CTCs with 96% ± 4% efficiency from whole blood and 100% electrokinetic enrichment of the selected CTCs. The strategy ~ developed offered the ability to profile point mutations harbored in rare CTCs in whole blood without interferences from highly abundant leukocytes and/or erythrocytes. In the present example, we successfully genotyped 10 CTCs isolated from whole blood but possess adequate S/N to profile a single CTC. The question becomes, how many CTCs must be genotyped, which will primarily be predicated on the frequency of these cells in patient samples possessing metastatic CRC? Data based on the CellSearch technology indicates the presence of 1–10 CTCs/mL of whole blood for metastatic CRC patients.6 However, recent data from the Toner group at Massachusetts General Hospital, in which a microfluidic chip operated under low-shear conditions and performing a positive selection of EpCAM expressing CTCs (similar to the operational conditions of our microfluidic), have indicated the presence of 42–375 CTCs/mL of whole blood for patients with metastatic CRC.19,20 Indeed, our preliminary data collected in the laboratory of Vogelstein (Johns Hopkins Medical School) found an average CTC frequency of 85 CTCs/mL of whole blood for metastatic CRC patients.
In these studies, we used two different CTC types, HT29 and SW620, which originate from the same primary tumor foci, but SW620 are cells derived from a distant metastatic site. Therefore, we could evaluate the efficacy of this assay for interrogating primary and secondary tumor sites. However, these cell lines contain different genotypes in their KRAS oncogene, which can guide therapy for a particular patient even when sampling secondary metastatic sites.
The entire series of processing steps can be implemented in under 40 min for 1 mL samples, and the processing volume could significantly be increased by increasing the throughput of the fluidic chip through the use of more fluidic vias to potentially increase the number of cells subjected to the molecular analysis. Although we analyzed only a single point mutation as the model for providing a proof-of-concept demonstration of our assay for genotyping CTCs, this technique can be multiplexed through the use of a primary PCR of, for example, the KRAS gene, which contains 19 different point mutations. This would be followed by a multiplexed LDR using different primer pairs that flank the mutational sites being interrogated. The primers for each mutation being interrogated can be designed to contain different numbers of nucleotide bases within these sequence-specific molecules. This will produce LDR products that vary in size for each mutation and, thus, can be sorted by CGE.23,37 In addition, other prognostic genes for CRC can also be interrogated, such as APC and p53 mutations, by using the appropriate primer pairs for both the PCR and LDR phases of the assay.
Finally, moving the PCR/LDR step to a microfluidic chip could reduce processing time, eliminate the potential of contamination when implemented in a centralized laboratory, and provide full process automation. Work is currently underway in our laboratory to realize such a system. Ultimately, evaluation of this assay for uncovering the presence/absence of prognostic mutations in the genome of CTCs isolated from blood samples secured from patients with metastatic CRC is the next step in evaluating the utility of our assay for assisting in the management of CRC-related diseases. We are currently in the process of testing a cohort of CRC patients and healthy blood samples to further evaluate the efficacy of our measurements.
Supplementary Material
ACKNOWLEDGMENT
We thank the National Institutes of Health (National Cancer Institute, R33-CA09924601), the National Science Foundation (EPS-0346411), and the State of Louisiana Board of Regents for support of this work. Partial support of this work was also supplied by the World Class University (WCU) Program of South Korea. We also thank Mr. Jason Guy for preparing the molding tool, Mr. Sital Tiwari from the Center for Advanced Microstructures and Devices at LSU for replicating the microfluidic devices, and Dr. Karen McDonough from the LSU AgCenter for assistance in cell culturing. We also thank Professor Bert Vogelstein for allowing us the opportunity to undertake experiments in his laboratory on evaluating the utility of our CTC microfluidic for selecting CTCs from colorectal cancer patients.
Footnotes
ASSOCIATED CONTENT
Supporting Information. Additional information as noted in text. This material is available free of charge via the Internet at http://pubs.acs.org.
REFERENCES
- (1).Tanaka T, Tanaka M, Tanaka T, Ishigamori R. Int. J. Mol. Sci. 2010;11:3209–3225. doi: 10.3390/ijms11093209. [DOI] [PMC free article] [PubMed] [Google Scholar]
- (2).Mandel JS, Bond JH, Church TR, Snover DC, Bradley GM, Schuman LM, Ederer FN. Engl. J. Med. 1993;328:1365–1371. doi: 10.1056/NEJM199305133281901. [DOI] [PubMed] [Google Scholar]
- (3).Ang C-S, Nice EC. J. Proteome Res. 2010;9:4346–4355. doi: 10.1021/pr100509e. [DOI] [PubMed] [Google Scholar]
- (4).Hardcastle JD, Chamberlain JO, Robinson MH, Moss SM, Amar SS, Balfour TW, James PD, Mangham CM. Lancet. 1996;348:1472–1477. doi: 10.1016/S0140-6736(96)03386-7. [DOI] [PubMed] [Google Scholar]
- (5).Takahashi H, Hosono K, Uchiyama T, Sugiyama M, Sakai E, Endo H, Maeda S, Schaefer KL, Nakagama H, Nakajima A. PPAR Res. 2010;257835 doi: 10.1155/2010/257835. 4 pages. [DOI] [PMC free article] [PubMed] [Google Scholar]
- (6).Allard WJ, Matera J, Miller MC, Repollet M, Connelly MC, Rao C, Tibbe AGJ, Uhr JW, Terstappen LWMM. Clin. Cancer Res. 2004;10:6897–6904. doi: 10.1158/1078-0432.CCR-04-0378. [DOI] [PubMed] [Google Scholar]
- (7).Vidaurreta M, Sastre J, Sanz-Casla Maria T, Maestro Maria L, Rafael S, Diaz-Rubio E. Med. Clin. 2007;129:333–334. doi: 10.1157/13109544. [DOI] [PubMed] [Google Scholar]
- (8).Midgley RS, Kerr DJ. Expert Rev. Anticancer Ther. 2003;3:63–78. doi: 10.1586/14737140.3.1.63. [DOI] [PubMed] [Google Scholar]
- (9).Cristofanilli M, Budd GT, Ellis MJ, Stopeck A, Matera J, Miller MC, Reuben JM, Doyle G, Allard WJ, Terstappen LWMM, Hayes DF. N. Engl. J. Med. 2004;351:781–791. doi: 10.1056/NEJMoa040766. [DOI] [PubMed] [Google Scholar]
- (10).Bouche O, Beretta GD, Alfonso PG, Geissler M. Cancer Treat. Rev. 2010;36:S1–S10. doi: 10.1016/S0305-7372(10)00036-8. [DOI] [PubMed] [Google Scholar]
- (11).Yang M-J, Chiu H-H, Wang H-M, Yen L-C, Tsao D-A, Hsiao C-P, Chen Y-F, Wang J-Y, Lin S-R. Ann. Surg. Oncol. 2010;17:624–633. doi: 10.1245/s10434-009-0831-8. [DOI] [PubMed] [Google Scholar]
- (12).Bilchik AJ, Nora DT, Saha S, Turner R, Wiese D, Kuo C, Ye X, Morton DL, Hoon DSB. Arch. Surg. 2002;137:1377–1384. doi: 10.1001/archsurg.137.12.1377. [DOI] [PubMed] [Google Scholar]
- (13).Sieuwerts AM, Kraan J, Bolt-de Vries J, Spoel P, Mostert B, Martens JWM, Gratama J-W, Sleijfer S, Foekens JA. Breast Cancer Res. Treat. 2009;118:455–468. doi: 10.1007/s10549-008-0290-0. [DOI] [PubMed] [Google Scholar]
- (14).Cohen SJ, Alpaugh RK, Gross S, O’Hara SM, Smirnov DA, Terstappen LWMM, Allard WJ, Bilbee M, Cheng JD, Hoffman JP, Lewis NL, Pellegrino A, Rogatko A, Sigurdson E, Wang H, Watson JC, Weiner LM, Meropol NJ. Clin. Colorectal Cancer. 2006;6:125–132. doi: 10.3816/CCC.2006.n.029. [DOI] [PubMed] [Google Scholar]
- (15).Allan AL, Keeney M. J. Oncol. 2010;2010:426218. doi: 10.1155/2010/426218. [DOI] [PMC free article] [PubMed] [Google Scholar]
- (16).Campos M, Prior C, Warleta F, Zudaire I, Ruiz-Mora J, Catena R, Calvo A, Gaforio JJJ. Histochem. Cytochem. 2008;56:667–675. doi: 10.1369/jhc.2008.951111. [DOI] [PMC free article] [PubMed] [Google Scholar]
- (17).Wlodkowic D, Faley S, Skommer J, McGuinness D, Cooper JM. Anal. Chem. 2009;81:9828–9833. doi: 10.1021/ac902010s. [DOI] [PubMed] [Google Scholar]
- (18).Hou J-M, Greystoke A, Lancashire L, Cummings J, Ward T, Board R, Amir E, Hughes S, Krebs M, Hughes A, Ranson M, Lorigan P, Dive C, Blackhall FH. Am. J. Pathol. 2009;175:808–816. doi: 10.2353/ajpath.2009.090078. [DOI] [PMC free article] [PubMed] [Google Scholar]
- (19).Nagrath S, Sequist LV, Maheswaran S, Bell DW, Irimia D, Ulkus L, Smith MR, Kwak EL, Digumarthy S, Muzikansky A, Ryan P, Balis UJ, Tompkins RG, Haber DA, Toner M. Nature. 2007;450:1235–1239. doi: 10.1038/nature06385. [DOI] [PMC free article] [PubMed] [Google Scholar]
- (20).Stott SL, Hsu C-H, Tsukrov DI, Yu M, Miyamoto DT, Waltman BA, Rothenberg SM, Shah AM, Smas ME, Korir GK, Floyd FP, Jr., Gilman AJ, Lord JB, Winokur D, Springer S, Irimia D, Nagrath S, Sequist LV, Lee RJ, Isselbacher KJ, Maheswaran S, Haber DA, Toner M. Proc. Natl. Acad. Sci. U.S. A. 2010;107:18392–18397. doi: 10.1073/pnas.1012539107. [DOI] [PMC free article] [PubMed] [Google Scholar]
- (21).Adams AA, Okagbare PI, Feng J, Hupert ML, Patterson D, Gottert J, McCarley RL, Nikitopoulos D, Murphy MC, Soper SA. J. Am. Chem. Soc. 2008;130:8633–8641. doi: 10.1021/ja8015022. [DOI] [PMC free article] [PubMed] [Google Scholar]
- (22).Dharmasiri U, Balamurugan S, Adams AA, Okagbare PI, Obubuafo A, Soper SA. Electrophoresis. 2009;30:3289–3300. doi: 10.1002/elps.200900141. [DOI] [PMC free article] [PubMed] [Google Scholar]
- (23).Hashimoto M, Barany F, Soper SA. Biosens. Bioelectron. 2006;21:1915–1923. doi: 10.1016/j.bios.2006.01.014. [DOI] [PubMed] [Google Scholar]
- (24).Khanna M, Cao WG, Zirvi M, Paty P, Barany F. Clin. Biochem. 1999;32:287–290. doi: 10.1016/s0009-9120(99)00020-x. [DOI] [PubMed] [Google Scholar]
- (25).Hosokawa M, Hayata T, Fukuda Y, Arakaki A, Yoshino T, Tanaka T, Matsunaga T. Anal. Chem. 2010;82:6629–6635. doi: 10.1021/ac101222x. [DOI] [PubMed] [Google Scholar]
- (26).Stephan JP, Schanz S, Wong A, Schow P, Wong WLT. Am. J. Pathol. 2002;161:787–797. doi: 10.1016/S0002-9440(10)64238-1. [DOI] [PMC free article] [PubMed] [Google Scholar]
- (27).Chang K-C, Hammer DA. Biophys. J. 1999;76:1280–1292. doi: 10.1016/S0006-3495(99)77291-7. [DOI] [PMC free article] [PubMed] [Google Scholar]
- (28).Willuda J, Honegger A, Waibel R, Schubiger PA, Stahel R, Zangemeister-Wittke U, Pluckthun A. Cancer Res. 1999;59:5758–5767. [PubMed] [Google Scholar]
- (29).Miller MC, Doyle GV, Terstappen LWMM. J. Oncol. 2010;2010:617421. doi: 10.1155/2010/617421. [DOI] [PMC free article] [PubMed] [Google Scholar]
- (30).Mehrishi JN, Bauer J. Electrophoresis. 2002;23:1984–1994. doi: 10.1002/1522-2683(200207)23:13<1984::AID-ELPS1984>3.0.CO;2-U. [DOI] [PubMed] [Google Scholar]
- (31).Lipman KM, Dodelson R, Hays RM. J. Gen. Physiol. 1966;49:501–516. doi: 10.1085/jgp.49.3.501. [DOI] [PMC free article] [PubMed] [Google Scholar]
- (32).Kang Y, Li D. Microfluid. Nanofluid. 2009;6:431–460. [Google Scholar]
- (33).Righetti PG. Electrokinet. Sep. Methods. 1979:389–441. [Google Scholar]
- (34).Li PCH, Harrison DJ. Anal. Chem. 1997;69:1564–1568. doi: 10.1021/ac9606564. [DOI] [PubMed] [Google Scholar]
- (35).Korson L, Drost-Hansen W, Millero FJ. J. Phys. Chem. 1969;73:34–39. [Google Scholar]
- (36).Witek MA, Wei S, Vaidya B, Adams AA, Zhu L, Stryjewski W, McCarley RL, Soper SA. Lab Chip. 2004;4:464–472. doi: 10.1039/b317093d. [DOI] [PubMed] [Google Scholar]
- (37).Novillo C, Castanera P, Ortego F. Insect Biochem. Mol. Biol. 1999;29:177–184. doi: 10.1016/s0965-1748(98)00121-0. [DOI] [PubMed] [Google Scholar]
- (38).Gerry NP, Witowski NE, Day J, Hammer RP, Barany G, Barany FJ. Mol. Biol. 1999;292:251–262. doi: 10.1006/jmbi.1999.3063. [DOI] [PubMed] [Google Scholar]
Associated Data
This section collects any data citations, data availability statements, or supplementary materials included in this article.