

Kv1.2’s gating charge is less than Shaker’s, and the specific contributions of charged S4 residues differ, suggesting that the electric field distribution in the Kv1.2 voltage-sensing domain is different than Shaker’s.
Abstract
Much has been learned about the voltage sensors of ion channels since the x-ray structure of the mammalian voltage-gated potassium channel Kv1.2 was published in 2005. High resolution structural data of a Kv channel enabled the structural interpretation of numerous electrophysiological findings collected in various ion channels, most notably Shaker, and permitted the development of meticulous computational simulations of the activation mechanism. The fundamental premise for the structural interpretation of functional measurements from Shaker is that this channel and Kv1.2 have the same characteristics, such that correlation of data from both channels would be a trivial task. We tested these assumptions by measuring Kv1.2 voltage-dependent gating and charge per channel. We found that the Kv1.2 gating charge is near 10 elementary charges (eo), ∼25% less than the well-established 13–14 eo in Shaker. Next, we neutralized positive residues in the Kv1.2 S4 transmembrane segment to investigate the cause of the reduction of the gating charge and found that, whereas replacing R1 with glutamine decreased voltage sensitivity to ∼50% of the wild-type channel value, mutation of the subsequent arginines had a much smaller effect. These data are in marked contrast to the effects of charge neutralization in Shaker, where removal of the first four basic residues reduces the gating charge by roughly the same amount. In light of these differences, we propose that the voltage-sensing domains (VSDs) of Kv1.2 and Shaker might undergo the same physical movement, but the septum that separates the aqueous crevices in the VSD of Kv1.2 might be thicker than Shaker’s, accounting for the smaller Kv1.2 gating charge.
INTRODUCTION
Shaker voltage-dependent potassium channels were cloned 27 years ago (Papazian et al., 1987; Kamb et al., 1988), and since then, they have been the better-understood potassium channels in regard to gating, permeation, and structure. Several paradigmatic gating models have been fine-tuned using Shaker-derived data (Zagotta et al., 1994a; Ledwell and Aldrich, 1999), and the best-constrained models of gating have been developed to account for Shaker channel behavior (Schoppa and Sigworth, 1998b). Mutagenesis has provided a wealth of structural–functional information, and the mechanism of voltage sensing in voltage-dependent channels has been revealed mostly by studies performed in Shaker (Sigworth, 1994; Yellen, 2002; Swartz, 2008).
The current consensus regarding the functioning of the voltage sensor in Shaker is that the transmembrane domains S1–S4 function as a portable voltage-sensing module (Alabi et al., 2007). Six positively charged residues in the S4 segment interact with the membrane electric field and move outward in response to positive voltages (Mannuzzu et al., 1996; Cha and Bezanilla, 1997). Although the magnitude of this movement is somewhat controversial, it is well established that the total gating charge is 12–14 elementary charges (eo) (Schoppa et al., 1992; Aggarwal and MacKinnon, 1996; Noceti et al., 1996; Islas and Sigworth, 1999). The first charged residue, R1, appears to contribute ∼28% of the gating charge, and R2, R3, R4, and K5 contribute 35, 26, 28, and 15%, respectively (Aggarwal and MacKinnon, 1996; Seoh et al., 1996). That is, the first four positive residues contribute about the same amount of charge. The large magnitude of charge movement has been explained by the existence of aqueous cavities that sharply focus the electric field near the center of the voltage-sensing domain (VSD) (Islas and Sigworth, 2001; Asamoah et al., 2003 ; Ahern and Horn, 2005) and across which the S4 charges move in sequence (Tao et al., 2010).
A wonderful breakthrough in our understanding of voltage gating came in the form of the x-ray structures of the Kv1.2 channel, a mammalian orthologue of Shaker (Long et al., 2005) and the paddle chimera between Kv1.2 and the S3b–S4 of Kv2.1 (Long et al., 2007). These structures most likely represent an active/relaxed (Villalba-Galea et al., 2008) conformation of both the VSD and the pore domain and are the basis for models of the hypothetical resting state of the channels. These refined models of closed and open conformations have been used in molecular dynamics (MD) simulations of the voltage-driven conformational changes that activate the channel (Khalili-Araghi et al., 2010; Delemotte et al., 2011; Jensen et al., 2012; Vargas et al., 2012). An important caveat is that all of the functional data that has been used to construct and validate these model structures and the subsequent simulations have been derived from experiments performed in Shaker (Lainé et al., 2004; Campos et al., 2007; Lin et al., 2011).
Although the degree of homology between Shaker and Kv1.2 is high, especially in the VSD (66% identical), there is no a priori reason to think that these two channels should be functionally equal. After all, they have evolved to perform distinct functions at specific physiological conditions in two very different kinds of organisms.
The use of data derived from Shaker to validate structures obtained from Kv1.2 makes the assumption that basic biophysical properties between these two channels are the same and that mutagenesis of equivalent amino acid residues should produce the same structural perturbations and functional effects. These assumptions need to be experimentally tested. In this work, we set out to explore the basic voltage-dependent behavior of heterologously expressed homomeric Kv1.2 channels to contrast these characteristics with those of Shaker. Our results point to several important basic differences that need to be taken into account in further structure–function comparisons between the two channels.
MATERIALS AND METHODS
Molecular biology and heterologous expression
The WT Kv1.2 and Shaker 29-4 (N-type inactivation removed) channels were provided by B. Roux (University of Chicago, Chicago, IL) and F. Sigworth (Yale University, New Haven, CT), respectively.
Point mutations in Kv1.2 S4 were constructed in a single PCR reaction using mutagenic oligonucleotides, the KOD Hot Start DNA Polymerase (EMD Millipore), and the Kv1.2-pMAX plasmid as a template. Only mutants R294Q, R297Q, R300N, and R303Q produced detectable currents when expressed in Xenopus laevis oocytes. Shaker in the pGEMA plasmid and Kv1.2 constructs were linearized using NotI and PacI, respectively. The digested plasmids were transcribed with the T7 mMESSAGE mMACHINE kit (Ambion), and the resulting mRNAs were resuspended in nuclease-free water at a concentration of 0.5–1 mg/ml.
A piece of ovary was surgically removed from tricaine-anesthetized Xenopus females and mechanically ruptured into small sections. Ovary segments were treated with 1.2 mg/ml type I collagenase (Sigma-Aldrich) in OR2 solution for 30 min, and stage V–VI oocytes were selected and stored in ND96 solution hereafter. Healthy oocytes were injected with 50 ng mRNA 5–24 h after harvesting, and recordings were performed 1–3 d after injection.
Electrophysiology and data analysis
The composition of all the solutions listed in this section is given in millimolar quantities. The pipette solution for ionic current recordings, unless otherwise stated, was composed of 130 KCl, 3 HEPES, and 1.8 CaCl2, pH 7.4 (KOH), and the bath solution contained 130 KCl, 3 HEPES, and 1 EDTA, pH 7.4 (KOH). Gating currents were recorded in the absence of permeant ions using the following solutions: 130 NMDG-Asp, 10 HEPES, 5 NaCl, and 2.5 CaCl2, pH 7.4 (NMDG), in the pipette solution, and 130 NMDG-Asp, 10 HEPES, 5 NaCl, and 2.5 EDTA, pH 7.4 (NMDG), in the bath solution. Charge-per-channel experiments were made using symmetrical Cs+ solutions, which contained 120 CsCl, 10 HEPES, and 1.5 EDTA, pH 7.4 (NMDG), in the bath, and 120 CsCl, 10 HEPES, and 1.5 CaCl2, pH 7.4 (NMDG), in the pipette.
All recordings were performed at room temperature (22°C) using an Axopatch 200B amplifier (Molecular Devices) and acquired with Pulse and Patchmaster software (HEKA). Patch pipettes were pulled from borosilicate glass, fire-polished to a resistance of 0.5–1 MΩ, and covered in dental wax to reduce linear capacitive currents.
Macroscopic currents were low-pass filtered at 5 kHz and sampled at 15 kHz. For macroscopic current recordings, the following voltage protocol was used: patches were held at −90 mV, and voltage was stepped from −70 to 90 mV in 10-mV increments for 100 ms before being changed back to −90 mV for 100 ms. All macroscopic current recordings are the average of 10 current traces to reduce noise. For leak subtraction, a −P/5 protocol was applied from a leak holding potential of −120 mV.
The first 100 µs of the tail current were averaged and divided by the largest tail current value in the set of traces to yield a normalized current that is directly proportional to the open probability, Po. The voltage dependence of the normalized tail currents was fitted to a fourth-power Boltzmann function:
| (1) |
Here, qapp is the apparent gating charge of one subunit in the tetramer, and V′ is a value related to the V1/2 of the Po(V) function by:
T and kB have their usual meanings. The time constant of channel activation, τon, was estimated by fitting a single exponential to the late phase of ionic currents activated by depolarization, and the activation delay, d, was determined to be the point where the exponential fit intersects the time axis using the equation:
| (2) |
Channel closure kinetics were measured using a tail current protocol in which the voltage was held at −120 mV for 100 ms, and then stepped to 60 mV for 100 ms to activate all channels, and followed by pulses starting from −150 to 0 mV in 10-mV steps for 100 ms. Tail currents were fit with a single-exponential function to obtain the time constant associated with the deactivation event.
The voltage dependence of all time constants τi(V) was fit to the equation:
| (3) |
Here, τi(0) is the value of the time constant at zero mV, and qi is the partial charge associated with the time constant.
For nonstationary noise analysis, 50–300 depolarizing pulses to 100 mV were delivered from a holding potential of −90 mV, then returned to −90 mV. The variance σ2 was calculated from these at each point in time, using the method of pairwise sweep subtraction to reduce the influence of any channel rundown (Heinemann and Conti, 1992). To estimate the number of channels, N and the amplitude of the single-channel current, i, variance was plotted against the mean current 〈I〉 and fitted with the equation (Sigworth, 1980):
| (4) |
For gating current recordings, patches were depolarized in 10-mV steps up to 40 mV from a −90-mV holding potential for 50 ms, and then returned to −90 mV. Currents were filtered at 10 kHz and sampled at 50 kHz, and a −P/5 protocol from a holding potential of −140 mV was applied to subtract linear current components. On-gating currents were integrated to obtain the charge moved at every voltage.
Estimation of the apparent gating charge was done through the limiting slope method as implemented in Islas and Sigworth (1999). These experiments were performed using the same set of solutions as the macroscopic current recordings: low-pass filtered at 2 kHz and sampled at 10 kHz. The holding potential was set to −100 mV for 100 ms, and then the patch was depolarized for 700 ms in 5- or 10-mV steps from the most positive potential at which individual channel openings could be clearly observed (usually −60 mV) down to −90 mV. The patch was stepped down to the holding potential for 100 ms after each test pulse. Leak and capacitive currents were subtracted using an average of null sweeps. 100–1,000 current traces at each potential were idealized using the half-amplitude threshold crossing method (Colquhoun and Sigworth, 1995). These idealized records were then averaged to obtain the ensemble time course of the product of the number of channels times the open probability (NPo). Po was obtained from these ensembles by dividing the steady-state value of NPo by the number of channels estimated from noise analysis.
The apparent charge, Qapp, was estimated from the slope of the Po(V) relationship according to:
| (5) |
or from a fit of Po plotted against voltage to the equation:
| (6) |
In these equations, A is a scaling factor, and kB and T have their usual meanings.
Charge per channel was determined as in Noceti et al. (1996). After removal of the vitelline membrane, oocytes were soaked in Cs+-containing solution for ∼30 min to allow exchange of the internal solution. After this time period, the reversal potential of Cs+ currents was within ±3 mV of 0. A pulse to a voltage near 0 mV (the Cs+ reversal potential in these experiments) was delivered to the patch to elicit a gating current trace free of ionic current from which the maximum charge was calculated. After the reversal potential pulse, voltage was stepped to −90 mV to elicit a Cs+ tail current. The variance of these Cs+ currents was calculated from ∼300 pulses and used to estimate the number of channels as described above, using a pairwise subtraction algorithm. The maximum charge displaced by the activation of a single channel was determined from the relationship between the on-charge and the number of channels from several patches.
Voltage ramps were used to estimate the limiting slope and the apparent gating charge contribution of each charged residue in S4. Patches were depolarized with a 5-s ramp spanning the range of −100 to 50 mV. The resulting current was converted to conductance according to G(V) = I/(V − Vrev) and normalized to the steady-state value. An exponential function,
| (7) |
was fitted to the 10−2–10−3 range of normalized conductance to yield a lower bound estimate of the voltage dependence.
Data analysis and model fitting were performed using custom scripts written in Igor Pro 6 (WaveMetrics).
Sequence alignment and structural model building
Shaker and Kv1.2 amino acid sequences were aligned using AlignX in the Vector NTI software package (Invitrogen). The structural model of Shaker was constructed using the I-TASER protein structure prediction server, with the Kv1.2 open state model of Khalili-Araghi et al. (2010) as a template.
RESULTS
Macroscopic properties of Kv1.2
All of our patch-clamp recordings of ionic and gating currents were performed in the cell-attached configuration to maximize patch stability and avoid voltage shifts that have been reported to be present in Kv1.2 channels when recorded in excised-patch configurations (Rezazadeh et al., 2007; Schmidt et al., 2012). Nevertheless, we observed some variability in channel behavior. Most currents behaved as those ionic potassium (K+) currents depicted in Fig. 1 A. Large amplitude currents could be routinely measured, with activation that speeded up with depolarizing voltages, as has been reported for other voltage-gated K+ ion channels and previously for Kv1.2 (Scholle et al., 2004). Occasionally, faster onset currents could be recorded, which also activated over a more negative voltage range (not depicted). These less common currents are related to the more typical ones shown in Fig. 1 by an approximate −15-mV voltage shift, both in kinetics and steady-state properties. This observation is similar to what has been shown to occur to Kv1.2 in mammalian cell expression systems (Rezazadeh et al., 2007) and to the Kv1.2–Kv2.1 paddle chimera (Schmidt et al., 2012), where fast and slow populations of channels can be distinguished. In our recording conditions (symmetric K+), the I-V curve shows a negative slope region, indicative of voltage-dependent activation (Fig. 1 B). The voltage dependence of activation was estimated from the amplitude of tail currents at the end of a depolarizing pulse. The normalized magnitude of the tail current is shown in Fig. 1 C, along with a fit to a fourth-power Boltzmann function, with an apparent gating charge per subunit of 2.7 eo.
Figure 1.

Kinetic and steady-state properties of Kv1.2 potassium currents. (A) Family of representative K+ current traces activated by voltage steps from −70 to 30 mV in 10-mV increments from a holding potential of −90 mV. (B) I-V relationship of the data shown in A. (C) Voltage dependence of the channel activation. The magnitude of tail currents was normalized to the maximum value. Open probability obtained from noise analysis of macroscopic currents at 50 mV was 0.8. The red curve is the fit to a Boltzmann function to the fourth power (Eq. 1), with parameters V′ = −45 mV and qapp = 2.7 eo. (D) Current activation time courses (black traces) showing marked sigmoidal activation. The red curves are fits to Eq. 2. The time–axis intersect is the delay. (E) Activation time constant, τon, from fits as in D (triangles), activation delay (rhombuses), and deactivation, τoff, (inverted triangles). The red lines are exponential fits to Eq. 3. The partial charges associated with each time constant are: qact = 0.25 eo, qdelay = 0.45 eo, and qdeact = 0.72 eo. (F) Cole–Moore shift experiment showing the reduction of delay as the prepulse potential is made more positive. The inset shows the value of the delay determined as in D as a function of the prepulse potential. Error bars are the SEM.
Nonstationary noise analysis of macroscopic ionic currents revealed that the channels reached a maximum open probability of 0.8 and had a single-channel current of 0.7 pA at 40 mV, almost the same as Shaker (Heginbotham and MacKinnon, 1993).
Activation kinetics showed marked deviation from a single-exponential time course (Fig. 1 D). We characterized activation with two parameters: the time constant of an exponential fit to the second half of the time course of current activation and a delay, which was measured by extrapolating the exponential fit to zero current (Schoppa and Sigworth, 1998a). Both the time course of the exponential fit and the delay are voltage dependent (partial charges of 0.25 and 0.45 eo, respectively). Deactivation kinetics, measured from inward tail currents, also behaved as in other Kv channels, and deactivation could be accounted for by a single-exponential relaxation, whose time constant decreased exponentially with hyperpolarization (qdeact = 0.72 eo; Fig. 1 E).
The sigmoidal time course suggests that Kv1.2 channels also transit through many closed states before reaching the open state. A Cole–Moore-type experiment reveals that the delay is voltage dependent, becoming shorter as the prepulse voltage is made more positive (Fig. 1 F). This result confirms that the channel has to move through several closed states before opening.
Gating currents
We recorded voltage-dependent charge movement from cell-attached patches in the absence of permeant ions. Gating currents could be observed in patches from oocytes with very high expression levels and were apparent at voltages more negative than those that induce significant channel opening, as expected for a channel where charge movement is coupled to channel opening (Fig. 2 A). The charge obtained from integration of currents during depolarization (on-gating currents) was discernible at voltages as negative as −80 mV and became saturated at voltages positive to −10 mV. The Q(V) relationship could be fit by a sum of two Boltzmann equations (Fig. 2 B). The voltage dependence of charge movement is reminiscent of that in Shaker (Zagotta et al., 1994b; Schoppa and Sigworth, 1998a).
Figure 2.

Gating currents and charge movement. (A) Gating current traces recorded from a cell-attached patch. Traces shown correspond to −80, −60, −40, −20, 0, and 20 mV from a holding potential of −90 mV. (B) Voltage dependence of the normalized charge movement from five different patches. Charge was determined from the time integral of traces as in A. The red curve is a fit of a sum of two Boltzmann functions with charges q1 = 0.3 eo, q2 = 3 eo, and V11/2 = −70 mV, V21/2 = −37 mV. Error bars are the SEM. (C) Time constant of current decay τon determined from an exponential fit to the gating current decay; n = 5 patches. The red line is the average fit of Eq. 3 to all five patches; the partial charge is qon = 0.54 eo. (D) Time constant of the off-gating current decay determined from an exponential fit. Note that the time constant becomes very slow and voltage independent at voltages more positive than 40 mV, which corresponds to the range of channel opening.
At negative voltages, on-gating currents are rapid, become slower at intermediate voltages, and turn faster again at more depolarized potentials. We quantified gating current kinetics by fitting a single exponential to the decay phase of the transient current. The decay is exponentially dependent on voltage with an average associated charge qon = 0.54 eo (Fig. 2 C). Charge return during repolarization (off-gating currents) is initially also rapid but becomes significantly slowed down in the range of voltages where channels begin to open (Fig. 2 D). It is noteworthy that the kinetics of charge movement in Kv1.2 is about threefold slower than that of Shaker, and the voltage dependence is slightly higher (qonKv1.2 = 0.54 eo and qonShaker = 0.39–0.45 eo; Zagotta et al., 1994b; Schoppa and Sigworth, 1998a; Islas and Sigworth, 1999).
Limiting slope measurements of the voltage sensitivity
For a voltage-gated ion channel that is activated by depolarization, an estimate of the gating charge can be obtained from the logarithmic voltage sensitivity or limiting slope of the open probability measured at hyperpolarized voltages (Almers, 1978), although this only measures the charge coupled to opening. We performed the measurement of open probability to the lowest possible values in our experimental conditions, according to methods described previously (Hirschberg et al., 1995; Islas and Sigworth, 1999; González-Pérez et al., 2010). Fig. 3 A shows ensemble averages from idealized channel records at four negative voltages. It can be seen from these that channel opening is steeply voltage dependent when the open probability is very low. Fig. 3 B shows the voltage dependence of the steady-state value of these ensembles normalized to the number of channels present in each patch for several experiments.
Figure 3.

Limiting slope measurements of the apparent gating charge on Kv1.2. (A) Ensemble averages from a representative patch. Between 100 and 500 idealized sweeps were averaged to produce the ensembles at each voltage. (B) Measurements of the open probability of Kv1.2 channels were performed down to values between 10−7 and 10−6. Shown are the data from six patches where the maximal open probability and channel number were measured. The apparent charge was estimated from a fit to Eq. 6 to the data between 10−7 and 10−3. The dotted lines are the Po for a Boltzmann function elevated to the fourth power with a total charge of 10 eo (red curve), and for Scheme 1 (blue curve). The prediction from the allosteric model (Scheme 2) is shown by the lime-colored line. Both schemes have a total charge of 10 eo. The inset shows the median (9.65 eo) and the 25th and 75th percentiles (box) and the 90th and 10th percentiles (whiskers). The mean and SEM are 9.57 ± 0.24 eo. (C) The slope from the data in B is plotted as a function of Po according to Eq. 5. The data show that the limiting slope is approached at values <10−3. The curves are model predictions as in A and have the same color coding.
We were surprised by these measurements of the limiting slope of Kv1.2 channels, as they indicate that the voltage dependence of opening at values of Po between 10−4 and 10−7 is consistent with a gating charge of 9.6 ± 0.25 eo, a value well below the expected 13–14 eo measured previously in Shaker channels (Schoppa et al., 1992; Aggarwal and MacKinnon, 1996; Noceti et al., 1996; Seoh et al., 1996; Islas and Sigworth, 1999) and which is generally assumed to be the same for Kv1.2. When the Po(V) data are transformed according to Eq. 5, it can be seen that the apparent charge approaches a limiting value of 10 eo and that the data between Po values of 10−4–10−7 is very close to this limiting value (Fig. 3 C).
Several explanations are possible for the apparent reduced voltage dependence of Kv1.2 channels. Limiting slope measurements are approximate and give the gating charge only if channel opening is strictly coupled to charge movement (Sigg and Bezanilla, 1997; Islas and Sigworth, 1999). Although the gating current and macroscopic ionic current behaviors of the channel are consistent with a sequential mechanism and strict coupling of charge movement to channel opening, we decided to carry out a direct measurement of the gating charge per channel by comparing charge movement and channel number in the same patch.
Direct gating charge determination
We simultaneously measured gating and ionic tail currents in cell-attached patches in solutions where Cs+ is the only permeant ion (Noceti et al., 1996). Potassium channels generally have a single-channel conductance for Cs+ that is at least an order of magnitude smaller than that of K+ (Heginbotham and MacKinnon, 1993), and it seems that Kv1.2 is not an exception. The reduced magnitude of macroscopic Cs+ currents allows for precise determination of the reversal potential, at which the gating current is clearly resolved without ionic current contamination. Noise analysis of the tail current was used to determine the number of channels in the patch. The reversal potential of each patch was within ± 3 mV of 0 mV, the expected reversal potential for Cs+. It should be noted that charge movement is already saturated at approximately −10 mV (Fig. 2 B), which means that at 0 mV we measured all the charge available.
Fig. 4 shows the data from a representative patch. Gating and tail currents can be recorded in a single sweep and at the same gain (Fig. 4 A). The number of channels in the patch was estimated from variance analysis of the inward Cs+ tail current (Fig. 4 C). The single-channel Cs+ current at −90 mV was −0.02 pA, which can be compared with −1.8 pA measured in K+ solutions to give a permeability ratio PCs/PK of ∼0.01. This value is the same as has been measured for Shaker and other potassium channels (Heginbotham and MacKinnon, 1993; Pérez-Cornejo and Begenisich, 1994). The circles in Fig. 5 show the correlation of charge and channel number for 10 patches obtained from several oocytes. The straight line is a linear fit with a slope of 9.96 eo/channel and is entirely in agreement with the limiting slope value. As a control for internal consistency in our experiments, we repeated these measurements in Shaker under the same conditions. The linear fit to the Shaker data gives a slope of 13.3 eo/channel, which is in accord with previous estimates (Schoppa et al., 1992; Aggarwal and MacKinnon, 1996; Noceti et al., 1996; Seoh et al., 1996; Islas and Sigworth, 1999). The ratios of the charge to channel number (Q/N) are shown if Fig. 5 B, indicating that Kv1.2 has ∼30% less gating charge than Shaker.
Figure 4.

Simultaneous measurements of the gating currents and channel number. (A) Representative experiment showing simultaneous measurement of outward gating current and inward Cs+ current. The reversal potential was near zero (+1.5 mV). (B) Gating current (back trace) and its integral (red). (C) Noise analysis of the inward Cs+ current. The variance versus mean relationship was fit to Eq. 4 to obtain the number of channels and the amplitude of the single-channel current at −90 mV, which in this patch are 145,070 and −0.023 pA, respectively.
Figure 5.

Estimation of the charge per channel in Kv1.2 and Shaker channels. (A) The relationship between channel number and charge movement for both channels is linear. Estimation of the gating charge per channel is obtained from a linear fit to the data for each channel type (red line). Shaker patches, 13.3 eo, n = 9, and correlation coefficient (r) = 0.990. Kv1.2 patches, 9.96 eo, n = 10, and (r) = 0.988. (B) Bar plot of the quotient of total charge and number of channels (Q/N) for Shaker and Kv1.2. Values are the mean, and error bars are the SEM for the same data in A. The asterisks indicate that the two datasets are different with a P < 0.01 level (Student’s t test).
Kinetic model of Kv1.2 gating
The data presented above indicate that macroscopic gating properties of Kv1.2 are similar to those of Shaker channels. We decided to explore if kinetic models previously developed to account for Shaker channel gating data can be applied to explain gating in Kv1.2. There are a handful of available successful models that vary in their degree of detail and experimental constraints (Zagotta et al., 1994a; Schoppa and Sigworth, 1998b; Ledwell and Aldrich, 1999). All of them share a basic architecture. Upon depolarization, four VSDs undergo two to three independent transitions, which are mainly responsible for the observed charge movement. Once all of the VSDs reach an activated conformation, one or two more transitions, which move less charge and are produced by a concerted conformational change in all subunits, lead to the final pore opening. Our model is represented in Scheme 1 and is very similar to that presented by Ledwell and Aldrich (1999) to account for the behavior of WT Shaker and the ILT mutant, with a total of 16 closed states and a single open state.
The rate constants kij for a transition from state i to j, represented by an arrow, have the form:
where kij(0) is the value of the rate constant at 0 mV, and qij is the partial charge associated with the transition. The values of the parameters for each rate constant are listed in Table 1.
Table 1.
Parameters of Scheme 1
| Rate constant (at 0 mV) | Value (at 0 mV) | Partial charge | Equilibrium constant | Value (at 0 mV) |
| s−1 | s−1 | eo | ||
| k1 | 520 | 0.4 | K1 | 0.5 |
| k−1 | 1,000 | −0.6 | ||
| k2 | 1,900 | 0.8 | K2 | 31.66 |
| k−2 | 60 | −0.7 | ||
| ka | 950 | 0.2 | KA | 9.5 |
| k−a | 100 | −0.6 | ||
| ko | 1,000 | 0.05 | Ko | 2.85 |
| kc | 350 | 0.2 |
Fig. 6 shows that the model accounts well for the macroscopic time course of the open probability, the time course of on- and off-gating currents; the equilibrium behavior of charge movement, Q(V), and channel opening; Po(V); and the kinetics of on-gating currents.
Figure 6.

A kinetic model for Kv1.2 channels. (A) Current traces, I, from a representative patch were converted to Po according to: Po = I/iN. The number of channels, N, in the patch was estimated from noise analysis. Black traces are the experimental data and the red curves are the best estimate from Scheme 1. (B) The same parameters of the model were used to fit gating current traces from a separate experiment. The red curves superimposed on the black traces are the fit from the model. (C) The same parameters also describe the steady-state voltage dependence of charge movement and open probability and the kinetics of on-gating currents. (D) The parameters used are given in Table 1.
This result suggests that although the gating charge in Kv1.2 is ∼30% smaller than in Shaker, the gating mechanism in conserved; that is, both channels possess a VSD that undergoes conformational changes that are strictly coupled to pore opening.
Properties of S4-neutralized mutants
We have shown that the gating mechanism of Kv1.2 potassium channels is very similar to Shaker channels. However, there is a very important difference in that the gating charge is significantly reduced. Why is this important? As we will touch upon in the Discussion, the free energy associated with the conformational changes leading to channel opening is related to the magnitude of the gating charge.
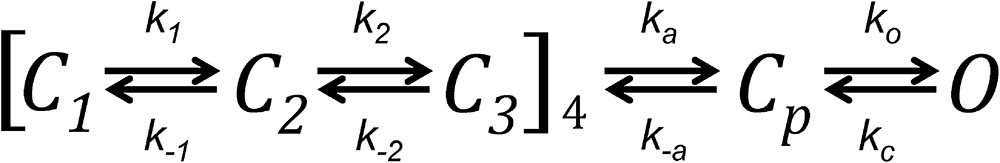 |
(Scheme 1) |
Also, the magnitude of the gating charge of Shaker has been used as a constraint in MD simulations that make use of models based on the structure of Kv1.2 (Khalili-Araghi et al., 2010; Delemotte et al., 2011; Jensen et al., 2012).
There are several scenarios that can explain the reduced gating charge in Kv1.2. The magnitude of the physical displacement of the S4 charges could be smaller, the distribution of the electric field across the VSD could be different between the two channels, and finally, individual S4 charges could make very different individual contributions to overall charge movement.
We decided to explore the last possibility by neutralizing each residue in S4 and measuring the apparent gating charge of each mutant through the limiting slope method. R1, R2, and R4 were mutated to glutamine, whereas R3 was swapped with asparagine. Although we constructed several K5 and R6 mutants, we could not detect currents when expressing any of them.
Charge-neutralized mutants R1Q (R294Q), R2Q (R297Q), R3N (R300N), and R4Q (R303Q) produced detectable voltage-activated currents, although their magnitude is vastly reduced with respect to WT channels (Fig. 7). The R1Q and R2Q mutants have a phenotype that makes experiments difficult, as even in cell-attached patch experiments, the steady-state voltage dependence shifts to more negative voltages with a fast time course. This effect is very pronounced in R2Q, where the magnitude of inward currents at negative voltages—which is proportional to the negative shift of the G(V) curve—increases severalfold with a time constant of 4.4 min (Fig. 8). For this reason, we could not reliably estimate the gating charge of Kv1.2-R2Q from careful limiting slope experiments as in WT Kv1.2, and we resorted to measuring the voltage-dependent conductance from currents elicited by slow (10-mV/s) voltage ramps.
Figure 7.

Neutralization of positive charges in S4 alters the voltage dependence of mutant Kv1.2 channels. (A) Representative current families recorded from cell-attached patches from oocytes expressing mutants R1Q (R294Q; red), R2Q (R297Q; yellow), R3N (R300N; green), and R4Q (R303Q; blue). (B) Voltage dependence of the normalized amplitude of tail currents for all four mutants. Curves are fits to Eq. 1. Color coding is the same as in A. Error bars are the SEM.
Figure 8.

Nonstationary behavior of the R2Q mutant. (A) The voltage dependence of the tail current amplitude of R2Q shifts with time. Representative data from a cell-attached patch immediately after seal formation (circles), after 1 min (squares), and after 25 min (triangles). The curves are fits to a simple Boltzmann function with steepness and V1/2: 2.95 eo, −36.1 mV (circles); 3.74 eo, −42.4 mV (squares); 5.26 eo, −61.8 mV (triangles). (B) Amplitude of the inward current at −50 mV increases as a function of time. Traces were taken at 5, 7, 10, 15, and 25 min after seal formation. (C) The current value at the end of the pulse was plotted as a function of time. The fitting curve is an exponential with a time constant of 4.4 min.
All four mutants have reduced voltage sensitivity, as judged from the apparent gating charge obtained by fitting Eq. 7 to the voltage-dependent conductance measured from voltage ramp experiments. It should be noted that this charge value is underestimated, because the apparent charge obtained for the WT channel under the same experimental conditions is only 6.7 eo (Fig. 9 B). The effect of the R1Q mutation is dramatic, with an apparent charge of only 3.4 eo (Fig. 9 B). This corresponds to a 50% reduction in the gating charge when compared with 6.7 eo for WT. For this mutant, we also measured the limiting slope in a few patches, and the gating charge from the slope is 5.6 eo, which gives a reduction of 46% when compared with the limiting slope charge of 9.6 eo for the WT.
Figure 9.

Limiting slope estimates of the contribution of S4 charges to the gating charge. Limiting slopes of WT Kv1.2 and the mutants R1Q, R1Q, R3N, and R4Q were measured from the normalized conductance obtained from slow voltage ramps. (A) Data for all four mutants. The color traces are the normalized conductance–voltage relationships of the mutants, and the black trace is the WT. The gray line is a fit to Eq. 7. (B) The average apparent charge obtained from data as in A, with the number of patches analyzed indicated in parentheses. Also included are data for limiting slope experiments for WT, R1Q, and R3N, for completeness. The error bars are the SEM. (C) The average fraction of WT charge for each neutralization, obtained from the voltage ramp data. The values are: 0.51, 0.83, 0.82, and 0.86 for R1Q, R2Q, R3N, and R4Q, respectively.
The R2Q apparent charge also measured from voltage ramps is 5.56 ± 0.14 eo. The effect of neutralizing R2 on the overall gating charge does not appear to be as large as in the R1Q channel, as this mutation causes the loss of ∼17% of the gating charge when compared with the WT value (Fig. 9 B).
R3Q mutant channels express very poorly (Fig. 7 A), with macroscopic ionic currents being <100 pA in amplitude at positive voltages. The charge estimated from the G(V) curves obtained from voltage ramps is 5.5 eo, which corresponds to a contribution to the gating charge of 18%. Limiting slope measurements could be performed for R3N only to a Po of ∼5 × 10⁻⁵, yielding a value of Qapp = 7.35 ± 0.15 eo.
Finally, mutant R4Q has a Qapp = 5.61 ± 0.19 eo, also estimated from voltage ramps. The contribution of each charge to the total gating charge was calculated as a ratio of the Qapp estimates of each mutant to the Qapp from voltage ramps of WT channels (Fig. 9 C). These experiments indicate that positive charges in S4 contribute to the gating charge of Kv1.2 channels in a manner that is similar to experiments in Shaker (Aggarwal and MacKinnon, 1996; Seoh et al., 1996), but with different relative contributions of each positive residue in S4, especially for R1.
DISCUSSION
We have assessed, with a certain degree of detail, the voltage-dependent gating characteristics of Kv1.2 potassium channels. In many aspects, these proteins are very similar to the better understood and amply studied Shaker channels. Gating charge movement precedes pore opening and is almost entirely distributed among a large number of closed states. The opening transition seems to be different and, like in Shaker, carries less charge and is consistent with a concerted allosteric conformation change. The kinetics of opening are slightly slower than in Shaker.
On the other hand, the gating charge of Kv1.2 is reduced and significantly different from the gating charge of Shaker. We have established this with two different lines of evidence. First, the limiting slope measured at very low open probabilities yields a charge of 9.6 ± 0.25 eo. Second, direct measurement of charge movement and the number of channels in the same patch also yields a charge near 10 eo.
In retrospect, it can be argued that the reduced charge movement in Kv1.2 is entirely consistent with its physiological function. It is known (Adrian, 1975) that channels that shape the action potential waveform are more efficient at sustaining a high speed of propagation of action potentials if they have moderate amounts of gating charge, because their contribution to cell capacitance is smaller. Kv1.2 subunits are found in many neurons where they assemble as a homotetramer or as part of tetramers with Kv1.1 (Dodson et al., 2002), giving rise to sustained delayed-rectifier potassium currents that activate at relatively negative potentials. These currents play a role in action potential repolarization and also limit the depolarization produced by intense synaptic inputs (Dodson et al., 2003).
The reduced gating charge as compared with Shaker channels has another important consequence. It has been shown that for a voltage-gated channel, the change in free energy ΔG in going from the closed to the open state (including all closed states), can be obtained from the Q(V) relationship (Chowdhury and Chanda, 2012), according to ΔG = Qmax · Vm, where Qmax is the gating charge and Vm is the median voltage, which is obtained from the Q(V) relationship and defined by:
From the Kv1.2 Q(V) measurements in Fig. 6, we calculated a Vm value of −32.7 mV, which when combined with our measurement of the gating charge of Qmax = 10 eo, gives a ΔG of −7.5 Kcal/mol. The free energy change can also be computed from the equilibrium constants of the gating model, which in our case is given by:
The equilibrium constants of our model are given in Table 1. From these, the value of ΔGmodel is −8.5 Kcal/mol, which is in close agreement with ΔG.
This value is interesting, as the ΔG for Shaker calculated using the median voltage method or from a detailed gating model (Schoppa and Sigworth, 1998b) is almost twice as big (−14 Kcal/mol) (Chowdhury and Chanda, 2012). This difference indicates that, mainly because of the larger gating charge in Shaker channels, their opening is accompanied by a larger stabilization of the open state at positive voltages. One could speculate that the reduced ΔG in Kv1.2 implies that these channels are allosteric, in the sense that the energy difference between the open and closed state is smaller and perhaps there is a higher open probability of voltage-independent openings at negative voltages. However, we have measured the Po(V) curve down to Po values of 10−7, and we do not find convincing evidence of a reduced apparent charge at low Po values as should be expected from allosteric models. In Fig. 3 C we compare the best prediction from Schemes 1 and 2, a fully coupled gating scheme and an allosteric model, respectively. The two models have the same gating charge of 10 eo. It can be seen that if it exists, a reduction in the slope of the Po(V) curve consistent with voltage-independent openings would be distinguishable only at much lower open probabilities than those reached here.
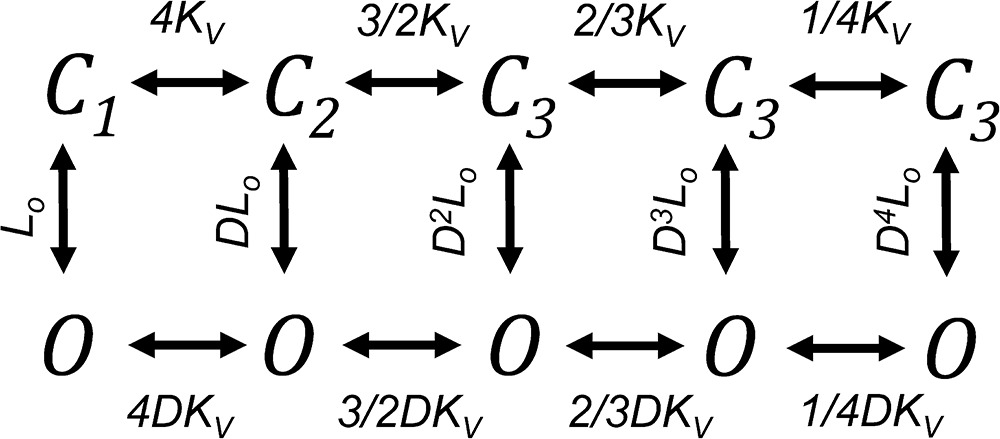 |
(Scheme 2) |
What is the origin of the reduced gating charge in Kv1.2 channels? The first MD-derived calculation of the gating charge of an ion channel (Khalili-Araghi et al., 2010) made use of atomic models of the closed and open conformations based on the Kv1.2/2.1 chimera structure. Strikingly, these calculations yielded a gating charge of ∼10 eo. The authors suggested that the origin of this “anomaly” could be traced to the position of the first arginine of S4 in the electric field, and that it should be deeper into the local electric field. Consequently, the position of R1 was fixed on steered MD simulations to force the calculation to yield a gating charge closer to the expected 13 eo. So, our data would suggest that arginine 294 might actually be pointing out in the closed state, thus being subject to a smaller fraction of the electric field.
Kv1.2 charge movement seems to occur through the same mechanisms as in Shaker, and a sequence alignment of Shaker and Kv1.2 indicates that the key charges, both negative and positive, implicated in charge movement and charge compensation within the membrane are conserved (Fig. 10), thus not providing a clue as to why Kv1.2 gating charge is reduced. Possible scenarios that could explain the difference include a smaller magnitude of the physical displacement of the Kv1.2 voltage sensor. This would be consistent with the observation that Shaker channels have an 11–amino acid insertion between S3b and S4 (Fig. 10), which modulates gating kinetics (Gonzalez et al., 2001) and possibly allows a larger displacement in Shaker than in Kv1.2. We tested this hypothesis, but the Kv1.2 chimera with the Shaker linker did not produce functional channels.
Figure 10.

Amino acid alignment of the S1, S2, and S4 regions of Kv1.2 and Shaker channels. The alignment shows the almost absolute conservation of positive (blue) and negative (red) charges shown to be involved in charge movement, salt-bridge formation, and charge-to-charge interactions. The phenylalanine at position 274 (green), proposed to act as a charge transfer center, is also conserved and occupies the same position in both channels. The obvious difference between both channels is an eleven–amino acid insertion between the S3b and S4 in Shaker (orange). Nonconserved amino acids are highlighted in light purple. The inset shows a molecular model of Shaker (brown) superimposed on a model of Kv1.2 (yellow) based on the Kv1.2–2.1 chimera structure and showing the extra loop in Shaker.
Another likely explanation is that the electric field across the Kv1.2 voltage sensor is less focused than in Shaker channels. In Shaker, estimates of the thickness of the septum or hydrophobic region across which the field is thought to be focused are in the order of 6–10 Å (Islas and Sigworth, 2001; Asamoah et al., 2003). In contrast, the MD simulations performed in Kv1.2/2.1 chimera and the isolated VSD show that water can penetrate in outward- and inward-facing cavities, leaving a 15–17-Å hydrophobic region across which the field can be focused (Jogini and Roux, 2007; Ramsey et al., 2010).
Specific role of S4 residues
The contribution of specific S4 charges to the total gating charge in Shaker has been examined previously using two different methods. Channels were counted by means of radiolabeled high affinity toxins (Aggarwal and MacKinnon, 1996) or nonstationary noise analysis (Seoh et al., 1996). The first method counts channels that can bind the toxin but can underestimate the Q/N value if some channels bind toxin but do not contribute to the gating current, such as desensitized channels or channels that are down-regulated via phosphorylation or other mechanisms (O’Connell et al., 2010). Noise analysis can underestimate the number of channels if the data are sampled at low bandwidth. For heavily filtered data, the error can be as high as 10% (Alvarez et al., 2002). Also, channel rundown can influence the channel number determination. In Shaker, both methods agreed on the size of the WT gating charge, although significant differences were found when studying S4 charge neutralizations.
Neutralization of the first arginine in the Shaker S4 produced a reduction of the gating charge of 4 eo (Aggarwal and MacKinnon, 1996). Why does the neutralization of R1 in Kv1.2 lead to a larger reduction of charge, even beyond what would be maximally expected from the removal of four positive charges that cross the full membrane electric field? It seems inescapable that the mutation is also changing the structure of the initial closed and/or open state. It has been proposed that R1 is close to the gating charge transfer center in the deactivated state of the VSD (Tao et al., 2010; Lin et al., 2011), which would suggest that its neutralization leads to destabilization of the initial closed state. Perhaps in our R1Q mutant, R2 moves up to occupy the original position of R1, leading to a smaller translation of S4 and thus further reducing the gating charge.
Neutralization of the subsequent three charges of the VSD of Kv1.2 shows that they all have a similar contribution to the gating charge, as first described in Shaker channels. However, the fraction of the gating charge that is reduced by neutralization of R2, R3, and R4 is less than what is observed in Shaker mutants (Aggarwal and MacKinnon, 1996), and markedly below the 4 eo that would be expected if the residues crossed the entire membrane field. This observation is also consistent with a scenario where the hydrophobic septum of the VSD of Kv1.2 is thicker than in Shaker, as the same translational movement of the S4 helix in a less focused electric field would result in a reduction of the electrical distance traversed by each residue and, consequently, the gating charge.
Acknowledgments
We thank Tamara Rosenbaum for helpful discussions of this manuscript.
This study was supported by PAPIIT grant IN212612-3 from Universidad Nacional Autonoma de Mexico-Direccion General de Asuntos del Personal Academico-Programa de Apoyo a Proyectos de Investigacion e Inovacion Tecnologica (UNAM-DGAPA-PAPIIT) and CONACyT grant 151297 to L.D. Islas. I.G. Ishida was supported by an Undergraduate Fellowship from UNAM-DGAPA-PAPIIT.
The authors declare no competing financial interests.
Kenton J. Swartz served as editor.
Footnotes
Abbreviations used in this paper:
- MD
- molecular dynamics
- VSD
- voltage-sensing domain
References
- Adrian R.H.1975. Conduction velocity and gating current in the squid giant axon. Proc. R. Soc. Lond. B Biol. Sci. 189:81–86 10.1098/rspb.1975.0043 [DOI] [PubMed] [Google Scholar]
- Aggarwal S.K., and MacKinnon R.. 1996. Contribution of the S4 segment to gating charge in the Shaker K+ channel. Neuron. 16:1169–1177 10.1016/S0896-6273(00)80143-9 [DOI] [PubMed] [Google Scholar]
- Ahern C.A., and Horn R.. 2005. Focused electric field across the voltage sensor of potassium channels. Neuron. 48:25–29 10.1016/j.neuron.2005.08.020 [DOI] [PubMed] [Google Scholar]
- Alabi A.A., Bahamonde M.I., Jung H.J., Kim J.I., and Swartz K.J.. 2007. Portability of paddle motif function and pharmacology in voltage sensors. Nature. 450:370–375 10.1038/nature06266 [DOI] [PMC free article] [PubMed] [Google Scholar]
- Almers W.1978. Gating currents and charge movements in excitable membranes. Rev. Physiol. Biochem. Pharmacol. 82:96–190 10.1007/BFb0030498 [DOI] [PubMed] [Google Scholar]
- Alvarez O., Gonzalez C., and Latorre R.. 2002. Counting channels: A tutorial guide on ion channel fluctuation analysis. Adv. Physiol. Educ. 26:327–341. [DOI] [PubMed] [Google Scholar]
- Asamoah O.K., Wuskell J.P., Loew L.M., and Bezanilla F.. 2003. A fluorometric approach to local electric field measurements in a voltage-gated ion channel. Neuron. 37:85–98 10.1016/S0896-6273(02)01126-1 [DOI] [PubMed] [Google Scholar]
- Campos F.V., Chanda B., Roux B., and Bezanilla F.. 2007. Two atomic constraints unambiguously position the S4 segment relative to S1 and S2 segments in the closed state of Shaker K channel. Proc. Natl. Acad. Sci. USA. 104:7904–7909 10.1073/pnas.0702638104 [DOI] [PMC free article] [PubMed] [Google Scholar]
- Cha A., and Bezanilla F.. 1997. Characterizing voltage-dependent conformational changes in the Shaker K+ channel with fluorescence. Neuron. 19:1127–1140 10.1016/S0896-6273(00)80403-1 [DOI] [PubMed] [Google Scholar]
- Chowdhury S., and Chanda B.. 2012. Estimating the voltage-dependent free energy change of ion channels using the median voltage for activation. J. Gen. Physiol. 139:3–17 10.1085/jgp.201110722 [DOI] [PMC free article] [PubMed] [Google Scholar]
- Colquhoun D., and Sigworth F.J.. 1995. Fitting and statistical analysis of single-channel records. InSingle-Channel Recording. Sakmann B. and Neher E., Berlin, Springer; 483–587 10.1007/978-1-4419-1229-9_19 [DOI] [Google Scholar]
- Delemotte L., Tarek M., Klein M.L., Amaral C., and Treptow W.. 2011. Intermediate states of the Kv1.2 voltage sensor from atomistic molecular dynamics simulations. Proc. Natl. Acad. Sci. USA. 108:6109–6114 10.1073/pnas.1102724108 [DOI] [PMC free article] [PubMed] [Google Scholar]
- Dodson P.D., Barker M.C., and Forsythe I.D.. 2002. Two heteromeric Kv1 potassium channels differentially regulate action potential firing. J. Neurosci. 22:6953–6961. [DOI] [PMC free article] [PubMed] [Google Scholar]
- Dodson P.D., Billups B., Rusznák Z., Szûcs G., Barker M.C., and Forsythe I.D.. 2003. Presynaptic rat Kv1.2 channels suppress synaptic terminal hyperexcitability following action potential invasion. J. Physiol. 550:27–33 10.1113/jphysiol.2003.046250 [DOI] [PMC free article] [PubMed] [Google Scholar]
- Gonzalez C., Rosenman E., Bezanilla F., Alvarez O., and Latorre R.. 2001. Periodic perturbations in Shaker K+ channel gating kinetics by deletions in the S3-S4 linker. Proc. Natl. Acad. Sci. USA. 98:9617–9623 10.1073/pnas.171306298 [DOI] [PMC free article] [PubMed] [Google Scholar]
- González-Pérez V., Stack K., Boric K., and Naranjo D.. 2010. Reduced voltage sensitivity in a K+-channel voltage sensor by electric field remodeling. Proc. Natl. Acad. Sci. USA. 107:5178–5183 10.1073/pnas.1000963107 [DOI] [PMC free article] [PubMed] [Google Scholar]
- Heginbotham L., and MacKinnon R.. 1993. Conduction properties of the cloned Shaker K+ channel. Biophys. J. 65:2089–2096 10.1016/S0006-3495(93)81244-X [DOI] [PMC free article] [PubMed] [Google Scholar]
- Heinemann S.H., and Conti F.. 1992. Nonstationary noise analysis and application to patch clamp recordings. Methods Enzymol. 207:131–148 10.1016/0076-6879(92)07009-D [DOI] [PubMed] [Google Scholar]
- Hirschberg B., Rovner A., Lieberman M., and Patlak J.. 1995. Transfer of twelve charges is needed to open skeletal muscle Na+ channels. J. Gen. Physiol. 106:1053–1068 10.1085/jgp.106.6.1053 [DOI] [PMC free article] [PubMed] [Google Scholar]
- Islas L.D., and Sigworth F.J.. 1999. Voltage sensitivity and gating charge in Shaker and Shab family potassium channels. J. Gen. Physiol. 114:723–742 10.1085/jgp.114.5.723 [DOI] [PMC free article] [PubMed] [Google Scholar]
- Islas L.D., and Sigworth F.J.. 2001. Electrostatics and the gating pore of Shaker potassium channels. J. Gen. Physiol. 117:69–89 10.1085/jgp.117.1.69 [DOI] [PMC free article] [PubMed] [Google Scholar]
- Jensen M.O., Jogini V., Borhani D.W., Leffler A.E., Dror R.O., and Shaw D.E.. 2012. Mechanism of voltage gating in potassium channels. Science. 336:229–233 10.1126/science.1216533 [DOI] [PubMed] [Google Scholar]
- Jogini V., and Roux B.. 2007. Dynamics of the Kv1.2 voltage-gated K+ channel in a membrane environment. Biophys. J. 93:3070–3082 10.1529/biophysj.107.112540 [DOI] [PMC free article] [PubMed] [Google Scholar]
- Kamb A., Tseng-Crank J., and Tanouye M.A.. 1988. Multiple products of the drosophila Shaker gene may contribute to potassium channel diversity. Neuron. 1:421–430 10.1016/0896-6273(88)90192-4 [DOI] [PubMed] [Google Scholar]
- Khalili-Araghi F., Jogini V., Yarov-Yarovoy V., Tajkhorshid E., Roux B., and Schulten K.. 2010. Calculation of the gating charge for the Kv1.2 voltage-activated potassium channel. Biophys. J. 98:2189–2198 10.1016/j.bpj.2010.02.056 [DOI] [PMC free article] [PubMed] [Google Scholar]
- Lainé M., Papazian D.M., and Roux B.. 2004. Critical assessment of a proposed model of Shaker. FEBS Lett. 564:257–263 10.1016/S0014-5793(04)00273-X [DOI] [PubMed] [Google Scholar]
- Ledwell J.L., and Aldrich R.W.. 1999. Mutations in the S4 region isolate the final voltage-dependent cooperative step in potassium channel activation. J. Gen. Physiol. 113:389–414 10.1085/jgp.113.3.389 [DOI] [PMC free article] [PubMed] [Google Scholar]
- Lin M.C., Hsieh J.Y., Mock A.F., and Papazian D.M.. 2011. R1 in the Shaker S4 occupies the gating charge transfer center in the resting state. J. Gen. Physiol. 138:155–163. [DOI] [PMC free article] [PubMed] [Google Scholar]
- Long S.B., Campbell E.B., and Mackinnon R.. 2005. Crystal structure of a mammalian voltage-dependent Shaker family K+ channel. Science. 309:897–903 10.1126/science.1116269 [DOI] [PubMed] [Google Scholar]
- Long S.B., Tao X., Campbell E.B., and MacKinnon R.. 2007. Atomic structure of a voltage-dependent K+ channel in a lipid membrane-like environment. Nature. 450:376–382 10.1038/nature06265 [DOI] [PubMed] [Google Scholar]
- Mannuzzu L.M., Moronne M.M., and Isacoff E.Y.. 1996. Direct physical measure of conformational rearrangement underlying potassium channel gating. Science. 271:213–216 10.1126/science.271.5246.213 [DOI] [PubMed] [Google Scholar]
- Noceti F., Baldelli P., Wei X., Qin N., Toro L., Birnbaumer L., and Stefani E.. 1996. Effective gating charges per channel in voltage-dependent K+ and Ca2+ channels. J. Gen. Physiol. 108:143–155 10.1085/jgp.108.3.143 [DOI] [PMC free article] [PubMed] [Google Scholar]
- O’Connell K.M.S., Loftus R., and Tamkun M.M.. 2010. Localization-dependent activity of the Kv2.1 delayed-rectifier K+ channel. Proc. Natl. Acad. Sci. USA. 107:12351–12356 10.1073/pnas.1003028107 [DOI] [PMC free article] [PubMed] [Google Scholar]
- Papazian D.M., Schwarz T.L., Tempel B.L., Jan Y.N., and Jan L.Y.. 1987. Cloning of genomic and complementary DNA from Shaker, a putative potassium channel gene from Drosophila. Science. 237:749–753 10.1126/science.2441470 [DOI] [PubMed] [Google Scholar]
- Pérez-Cornejo P., and Begenisich T.. 1994. The multi-ion nature of the pore in Shaker K+ channels. Biophys. J. 66:1929–1938 10.1016/S0006-3495(94)80986-5 [DOI] [PMC free article] [PubMed] [Google Scholar]
- Ramsey I.S., Mokrab Y., Carvacho I., Sands Z.A., Sansom M.S., and Clapham D.E.. 2010. An aqueous H+ permeation pathway in the voltage-gated proton channel Hv1. Nat. Struct. Mol. Biol. 17:869–875 10.1038/nsmb.1826 [DOI] [PMC free article] [PubMed] [Google Scholar]
- Rezazadeh S., Kurata H.T., Claydon T.W., Kehl S.J., and Fedida D.. 2007. An activation gating switch in Kv1.2 is localized to a threonine residue in the S2-S3 linker. Biophys. J. 93:4173–4186 10.1529/biophysj.107.116160 [DOI] [PMC free article] [PubMed] [Google Scholar]
- Schmidt D., del Mármol J., and MacKinnon R.. 2012. Mechanistic basis for low threshold mechanosensitivity in voltage-dependent K+ channels. Proc. Natl. Acad. Sci. USA. 109:10352–10357 10.1073/pnas.1204700109 [DOI] [PMC free article] [PubMed] [Google Scholar]
- Scholle A., Dugarmaa S., Zimmer T., Leonhardt M., Koopmann R., Engeland B., Pongs O., and Benndorf K.. 2004. Rate-limiting reactions determining different activation kinetics of Kv1.2 and Kv2.1 channels. J. Membr. Biol. 198:103–112 10.1007/s00232-004-0664-0 [DOI] [PubMed] [Google Scholar]
- Schoppa N.E., and Sigworth F.J.. 1998a. Activation of shaker potassium channels. I. Characterization of voltage-dependent transitions. J. Gen. Physiol. 111:271–294 10.1085/jgp.111.2.271 [DOI] [PMC free article] [PubMed] [Google Scholar]
- Schoppa N.E., and Sigworth F.J.. 1998b. Activation of Shaker potassium channels. III. An activation gating model for wild-type and V2 mutant channels. J. Gen. Physiol. 111:313–342 10.1085/jgp.111.2.313 [DOI] [PMC free article] [PubMed] [Google Scholar]
- Schoppa N.E., McCormack K., Tanouye M.A., and Sigworth F.J.. 1992. The size of gating charge in wild-type and mutant Shaker potassium channels. Science. 255:1712–1715 10.1126/science.1553560 [DOI] [PubMed] [Google Scholar]
- Seoh S.A., Sigg D., Papazian D.M., and Bezanilla F.. 1996. Voltage-sensing residues in the S2 and S4 segments of the Shaker K+ channel. Neuron. 16:1159–1167 10.1016/S0896-6273(00)80142-7 [DOI] [PubMed] [Google Scholar]
- Sigg D., and Bezanilla F.. 1997. Total charge movement per channel. The relation between gating charge displacement and the voltage sensitivity of activation. J. Gen. Physiol. 109:27–39 10.1085/jgp.109.1.27 [DOI] [PMC free article] [PubMed] [Google Scholar]
- Sigworth F.J.1980. The variance of sodium current fluctuations at the node of Ranvier. J. Physiol. 307:97–129 10.1113/jphysiol.1980.sp013426 [DOI] [PMC free article] [PubMed] [Google Scholar]
- Sigworth F.J.1994. Voltage gating of ion channels. Q. Rev. Biophys. 27:1–40 10.1017/S0033583500002894 [DOI] [PubMed] [Google Scholar]
- Swartz K.J.2008. Sensing voltage across lipid membranes. Nature. 456:891–897 10.1038/nature07620 [DOI] [PMC free article] [PubMed] [Google Scholar]
- Tao X., Lee A., Limapichat W., Dougherty D.A., and MacKinnon R.. 2010. A gating charge transfer center in voltage sensors. Science. 328:67–73 10.1126/science.1185954 [DOI] [PMC free article] [PubMed] [Google Scholar]
- Vargas E., Yarov-Yarovoy V., Khalili-Araghi F., Catterall W.A., Klein M.L., Tarek M., Lindahl E., Schulten K., Perozo E., Bezanilla F., and Roux B.. 2012. An emerging consensus on voltage-dependent gating from computational modeling and molecular dynamics simulations. J. Gen. Physiol. 140:587–594 10.1085/jgp.201210873 [DOI] [PMC free article] [PubMed] [Google Scholar]
- Villalba-Galea C.A., Sandtner W., Starace D.M., and Bezanilla F.. 2008. S4-based voltage sensors have three major conformations. Proc. Natl. Acad. Sci. USA. 105:17600–17607 10.1073/pnas.0807387105 [DOI] [PMC free article] [PubMed] [Google Scholar]
- Yellen G.2002. The voltage-gated potassium channels and their relatives. Nature. 419:35–42 10.1038/nature00978 [DOI] [PubMed] [Google Scholar]
- Zagotta W.N., Hoshi T., and Aldrich R.W.. 1994a. Shaker potassium channel gating. III: Evaluation of kinetic models for activation. J. Gen. Physiol. 103:321–362 10.1085/jgp.103.2.321 [DOI] [PMC free article] [PubMed] [Google Scholar]
- Zagotta W.N., Hoshi T., Dittman J., and Aldrich R.W.. 1994b. Shaker potassium channel gating. II: Transitions in the activation pathway. J. Gen. Physiol. 103:279–319 10.1085/jgp.103.2.279 [DOI] [PMC free article] [PubMed] [Google Scholar]