

Abstract
We have developed an automated system for drug screening using a single-cell–multiple functional response technology. The approach uses a semiautomated preparatory system, high-speed sample collection, and a unique analytical tool that provides instantaneous results for compound dilutions using 384-well plates. The combination of automation and rapid robotic sampling increases quality control and robustness. High-speed flow cytometry is used to collect single-cell results together with a newly defined analytical tool for extraction of IC50 curves for multiple assays per cell. The principal advantage is the extreme speed of sample collection, with results from a 384-well plate being completed for both collection and data processing in less than 10 min. Using this approach, it is possible to extract detailed drug response information in a highly controlled fashion. The data are based on single-cell results, not populations. With simultaneous assays for different functions, it is possible to gain a more detailed understanding of each drug/compound interaction. Combined with integrated advanced data processing directly from raw data files, the process from sampling to analytical results is highly intuitive. Direct PubMed links allow review of drug structure and comparisons with similar compounds.
Keywords: HTS, high-throughput screening, biology automation, informatics and software, data analysis, informatics and software, screening data analysis, informatics and software, robotics and instrumentation engineering
Introduction
Flow cytometry is a technology that analyzes properties of single cells in flow by collecting fluorescence and light-scatter signals from multiple labels tagging cellular proteins or from stains directly connecting to cellular structures. The values of intensities from each detection channel are stored in standard flow cytometry data sets known as listmode files. Information about each analyzed cell is stored in the listmode file as a multidimensional vector of fluorescence intensities and accompanying light-scatter characteristics.
When flow cytometry was introduced into the laboratories of scientists around the world in the 1970s and 1980s, essentially no analytical tools were available. Data processing was achieved by taking Polaroid photographs of the screens of oscilloscopes. Instrument manufacturers struggled to write software that operated the instruments; data-processing software was considered to be a user responsibility. Early analytical tools were written for mini-computers such as the PDP 11, and software was not easily transferable from one site to another. Around 1985, Coulter Corporation developed a revolutionary approach to data analysis by developing a PC-based software program that could be run on any IBM-compatible PC available at that time. Subsequently, a number of vendors have taken the field to new levels with innovative and powerful software systems that can handle most of the assay types available in the field.
The flow cytometry (FC) data set can be analyzed using various software packages provided by the instrument vendors (BD, Beckman Coulter, Millipore, and others), as well as independent vendors (DeNovo, Verity, FloJo). This is possible owing to a high level of standardization enforced by the International Society for Advancement of Cytometry (ISAC).
One major exception is the development of specialized data-processing packages supporting high-throughput flow cytometry (HTFC), a technique that raises significant interest within the biomolecular screening community. In contrast to standard FC, the high-throughput version of this technique integrates with liquid handling and other lab automation systems, allowing for complex organization of samples and sophisticated multifactorial assay formats using standard multiwell plates. However, the ISAC-recognized listmode files do not store meta-information regarding the assay formats and can represent only a single sample (i.e., a single well) at a time.
This severe limitation was addressed in the early days of HTFC by creation of concatenated data files that combined all the readouts associated with an assay into a single file, in which subsequent samples were indexed using a time-of-measurement variable. Known as TIP (tube identifier parameter), this system not only allowed all the resultant data to be processed and analyzed as a single file but also created possibilities for selection and classification of cellular populations across the entire assay.1,2 This allowed for extraction of unique statistical descriptors characterizing unique features of the measured populations.3,4
The automation of FC sample processing was helped by introduction of barcoding devices5 and robotic sample collection,6 which has been expanded to allow HTFC to become a useful and easily implementable technology.7
The problem with the significant advance in sampling capability is that the analytical tools to obtain useful results from these huge numbers of samples have not kept pace with the technology. The core reason is that the thought processes of both manufacturers and many users and have remained for the most part in the modus operandi of the early 1980s. There are some exceptions, such as the advances in data analysis concepts developed by Bagwell,8 where innovative methods for interpretation of very complex time-dependent data offer an alternative to the typical software approaches currently available. In addition, the large range of analytical tools made available via the Bioconductor environments (discussed in detail in Robinson et al.9) has provided new approaches to advanced data processing and therefore new opportunities for flow cytometry. Bagwell et al.10 introduced biplot in 1985, but since one- and two-color data were essentially the only opportunities for multiparameter data, biplot was not adopted within the core of the field. A variety of developments have created a series of analytical tools such as Kolmogorov-Smirnov (KS) tests,11 basic cluster analysis,12 neural networks,13 prediction limit methods,14 logical data display (reviewed in Herzenberg et al.15), complex classification schemes,16 utility of support vector machines (SVMs) in flow cytometry,17 the concept of fluorescence barcoding for multiplexing cells,18 distance measures,19 clustering tools,20 merging mixture moments,21 and Gaussian mixture modeling,22 among others.
Despite progress in developing tools for automated data analysis suitable for HTFC, most current approaches offer only limited interactivity. This is because most of the innovative methods for HTFC have been implemented and tested within the R/Bioconductor environment. The R programming language favored by bioinformaticians and computational biologists allows for quick prototyping, exchange of ideas, and rapid implementation of complex algorithms. However, it is not well suited for a demanding environment in which processing time and robustness of the entire process play a major role.
Regrettably, without easy-to-use tools for processing complex HTFC-based assays, it is difficult to answer systems- driven biological questions. The lack of user-friendly, graphical user interface (GUI)–enabled rapid data analysis packages is a key restriction to the success of HTFC.
Until now, flow cytometry application software design has reflected the limited capability of flow cytometry to accommodate large arrays of samples. This has produced a vertically driven, narrowly defined approach to data processing that has performed an excellent job for traditional flow cytometry and proven to be adequate for current assay designs, and consequently has become a powerful tool in multidimensional data processing. This traditional approach to flow cytometry analysis is to process a listmode file by developing a protocol that often reflects the collection process on the flow cytometer itself. It is customary for instruments to transfer the original collection protocol with the listmode file so that analysis software can identify the process used for collection as the preferred analysis protocol. On the basis of the results from this listmode file, one would then apply a similar or slightly modified protocol to many other files. The data-processing pathway currently followed for FC-based assays is very restrictive and requires multiple steps that are usually not automated. Frequently, it involves a series of manually defined binary classifiers (so-called gates), reducing the mixed biological populations to a limited number of subpopulations of specified functionality defined by the presence or absence of biomarkers of interest. When implemented in hundreds of samples composing a complete assay, this process can be tedious, time-consuming, and prone to operator mistakes. The standard approach is based on several assumptions that have become standard in the field: (1) Test-set sizes are not large. (2) There are some kinds of training components in the assay (controls) that teach something about the assay. (3) Analytical tools are applied sequentially. (4) Recombination of data is then required to understand the result, as shown in Figure 1.
Figure 1.

(A) The typical process followed by traditional flow cytometry. The complexity of dealing with single tubes plus detailed gating and analysis requires significant user input at every step, and current approaches assume that each component of the “system” will be managed independently, followed by a very complex and frequently difficult process of recombining the results. (B) The high-throughput flow cytometry process. All components remain completely linked, and the resulting output can provide an entire assay evaluation as opposed to the “tube-by-tube” analysis presently practiced.
Quantification of Mitochondrial Function Using HTFC
The presented report demonstrates a custom-built assay analysis system offering a rapid GUI-driven environment for visual programming of HTFC data analysis pipelines. This tool is described in the context of its use with a high-throughput comprehensive screen for functional cell properties—in particular, the measurement of reactive oxygen species (ROS) driven by chemical stimulation of cellular systems. This process can reflect significant drug-mediated changes in cellular functional properties.
Fundamental to this study was the need to observe single cells under live-cell conditions so that we could develop an understanding of the metabolic processes altered by different drug classes. The cells chosen for the study were HL-60 cells because of their similarity to human phagocytic cells and the significant knowledge base already existing for these cells. HL-60 cells were first cultured from a patient with acute myelocytic leukemia23 and have been used for many years as a suitable model cell for a variety of studies. These transformed cells can be differentiated into both monocytes24 and neutrophilic cells.25 HL-60 cells have been shown to have excellent properties for evaluating certain functional characteristics of cellular systems,26 making these cells particularly useful for drug screening. The example assay described in this report specifically focuses on mitochondrial functionality affected by the presence of external perturbants, such as drugs.
Mitochondria are significant sites for ROS production, and the mitochondrial respiratory chain is a particularly important site of ROS production under normal physiological conditions.27–29 Numerous reports indicate that ROS play a significant role in apoptosis induced by a variety of stimuli, including UV radiation30 and tumor necrosis factor (TNF) stimulation,31 among other activators. We have previously shown that mitochondrial ROS could itself induce apoptosis via induction of mitochondrial membrane potential decrease, release of cytochrome c, and activation of caspase 3.32 Tiziani et al.33 demonstrated depletion of reduced glutathione (GSH) and accumulation of oxidized glutathione (GSSH) in drug-treated HL-60 using metabolic profiling. Superoxide measurements in HL-60 cells and normal neutrophils have been achieved using several methods, including the conversion of hydroethidine to ethidium,34–36 which has proved to be an excellent flow cytometric technique. Mitosox used in our assay is actually a slightly modified form of HE, with the HE structure being conjugated to the triphenylphosphonium moiety.37 Mitosox has been reputed to be an excellent reporter for mitochondrial ROS, particularly superoxide. Although there are number of reports that H2O2, hydroxyl radical, and peroxynitrite also oxidize this dye, other reports indicate a strong specificity for superoxide.37
It has been shown that the normal mitochondrial respiratory chain activity can be interrupted, either under pathological conditions or by the use of respiratory chain inhibitors, and quantitatively measured.27,28,38 A variety of redox probes have been developed over many years to address highly sensitive single-cell measurement. One assay uses calcein-acetoxymethylester (calcein-AM), a nonfluorescent cell-permeant molecule that, upon esterification, is converted to the fluorescent compound calcein.39 Calcein has subsequently been used in a variety of systems as an excellent representation of intracellular ROS production. For example, studies of drug transporter systems have demonstrated the use of calcein as an effective monitor for P-glycoprotein function.40 Other studies have demonstrated the functionality of calcein in combination with other functional probes such as carboxyfluorescein diacetate (CFDA) and Rhodamine 123 (Rh123)41 using flow cytometry for single-cell analysis. We used a combination of calcein, glutathione, and Mitosox, a probe that has been suggested to measure superoxide production; all of these can be run simultaneously. To obtain the fourth functional parameter, mitochondrial membrane potential, a second plate was required.
This functional measurement for the alteration in mitochondrial membrane potential was achieved using the membrane potential–sensitive fluorescent dye 5,5′,6,6′-tetrachloro-1,1′,3,3′-tetra-ethylbenzimidazolylcarbocyanine iodide (JC-1), which has been used previously with HL-60 cells.32,42,43 Because of the overlapping spectral response of JC-1 and the redox probes, all assays for JC-1 must be run separately on a second multiwell plate. This setup adds to the assay complexity; however, with the help of a high-throughput flow cytometry system, it was possible to process as many as 20 sets of 384-well plates per day, including the need for a 6-h incubation.
Materials, Methods, and Assay Definition
Cell line and culture conditions
The human leukemic HL-60 cell line was obtained from the American Type Culture Collection (Manassas, VA) and was cultivated as per ATCC instructions. After successful revival of cryogenic stock, the HL-60 cell line was then transitioned into RPMI-1640 medium and supplemented with 10% fetal calf serum and 100 U/mL penicillin and 100 μg/mL streptomycin (Gibco/Invitrogen, Carlsbad, CA), hereafter called cultivation medium. After successful medium transition, cells were stored in cultivation medium + 5.0% cell-grade DMSO (Sigma-Aldrich, St. Louis, MO), frozen in a controlled-rate freezing apparatus to −80 °C and then stored in vapor-phase liquid nitrogen. From liquid-nitrogen stocks, the HL-60 cells were thawed and routinely cultured in RPMI-1640 medium, supplemented with 10% fetal calf serum. The culture was grown at 37 °C with a gas mixture of 5% CO2/95% air. After an initial round of growth in flask culture, to 1.0 × 10⁶ cells per milliliter, the HL-60 cells were transferred into T-850 roller bottles. HL-60 cultures were inoculated into fresh medium at 1.0 × 10⁵ cells per milliliter and allowed to grow to 1.0 × 10⁶ cells per milliliter, 1 rpm, 37 °C and 5% CO2/95% air mixture. Cells were collected by centrifugation at 400 g for 6 min, placed robotically into assay plates with RPMI-1640 medium supplemented with 10% fetal calf serum, and exposed to chemicals of interest. Prior to routine screening from freezer stocks, a check of compounds was performed as a quality control baseline to ensure biological reproducibility.
Assay preparation
All assays were performed in 384-well plates using a Biomek 3000 robot (Beckman Coulter, Brea, CA) placed inside a class II hood that had been sanitized for 15 min before use. Approximately 200 000 HL-60 cells were placed in each well by robotically depositing 20 μL of a 1 × 10⁷ concentration of stock cells. Chemicals for testing were prepared in 96-well plates by taking 3-fold serial dilutions in Dulbecco’s modified Eagle’s medium (DMEM). In this particular assay, chemicals consisted of libraries of molecules of interest for altering redox states as well as control chemicals. Chemicals (20 μL total volume in DMEM) were added to plates prior to addition of cells. Cells were added to plates in which chemicals were already present and incubated for 6 h at 37 °C and 5% CO2. Plates were centrifuged at 250 g for 5 min in a Beckman centrifuge and placed on the robot for removal of the supernatant. Then, 30 μL was removed from the 40 μL in each well. All media were prewarmed to 37 °C for 10 min, and the robots were also sanitized for 15 min. For the JC-1 assay, 40 μL of a 5-μM solution was added robotically to each well of 384-well plates. Then, 5 μm valiniomycin was added to the last four wells as a positive control. DMSO-only control wells were also present. For redox assays, stock concentrations were prepared: calcein AM (1 mM in DMSO), mBBr (40 mM in DMSO), and Mitosox (50 μg from sealed-vial stock). Calcein (0.03 μg/mL), mBBr (40 μm), and Mitosox (10 μM) were added robotically to each well of a 384-well plate that was then covered with tape. Plates were centrifuged at 250 g for 30 s to remove bubbles and mixed at 2200 rpm for 10 s. Plates were incubated at 37 °C for 10 min prior to flow cytometry. Cell samples were provided for flow cytometry calibration and plates sent to the CyAn flow cytometer.
Flow cytometry
All samples were run on a CyAn flow cytometry (Beckman Coulter), which was previously calibrated using both Level II and Level III calibration beads (Beckman Coulter). The flow cytometer was calibrated 1 h prior to the first plate’s finishing the 6-h incubation. Instrument setup for the CyAn cytometer was the following: Light scatter for gating was determined with the 488-nm laser using the forward-angle light-scatter detector. Fluorescence instrument setting for JC-1: excitation 488 nm, emission 530/40 nm and 590 nm; for calcein: excitation 488 nm, emission 530/40 nm; for mBBr: excitation 405 nm, emission 450/50 nm; for Mitosox: excitation 488 nm, emission 680/30 nm. Samples were delivered automatically to the CyAn by the Hypercyt robot (Intellicyt, Inc., Albuquerque, NM), using a 60-s preplate prime, a 30-s shake at 3000 rpm, a 0.5-s up time, and a 1.0-s sip time. Pump speed was 18.0 rpm, which resulted in a 1-s sip per well extracting 1 μL of sample, with interwell shake at 3000 rpm every 24 wells. Following completion of each plate, the Hyperview software was activated to identify each well, followed by extraction of FC files into 384 single wells for transfer to the network for permanent storage. All data analysis was performed using a technology called PlateAnalyzer developed in our laboratory specifically for high-throughput analysis (described below). This software has the ability to perform comprehensive statistical analysis of very large sets of data in almost real time. For example, production of 32 dose-response curves (IC50) per plate (with 10 dosage levels per drug) could be achieved in approximately 30 s after each plate was collected on the flow cytometer. A standard 384-well plate, when sampling approximately 5000 cells per well, required 8 min for flow cytometry using the CyAn-Hypercyt robotic sampling system.
Rapid Data Analysis Methodology
Visual Programming Concept
The idea of rapid development tools using a visual programming environment is probably best known to scientists and engineers through the use of LabVIEW program and hardware from National Instruments (Austin, TX). Other visual programming environment for data processing and manipulation include IBM’s Data Explorer,44 Khoros,45 Orange,46 and AVS.45 Visual programming can be summarized as the process of programming by manipulating graphical objects instead of writing textual code. PlateAnalyzer, a high-throughput (HT) flow cytometry data-processing environment used in this study, is a visual programming toolkit allowing a cytometry analyst to combine various processing steps, control the input for the algorithms, and apply processing operators graphically, interacting with the design canvas, rather than encoding the processing pipeline, by using an all-purpose data manipulation and statistical analysis processing language such as R.
In the PlateAnalyzer system, small icons or boxes represent programmatic entities (snippets of functional code), and lines (or pipes) connecting these objects allow for flow of information and indicate relationships between operators. The entire arrangement of data-processing code snippets and connecting pipelines, called a “flow cytometry logic tree,” is described later in this report.
Structure of Input Data
In the present implementation, the listmode files representing analyzed samples are read into a memory buffer and are stored as a v × n matrix, where v is the number of collected variables, and n is the number of cells processed in the entire assay across all the samples. Therefore, in the case of a 384-well plate, all 384 separate listmode files that comprise the plate are read from the disk and stored in the memory. For the most part, the variables are stored with a single precision, which means that the maximum accuracy would be 10−6. However, an option can be activated to store and process double-precision numbers should high accuracy be required.
Single precision guarantees a significant saving in required memory: For example, if 20 variables were collected with 8-bit precision and 5 million cells were analyzed, the total memory needed would be 800 Mb for double-precision and 400 Mb for single-precision numbers. This may be of significance because for further processing, the data are kept in three separate arrays in memory for different manipulations.
The first of the arrays maintains the raw data, the second stores data after the process of spectral unmixing47 (compensation), and the third represents data after necessary transformations commonly used in FC (such as logarithmic, double exponential, etc.). Other metadata are also stored: spectral spillover matrices that accommodate compensation and information about “dead” wells, that is, wells that should not be included in the analysis. In addition, all the classification (gating) information and the relationships between defined classifiers (gates) are available for instant access.
The gating metadata are represented as a series of chain codes. Therefore, for the purpose of classification, every cell has allocated a single byte that represents a series of gates defining the class or classes to which the cell belongs. This value is a 32- or 64-bit number, which is convenient for data storage reasons. Each chain code can be expanded by use of additional 32- or 64-bit numbers. The number of gates is therefore unlimited, as the chain codes are dynamically expanded as the user creates more gates. An additional matrix exists within every gate region. Since gate regions can be linked using standard Boolean operators, we created a 3 × 3 matrix within each gate region that allows for rapid identification of any cell logic that fits that Boolean gate set, with the additional locations used for a modal gate, which is an additional mechanism for including or excluding certain data. Finally, a component of this matrix can be used to eliminate an entire well or multiple wells, so data from these wells are not included in any analytical process.
Gating Using the Logic-Tree Concept
The FC logic trees, which can be interactively built using the PlateAnalyzer design canvas, represent a series of processes involving data reduction, feature extraction, and visualization of large HTFC data sets. Although the concept is new to the flow cytometry community, some cytometrists may be familiar with a similar model employed in the LabVIEW rapid development environment. Regrettably, besides PlateAnalyzer, there are no other data-processing tools for flow cytometry using this powerful concept. Figures 2 and 3 show examples of logic trees.
Figure 2.
A simple logic tree showing icons (above) with the actual data being gated below each icon and the linked relationship created across the logic tree. At the end of the tree is a plot icon.
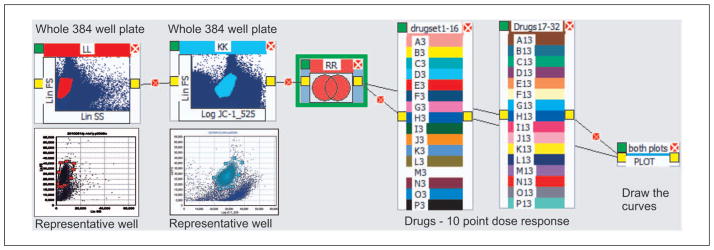
Figure 3.

The entire logic tree to produce 96 IC50 curves from three different assays run on 2 million cells in a single 384-well plate. The collection time is 8 min; the analysis time is less than 1 min total from opening the program to saving the IC50 curves. The six panels represent typical logical operations for analysis of high-throughput data: (1) an opening process defining a population of cells; (2) functional operators, in this case, three distinct assays with different functional tests, identified with the limits for normal results; (3) Boolean operators that link processes; (4) drug “containers” that allow IC50 calculations based on drug concentrations; (5) a plotting icon for linking panels; and (6) a plotting icon that links all plotting icons, allowing a single click to deliver all 96 IC50 curves and results simultaneously.
The process of logic-tree construction is simple, as the analytical procedure is encoded by dragging icons onto the design canvas and linking them by pipelines, which represent flow of information. All the underlying analysis and computation is kept invisible to the end user. Since all the input data are stored in the memory buffer and the analysis process can be easily separated into a number of parallel tasks, the data representing an entire multiwell plate can be analyzed simultaneously, providing the final result an order of magnitude faster than any current FC analysis system.
This is a paradigm shift, one that is necessary to achieve the high-speed results for high-throughput analysis. The program allows logic trees to be applied to entire multiwell plates regardless of the number of wells. Typically, for 10 million cells in 384 wells, a complete analysis can take less than 1 min on a standard mid-level laptop computer. As the number of cells increases, naturally the computation time increases. Due to the parallel nature of the processing tasks, the time factor can be reduced by increasing memory and the number of processors available. Based on Moore’s law,48 computers will continue to expand at a faster rate than most of our capabilities in analysis, so one would expect that very large screens in 1536 plates with 108 to 109 will be perfectly analyzable cells using these methods.
One of the most important considerations for a systems-driven analytical approach is the highly reduced complexity of the data-processing pipeline offered by the application of logic trees. For example, as shown in Figure 4, data reduction and feature extraction from a seven-color FC data set, resulting in approximately 100 dose-response curves defined over multiple populations of cells treated with multiple drugs, can also be accommodated in a single logic tree.
Figure 4.

(A) The three components of a logic tree: the multiple colors used to separate the cells into distinct populations, the gating conditions for each of the conjugated antibodies, and finally the results, which in this case represent dose-response curves. (B) Part of an actual logic tree that can directly produce hundreds of curves from a single 384-well plate in just over 1 min. Gates are sequentially applied along the branch of the tree, which then applies the conditions to the entire plate; specific drug concentrations are then applied to produce the curves.
Special Operators for Drug Screening
Flow cytometry has not focused on developing tools that fit these demands despite the fact that flow is the most accurate and powerful single-cell technology available today. Dose-response curves are frequently the end result for drug-screening assays, as well as for many kinetic-based analyses. FC data-analysis software does not offer an interface that is capable of producing such results directly. Therefore, traditionally, dose-response analysis is performed in separate statistical packages using processed data exported from FC programs.
However, PlateAnalyzer offers a toolkit for creating a complete analysis pipeline starting with raw intensity vectors describing individual cells and ending with dose-response curves and IC50 values. This is illustrated by the process employed for our mitochondrial toxicity assay. The assay provides a measure of individual cellular responses independently for each cell in the well, for multiple functional measurements. These are shown in Figure 5 for each of the four measurements made on HL-60 cells. For example, if a particular drug (drug 1) were to be evaluated by computation of IC50, the assumption is that drug concentrations would be laid out in rows of the multiwell plate (although column-oriented format is also possible) and that the concentrations would be encoded in the assay metadata (or be read from a database). A mechanism for determining the IC50 values for a drug depends on several specific issues: the particular population of cells selected, negative and positive control samples for comparison, specific concentrations of the drug, and finally the type of reporter used to assess cell function.
Figure 5.
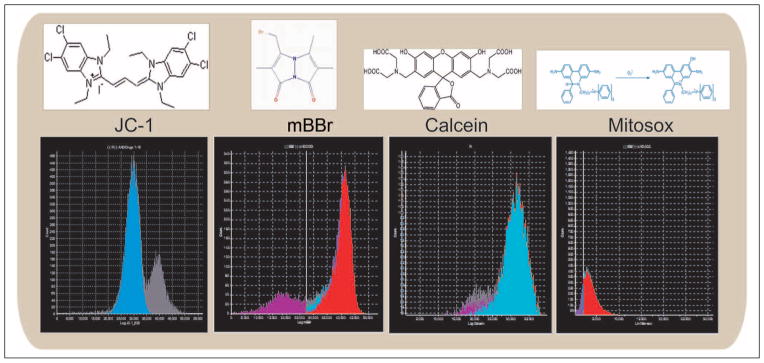
The four functional assays represented in this article. First is the JC-1 assay for mitochondrial function, followed by glutathione (mBBr), calcein, and Mitosox. Each of these biochemical assays can be reported independently for each cell in the assay.
There are no exclusions within the system as to what that functional measurement might be. For example, it could be a fluorescence intensity change (single parameter), a change in a parameter defined as a ratio of fluorescence to light-scatter intensity, or a change in the ratio of fluorescence intensities at two different wavelengths. The process for producing dose-response curves in Plate-Analyzer is shown in Figure 3, where the complete logic tree is demonstrated.
The range of concentrations, or any other set of drug treatments, can be placed into a virtual container, which is represented in the logic tree as a box with labeled drugs, each of which can have a different color for quick identification. Each container must be linked by a pipeline to a gating definition (set of binary classifiers) that identifies a population (or multiple populations) of cells for which we require an IC50 value (see Fig. 4B).
Upon completion of the pipeline, a plot is instantly created showing the dose-response curves and all the computed IC50 values of the compounds within a virtual container. More than one drug container can be linked to plotting icons so that literally hundreds of plots could be shown simultaneously as desired. Similarly, if one links all the outputs together, all the results can be exported in a single file. There are no limits to the number of plotting icons or drug containers that can be created within the system. The data shown in Figure 6 represent 96 independent IC50 curves for 32 drugs with 10-point curves on a single plate; these results are obtained in less than 1 min after completion of the flow cytometry sampling.
Figure 6.

Shown are the time plots for three different functional assays performed simultaneously on a 384-well plate containing 1 959 043 cells, and mBBr, calcein, and Mitosox dose responses to 32 drugs, each with 10-point dose responses; the IC50 curves are shown on the right. With a single protocol operating on an entire 384-well plate, all 96 IC50 curves can be reviewed within approximately 60 s from the start of the analysis. Although the time plots look very similar, they are actually different, as shown by the IC50 curves, which provide a higher resolution. To view actual IC50 values on the curves requires scrolling; however, all plots can be exported to an Excel spreadsheet.
If the model of dose response is known or it can be reasonably assumed, the curves are best fitted within the Plate- Analyzer environment using any of the standard optimization algorithms (Marquardt,49 Simplex,50 Broyden-Fletcher-Goldfarb-Shanno [BFGS],51 and Simulated Annealing52).
However, a rapid comparison of similarities between drugs defined by their response curves can be performed within PlateAnalyzer without the need for curve fitting. Measures of distance between dose-response curves such as KS distance, Kullback-Leibler (KL) divergence, or Euclidian distance can be computed directly by the logic tree applets.
Typically, the cellular responses building the dose-response curves are defined by a measure of the number of elements in the gate of interest. However, for specific applications, an alternative approach can be used, which does not require a priori cell classification. Instead, the cell populations are compared directly using either marginal distributions and the KS measure or multivariate distributions and KL divergence. The results of these comparisons (e.g., between a series of treated samples and a control) can be plotted as a response curve and processed accordingly.
Automated Sample Preparation
As has been recognized in many publications discussing high-throughput assays, one of the most important aspects of the screening has been the automation of plate preparation.53–55 Automated preparation ensures that the quality control, speed, and sample volumes are optimized and that these processes can be achieved within a short time, particularly for live-cell assays where long delays in processing may change the functional properties of cells. This has been our own experience as well. Our current automated instrumentation has used Beckman Coulter Biomek systems to prepare both chemicals and cell systems for the assays as detailed earlier in this article.
An example of data and results generated using this technology is shown in a drug screen developed using HL-60 cells. Cells were plated onto 384-well plates with test compounds added at 10-point dilutions using the Biomek FX robotic system (Beckman Coulter). Dilutions were 3-fold serial dilutions with final concentrations ranging from 300 to 0.014 μM. Compound sets were run in duplicate with four functional assays: JC-1 and three redox assays (calcein, Mitosox, and mBBr) as described earlier and shown in Figure 5. Any number of unknown compounds can be inserted into the assay design.
Discussion
We have successfully developed a visualization tool for HT flow cytometry analysis that also serves as a powerful analytical tool capable of producing heretofore unachievable data reduction performance. The process we have developed moves HT flow cytometry from the merely useful screen to the systems biology tool. The key to this transition is full automation of the data-analysis process, which places results into the hands of the scientist within minutes of the assay’s being run. This process is simple, straightforward, and fast. It is intuitive, is direct, and requires a minimal learning curve. It is the ability of this technology to translate an entire 384-well screen directly from listmode files into final results with minimal interaction on the part of the user that opens the opportunity for single-cell analysis to operate in the systems biology environment.
Challenges in Data Analysis for HT Flow Cytometry
What is unique in this process is the creation of graphic icons that link directly to the entire plate of data. For example, as can be seen in Figure 4B, each ICON represents a process of refinement within the analytical process. The power of this technology is that any ICON can be activated (clicked) and a direct representation of those data will be shown in every output component of the system. Thus, one can rapidly reveal the analyzed logic created with instant results. This includes the plate heatmap that can show as a color table either the percentage or absolute number of cells that would represent any selected criterion (such as a gated population of cells). Similarly, if a dose response is selected, the color of each drug will be shown in the histograms displayed. Finally, if appropriate, IC50 curves can be displayed, as well as simple intensity distributions for any parameter or all parameters simultaneously as desired. In addition to the standard heatmap, a 3D plot of any configuration selected can be shown at any time.
One of the most powerful aspects of this technology is the ability to view in real time the impact of changing the gate across any parameter collected in the assay. Obviously, if one selected the time parameter, it would reflect the exact collection strategy used to collect wells. They would be displayed as the cursor was moved over the time parameter scale. Similarly, this can be shown for fluorescence, allowing the user to determine where cells with fluorescence intensities below or above a cursor reside. Indeed, this parameter can be used as a gate to gate any cell greater than a certain value (e.g., presence of green fluorescent protein [GFP] or other reporter molecules where one is screening for expression). It is possible to change any gate constraints once selected and placed into the logic tree.
Complex Outputs
Flow cytometry has been shown to be an excellent primary screening tool.7,56 However, for more detailed secondary screening, the content of data required is much higher than for primary screening. Although simple up/down results in a single parameter are easy to produce, defining a complex relationship between a drug and a cell function is more difficult. Multiplexing this into several assays per well is even more complicated. This is the power of the current approach and is the very aspect that expands the opportunity for flow cytometry to become acceptable for systems biology applications. The data shown in Figure 6 represent 96 independent IC50curves for 32 drugs on a single plate; these results are obtained seamlessly from raw data. This means that the data analysis time for flow cytometry is no longer the barrier for high-throughput analysis. Furthermore, there are two types of outputs: the general response shown in the temporal traces where each drug has a specific color and the particular reaction being tested, shown as a gray trace. The very detailed response shown at the right of each temporal trace represents the specific IC50 curve for each drug. The data for each point and the specific algorithm for the IC50 calculation can be selected as desired from one of four algorithms. Regardless, the ease of providing data directly from listmode for complex assays is highly simplified using the process we have defined. Indeed, multiple statistical operators can be selected to reduce data sets in innovative ways as described above without the need for additional software. In the present implementation, IC50 results (from four possible models), as well as KS, KL divergence, and Euclidian (Eucl) distance measures can be derived from a data set in one logic process, as shown in Figure 7. Any additional algorithm can be programmed into an ICON that can be selected from the software. Multiple algorithms can be applied to the same data set simultaneously.
Figure 7.

Complex gating regimes showing a traditional IC50 measurement based on expert gating of appropriate populations of cells and measurements based on statistical methods such as Kolmogorov-Smirnov (KS), Kullback-Leibler (KL) divergence, and Euclidian (Eucl). The key difference is that none of the above uses pregated populations, allowing the option of evaluating compounds where the user has no a priori knowledge related to the biological model for any particular response. Thus, these methods allow comparison and grouping of like responses. That is to say, these are totally ungated methods of obtaining dose-response curves of the 16 drugs in this component of the assay. Four different assays are identified: JC-1, calcein, mBBr, and Mitosox, all on HL-60 cells.
General Limitations and Assumptions
Several assumptions allow this system to operate at such high speeds and with such efficiency. First is the requirement that for screening assays, all wells have the same number, order, and naming of variables collected. This allows the data matrix to be reduced to the size of the first well of data and allows all subsequent wells to have assumed variables. As a result, data reading and memory utilization are considerably accelerated. Second, although the system can accommodate any number of variables, it is more efficient if unused parameters are not saved within the original data. Thus, if only 8 variables are to be analyzed, it is inefficient to collect 20 variables; even though the extra variables do not slow down or affect the flow cytometry collection itself, they do affect the matrix size for analysis. Third, although the layout of any particular assay is not of particular consequence, it is more efficient to reproduce a specific layout so that analytical protocols can be easily reused. Fourth, there is a natural limit to the number of cells that can be analyzed simultaneously, based on the memory size of the computer. Although the software can take advantage of disk writes for excessive data size, this is not efficient in terms of speed. As a rule of thumb, for a 20-parameter listmode file with 5 million cells total, a memory size of 400 megabytes would be required. As the technology operates under a 64-bit environment, memory limitations are strictly a function of hardware, so very large arrays can be manipulated.
Key Points
The historical problem that has plagued flow cytometry since its inception is the complexity and extreme time component required to analyze data sets. If there is any justifiable criticism of flow cytometry, it is the difficulty of performing data processing in an efficient, reproducible manner. It is not unusual to spend 40 min or more analyzing 5 or 10 tubes of an assay. The reason is the almost totally vertical process that all flow cytometry software follows and that restricts the ability of users to handle very large data sets. The process we have outlined is transformative for flow cytometry in that it brings the technology into the systems biology technology zone where large data sets can be manipulated rapidly, repeatedly, and accurately. With the possibility that each 384-well plate can now be analyzed in approximately a minute, even with 10- to 20-parameter data, the ability to reduce large data sets is no longer a restriction in the flow cytometry domain. The combination of automated preparation, which is a mature technology, with automated sample collection, followed by semiautomated data processing, provides the possibility for large-scale single-cell analysis of complex multifactorial assay systems. Drug screening is one opportunity that can benefit from this approach; however, very complex immuno-assays of 40- to 60-parameter data are well within the capabilities of the PlateAnalyzer approach we have defined.
Acknowledgments
We thank Gretchen Lawler for assistance in editing this manuscript.
Funding
The authors disclosed receipt of the following financial support for the research, authorship, and/or publication of this article: Research reported in this publication was supported by the National Institute of Allergy and Infectious Diseases and the National Cancer Center of the National Institutes of Health under awards 1R56AI089511-01 and 1R33CA140084-01. The content is solely the responsibility of the authors and does not necessarily represent the official views of the National Institutes of Health. Additional support was provided by funding and hardware from Beckman Coulter, Inc., and Intellicyt, Inc.
Footnotes
Declaration of Conflicting Interests
The authors declared the following potential conflicts of interest with respect to the research, authorship, and/or publication of this article: The authors certify that all financial and material support for this research project and work are clearly identified in the manuscript.
References
- 1.Durack G, Lawler G, Kelley S, Carpenter K, Schneider D, Robinson JP. A Timely Solution for a Long List of Problems: The Chrono-Gate Method for Rapid, Time-Based Flow Cytometry Analysis. Cytometry Suppl. 1990;4:88. [Google Scholar]
- 2.Robinson JP, Durack G, Kelley S. An Innovation in Flow Cytometry Data Collection & Analysis Producing a Correlated Multiple Sample Analysis in a Single File. Cytometry. 1991;12:82–90. doi: 10.1002/cyto.990120112. [DOI] [PubMed] [Google Scholar]
- 3.Durack G, Lawler G, Kelley S, Ragheb K, Roth RA, Ganey P, Robinson JP. Time Interval Gating for Analysis of Cell Function Using Flow Cytometry. Cytometry. 1991;12:701–706. doi: 10.1002/cyto.990120803. [DOI] [PubMed] [Google Scholar]
- 4.Robinson JP, Ragheb K, Lawler G, Kelley S, Durack G. Rapid Multivariate Analysis and Display of Cross-reacting Antibodies on Human Leukocytes. Cytometry. 1992;13:75–82. doi: 10.1002/cyto.990130112. [DOI] [PubMed] [Google Scholar]
- 5.Robinson JP, Maguire DJ, King G, Kelley S, Durack G. Integration of a Barcode Reader with a Commercial Flow Cytometer. Cytometry. 1992;13:193–197. doi: 10.1002/cyto.990130214. [DOI] [PubMed] [Google Scholar]
- 6.Edwards BS, Kuckuck F, Sklar LA. Plug Flow Cytometry: An Automated Coupling Device for Rapid Sequential Flow Cytometric Sample Analysis. Cytometry. 1999;37(2):156–159. [PubMed] [Google Scholar]
- 7.Sklar LA, Carter MB, Edwards BS. Flow Cytometry for Drug Discovery, Receptor Pharmacology and High-Throughput Screening. Curr Opin Pharmacol. 2007;7(5):527–534. doi: 10.1016/j.coph.2007.06.006. [DOI] [PMC free article] [PubMed] [Google Scholar]
- 8.Bagwell CB. Breaking the Dimensionality Barrier. Methods Mol Biol. 2011;699:31–51. doi: 10.1007/978-1-61737-950-5_2. [DOI] [PubMed] [Google Scholar]
- 9.Robinson JP, Rajwa B, Patsekin V, Davisson VJ. Computational Analysis of High Throughput Flow Cytometry Data. Expert Opin Drug Discov. 2012;7(8):679–693. doi: 10.1517/17460441.2012.693475. [DOI] [PMC free article] [PubMed] [Google Scholar]
- 10.Bagwell CB, Horan PK, Lovett EJ., III BIPLOT: A Method for Displaying Multiparameter Flow Cytometric List-mode Data. Presented at the International Society for Analytical Cytology XI; Hilton Head, SC. November, 1985. [Google Scholar]
- 11.Young IT. Proof without Prejudice: Use of the Kolmogorov-Smirnov Test for the Analysis of Histograms from Flow Systems and Other Sources. J Histochem Cytochem. 1977;25(7):935. doi: 10.1177/25.7.894009. [DOI] [PubMed] [Google Scholar]
- 12.Bakker Schut TC, De Grooth BG, Greve J. Cluster Analysis of Flow Cytometric List Mode Data on a Personal Computer. Cytometry. 1993;14:649–659. doi: 10.1002/cyto.990140609. [DOI] [PubMed] [Google Scholar]
- 13.Kothari R, Cualing H, Balachander T. Neural Network Analysis of Flow Cytometry Immunophenotype Data. IEEE Trans Biomed Eng. 1996;43(8):803–810. doi: 10.1109/10.508551. [DOI] [PubMed] [Google Scholar]
- 14.Parikh HH, Li WC, Ramanathan M. Evaluation of an Alternative to the Kolmogorov-Smirnov Test for Flow Cytometric Histogram Comparisons. J Immunol Methods. 1999;229(1–2):97–105. doi: 10.1016/s0022-1759(99)00108-8. [DOI] [PubMed] [Google Scholar]
- 15.Herzenberg LA, Tung J, Moore WA, Herzenberg LA, Parks DR. Interpreting Flow Cytometry Data: A Guide for the Perplexed. Nat Immunol. 2006;7(7):681–685. doi: 10.1038/ni0706-681. [DOI] [PubMed] [Google Scholar]
- 16.Pyne S, Hu X, Wang K, Rossin E, Lin TI, Maier LM, Baecher-Allan C, McLachlan GJ, Tamayo P, Hafler DA, et al. Automated High-Dimensional Flow Cytometric Data Analysis. Proc Natl Acad Sci U S A. 2009;106(21):8519–8524. doi: 10.1073/pnas.0903028106. [DOI] [PMC free article] [PubMed] [Google Scholar]
- 17.Rajwa B, Venkatapathi M, Ragheb K, Banada PP, Hirleman ED, Lary T, Robinson JP. Automated Classification of Bacterial Particles in Flow by Multiangle Scatter Measurement and Support Vector Machine Classifier. Cytometry A. 2008;73(4):369–379. doi: 10.1002/cyto.a.20515. [DOI] [PubMed] [Google Scholar]
- 18.Krutzik PO, Nolan GP. Fluorescent Cell Barcoding in Flow Cytometry Allows High-Throughput Drug Screening and Signaling Profiling. Nat Methods. 2006;3(5):361–368. doi: 10.1038/nmeth872. [DOI] [PubMed] [Google Scholar]
- 19.Bernas T, Asem EK, Robinson JP, Rajwa B. Quadratic Form: A Robust Metric for Quantitative Comparison of Flow Cytometric Histograms. Cytometry A. 2008;73(8):715–726. doi: 10.1002/cyto.a.20586. [DOI] [PubMed] [Google Scholar]
- 20.Jeffries D, Zaidi I, de JB, Holland MJ, Miles DJ. Analysis of Flow Cytometry Data Using an Automatic Processing Tool. Cytometry A. 2008;73(9):857–867. doi: 10.1002/cyto.a.20611. [DOI] [PubMed] [Google Scholar]
- 21.Finak G, Bashashati A, Brinkman R, Gottardo R. Merging Mixture Components for Cell Population Identification in Flow Cytometry. Adv Bioinformatic. 2009;2009:247646. doi: 10.1155/2009/247646. [DOI] [PMC free article] [PubMed] [Google Scholar]
- 22.Boedigheimer MJ, Ferbas J. Mixture Modeling Approach to Flow Cytometry Data. Cytometry A. 2008;73(5):421–429. doi: 10.1002/cyto.a.20553. [DOI] [PubMed] [Google Scholar]
- 23.Collins SJ, Ruscetti FW, Gallagher RE, Gallo RC. Terminal Differentiation of Human Promyelocytic Leukemia Cells Induced by Dimethyl Sulfoxide and Other Polar Compounds. Proc Natl Acad Sci U S A. 1978;75(5):2458–2462. doi: 10.1073/pnas.75.5.2458. [DOI] [PMC free article] [PubMed] [Google Scholar]
- 24.Griffin J, Munroe D, Major P, Kufe D. Induction of Differentiation of Human Myeloid Leukemia Cells by Inhibitors of DNA Synthesis. Exp Hematol. 1982;10(9):774–781. [PubMed] [Google Scholar]
- 25.Breitman TR, Selonick SE, Collins SJ. Induction of Differentiation of the Human Promyelocytic Leukemia Cell Line (HL-60) by Retinoic Acid. Proc Natl Acad Sci U S A. 1980;77(5):2936–2940. doi: 10.1073/pnas.77.5.2936. [DOI] [PMC free article] [PubMed] [Google Scholar]
- 26.Tsiftsoglou AS, Robinson SH. Differentiation of Leukemic Cell Lines: A Review Focusing on Murine Erythroleukemia and Human HL-60 Cells. Int J Cell Cloning. 1985;3(6):349–366. doi: 10.1002/stem.5530030602. [DOI] [PubMed] [Google Scholar]
- 27.Tan S, Sagara Y, Liu Y, Maher P, Schubert D. The Regulation of Reactive Oxygen Species Production during Programmed Cell Death. J Cell Biol. 1998;141(6):1423–1432. doi: 10.1083/jcb.141.6.1423. [DOI] [PMC free article] [PubMed] [Google Scholar]
- 28.Martinou JC. Apoptosis: Key to the Mitochondrial Gate. Nature. 1999;399(6735):411–412. doi: 10.1038/20804. [DOI] [PubMed] [Google Scholar]
- 29.Kroemer G, Dallaporta B, Resche-Rigon M. The Mitochondrial Death/Life Regulator in Apoptosis and Necrosis. Annu Rev Physiol. 1998;60(1):619–642. doi: 10.1146/annurev.physiol.60.1.619. [DOI] [PubMed] [Google Scholar]
- 30.Shaulian E, Schreiber M, Piu F, Beeche M, Wagner EF, Karin M. The Mammalian UV Response: c-Jun Induction Is Required for Exit from p53-Imposed Growth Arrest. Cell. 2000;103(6):897–907. doi: 10.1016/s0092-8674(00)00193-8. [DOI] [PubMed] [Google Scholar]
- 31.Gottlieb E, Vander Heiden MG, Thompson CB. Bcl-x(L) Prevents the Initial Decrease in Mitochondrial Membrane Potential and Subsequent Reactive Oxygen Species Production during Tumor Necrosis Factor Alpha–Induced Apoptosis. Mol Cell Biol. 2000;20(15):5680–5689. doi: 10.1128/mcb.20.15.5680-5689.2000. [DOI] [PMC free article] [PubMed] [Google Scholar]
- 32.Li NY, Ragheb K, Lawler G, Sturgis J, Rajwa B, Melendez JA, Robinson JP. DPI Induces Mitochondrial Superoxide-Mediated Apoptosis. Free Radic Biol Med. 2003;34(4):465–477. doi: 10.1016/s0891-5849(02)01325-4. [DOI] [PubMed] [Google Scholar]
- 33.Tiziani S, Lodi A, Khanim FL, Viant MR, Bunce CM, Günther UL. Metabolomic Profiling of Drug Responses in Acute Myeloid Leukaemia Cell Lines. PLoS One. 2009;4(1):e4251. doi: 10.1371/journal.pone.0004251. [DOI] [PMC free article] [PubMed] [Google Scholar]
- 34.Murakami K, Kondo T, Kawase M, Li Y, Sato S, Chen SF, Chan PH. Mitochondrial Susceptibility to Oxidative Stress Exacerbates Cerebral Infarction That Follows Permanent Focal Cerebral Ischemia in Mutant Mice with Manganese Superoxide Dismutase Deficiency. J Neurosci. 1998;18(1):205–213. doi: 10.1523/JNEUROSCI.18-01-00205.1998. [DOI] [PMC free article] [PubMed] [Google Scholar]
- 35.Bindokas VP, Jordan J, Lee CC, Miller RJ. Superoxide Production in Rat Hippocampal Neurons: Selective Imaging with Hydroethidine. J Neurosci. 1996;16(4):1324–1336. doi: 10.1523/JNEUROSCI.16-04-01324.1996. [DOI] [PMC free article] [PubMed] [Google Scholar]
- 36.Rothe G, Valet G. Flow Cytometric Analysis of Respiratory Burst Activity in Phagocytes with Hydroethidine and 2′,7′-Dichlorofluorescin. J Leukocyte Biol. 1990;47:440–448. [PubMed] [Google Scholar]
- 37.Zielonka J, Hardy M, Kalyanaraman B. HPLC Study of Oxidation Products of Hydroethidine in Chemical and Biological Systems: Ramifications in Superoxide Measurements. Free Radic Biol Med. 2009;46(3):329–338. doi: 10.1016/j.freeradbiomed.2008.10.031. [DOI] [PMC free article] [PubMed] [Google Scholar]
- 38.Kroemer G, Dallaporta B, Resche-Rigon M. The Mitochondrial Death/Life Regulator in Apoptosis and Necrosis. Annu Rev Physiol. 1998;60(1):619–642. doi: 10.1146/annurev.physiol.60.1.619. [DOI] [PubMed] [Google Scholar]
- 39.Uggeri J, Gatti R, Belletti S, Scandroglio R, Corradini R, Rotoli BM, Orlandini G. Calcein-AM Is a Detector of Intracellular Oxidative Activity. Histochem Cell Biol. 2000;122(5):499–505. doi: 10.1007/s00418-004-0712-y. [DOI] [PubMed] [Google Scholar]
- 40.Hollo Z, Homolya L, Davis CW, Sarkadi B. Calcein Accumulation as a Fluorometric Functional Assay of the Multidrug Transporter. Biochim Biophys Acta. 1994;1191(2):384–388. doi: 10.1016/0005-2736(94)90190-2. [DOI] [PubMed] [Google Scholar]
- 41.Dogan AL, Legrand O, Faussat AM, Perrot JY, Marie JP. Evaluation and Comparison of MRP1 Activity with Three Fluorescent Dyes and Three Modulators in Leukemic Cell Lines. Leukemia Res. 2004;28(6):619–622. doi: 10.1016/j.leukres.2003.10.015. [DOI] [PubMed] [Google Scholar]
- 42.Cossarizza A, Baccarani-Contri M, Kalashnikova G, Franceschi C. A New Method for the Cytofluorimetric Analysis of Mitochondrial Membrane Potential Using the J-aggregate Forming Lipophilic Cation 5,5′,6,6′-tetrachloro-1,1′,3,3′-tetraethylbenzimidazolcarbocyanine Iodide (JC-1) Biochem Biophys Res Commun. 1993;197(1):40–45. doi: 10.1006/bbrc.1993.2438. [DOI] [PubMed] [Google Scholar]
- 43.Salvioli S, Ardizzoni A, Franceschi C, Cossarizza A. JC-1, but Not DiOC6(3) or Rhodamine 123, Is a Reliable Fluorescent Probe to Assess Delta Psi Changes in Intact Cells: Implications for Studies on Mitochondrial Functionality during Apoptosis. Fed Eur Biochem Soc Lett. 1997;411(1):77–82. doi: 10.1016/s0014-5793(97)00669-8. [DOI] [PubMed] [Google Scholar]
- 44.IBM Data Explorer. [Accessed March 3, 2012]; http://www.research.ibm.com/dx.
- 45.AVS Software Environment. [Accessed January 6, 2012]; http://www.avs.com/products/avs5/index.html.
- 46.Orange Software Environment. [Accessed April 4, 2012]; http://orange.biolab.si/
- 47.Bagwell CB, Adams EG. Fluorescence Spectral Overlap Compensation for Any Number of Flow Cytometry Parameters. Ann N Y Acad Sci. 1993;677:167–184. doi: 10.1111/j.1749-6632.1993.tb38775.x. [DOI] [PubMed] [Google Scholar]
- 48.Moore GE. Cramming More Components onto Integrated Circuits. Electronics Magazine. 1965;4:114–117. [Google Scholar]
- 49.Levenberg K. A Method for the Solution of Certain Nonlinear Problems in Least Squares. Q Appl Math. 1944;2(2 ):164–168. [Google Scholar]
- 50.Powell MJD. On Search Directions for Minimization Algorithms. Math Programming. 1973;4(1 ):193–201. [Google Scholar]
- 51.Avriel M. Nonlinear Programming: Analysis and Methods; Dover; New York: 2003. [Google Scholar]
- 52.Das A, Chakrabarti BK. Lecture Notes in Physics. Vol. 1. Springer-Verlag; Heidelberg, Germany: 2005. Quantum Annealing and Related Optimization Methods. [Google Scholar]
- 53.Gribbon P, Lyons R, Laflin P, Bradley J, Chambers C, Williams BS, Keighley W, Sewing A. Evaluating Real-Life High-Throughput Screening Data. J Biomol Screen. 2005;10(2 ):99–107. doi: 10.1177/1087057104271957. [DOI] [PubMed] [Google Scholar]
- 54.Hertzberg RP, Pope AJ. High-Throughput Screening: New Technology for the 21st Century. Curr Opin Chem Biol. 2000;4(4 ):445–451. doi: 10.1016/s1367-5931(00)00110-1. [DOI] [PubMed] [Google Scholar]
- 55.Michael S, Auld D, Klumpp C, Jadhav A, Zheng W, Thorne N, Austin CP, Inglese J, Simeonov A. A Robotic Platform for Quantitative High-Throughput Screening. Assay Drug Dev Technol. 2008;6(5 ):637–657. doi: 10.1089/adt.2008.150. [DOI] [PMC free article] [PubMed] [Google Scholar]
- 56.Saunders MJ, Graves SW, Sklar LA, Oprea TI, Edwards BS. High-Throughput Multiplex Flow Cytometry Screening for Botulinum Neurotoxin Type a Light Chain Protease Inhibitors. Assay Drug Dev Technol. 2010;8(1 ):37–46. doi: 10.1089/adt.2009.0219. [DOI] [PMC free article] [PubMed] [Google Scholar]