

Abstract
Background
Hypertension, hyperlipidemia and diabetes are increasingly prevalent with advancing age and have been shown to cause white matter (WM) injury which may contribute to dementia risk. However, cumulative and over time effects of these medical illnesses have not been systematically examined.
Methods
121 cognitively normal old participants received comprehensive clinical evaluations and brain diffusion tensor imaging on two occasions. Clinical history and medical treatment of diabetes, hypertension and hyperlipidemia were assessed at both evaluations. We examined whether exposure to a greater number of vascular risk factor (VRF) was associated with greater rate of WM integrity change using longitudinal differences in fractional anisotropy (FA).
Results
Compared to individuals with no VRF, individuals with 1 VRF did not exhibit significantly different change in FA. However, those with 2 VRFs or more had greater decrease in FA within multiple WM regions including the splenium of the corpus callosum.
Conclusions
The accumulation of VRF increasingly affected WM integrity, particularly in areas known to be injured in patients with mild cognitive impairment and dementia.
Keywords: Diffusion tensor imaging, Diabetes, Hypertension, Hyperlipidemia, Aging, White matter
Introduction
Hypertension (HTN), hyperlipidemia (HLD) and diabetes mellitus type II (DM) are medical illnesses common to individuals older than 60 years of age (Crawford, et al., 2010,Go, et al., 2013). Besides being major risk factors for heart disease and mortality(Alexander, et al., 2003,Chobanian, et al., 2003), the presence of these medical illnesses in middle-life are significantly associated with increased risk for later-life dementia (Kivipelto, et al., 2001a, Kivipelto, et al., 2001b, Luchsinger, et al., 2005, Whitmer, et al., 2005). While the exact cause for this association remains incompletely understood, each of these medical illnesses is also a risk factor for subclinical cerebral vascular brain injury such as white matter hyperintensities, MRI infarcts (Das, et al., 2008, Jeerakathil, et al., 2004, Prabhakaran, et al., 2008) and accelerated brain atrophy (Moran, et al., 2013, Seshadri, et al., 2004, Swan, et al., 1998). Moreover, there is pathological evidence that vascular risk factors increase the risk for later-life dementia through the additive effect of cerebrovascular to Alzheimer’s disease brain injury (Arvanitakis, et al., 2006, Schneider, et al., 2007a, Schneider, et al., 2007b, Schneider, et al., 2004, Schneider, et al., 2003). Consistent with this hypothesis, longitudinal observational studies find that white matter hyperintensities (WMH) increase in volume over time and are associated with decline in performance on both memory and executive tasks even among individuals who remain cognitively normal (Debette, et al., 2011, Maillard, et al., 2012) and the presence of extensive WMH or MRI infarcts are significantly associated with increased risk for future mild cognitive impairment and dementia (Debette, et al., 2010).
However, more recent research utilizing diffusion tensor imaging (DTI) finds that WMH are only the extreme manifestation of a more diffuse process of cerebral white matter injury (Maillard, et al., 2014). DTI is a relatively recently developed MR imaging technique that allows in vivo study of tissue microstructure. DTI is sensitive to the diffusion of water molecules in the brain. When hampered by axons and their myelin sheaths, diffusion becomes anisotropic. DTI provides multiple imaging metrics, including fractional anisotropy (FA), a normalized measure of anisotropy. While diffusion MRI technology is evolving quickly, the resolution of current DTI sequences are lower than their more conventional counterparts, and the relatively low signal-to-noise and imaging artifacts caused by the echo planar acquisition protocol require caution when interpreting images. Indeed, one critical factor that limits the sensitivity to detect changes in any longitudinal study is the reproducibility of repeated measures. Obtaining reproducible quantitative results from DTI data is not trivial given that the final results are sensitive to a large number of acquisition and analysis factors (Jones and Cercignani, 2010). In addition, DTI typically require longer acquisition times and/or specialized MRI sequences and is not routinely performed, particularly when involving older adult participants.
Despite these limitations, recent cross-sectional DTI studies find that vascular risk factors (VRFs) are associated with subtle reductions in measures of white matter (WM) integrity (Hsu, et al., 2012, Kodl, et al., 2008) even in the absence of obvious vascular brain injury including WMH (O’Sullivan, et al., 2001). Moreover, reduced white matter integrity often surrounds WMH and predicts future development and progression of WMH (Maillard, et al., 2013, Maillard, et al., 2011, Maillard, et al., 2014). In fact, recent research suggests that longitudinal DTI measures are a more sensitive and specific measure of progressive white matter injury than quantitative WMH measures from FLAIR imaging (Maillard, et al., 2014).
A key limitation to prior studies that examined the relationship between various vascular risk factors such as hypertension and brain injury or cognition, however, is that they assessed the impact of each VRF on brain injury independently. There is strong evidence that a significant proportion of individuals late in life are exposed to two or more of these conditions simultaneously (de Sereday, et al., 2004, Go, et al., 2013) and that the effect of VRFs on dementia risk is cumulative (Luchsinger, et al., 2005, Whitmer, et al., 2005). In addition, while the individual impact of HTN, HLD and DM on cross-sectional measurements of brain injury is fairly well understood, published results of longitudinal DTI studies are limited (Jovicich, et al., 2014, Teipel, et al., 2010) and none have, to our knowledge, assessed the effects of HTN, HYP and DM on longitudinal DTI-based measures of WM integrity in older adult individuals. Consequently there is a gap in our knowledge related to how vascular risk factors impact the time course of white matter integrity.
The goal of this study, therefore, was to explore, in cognitively normal older individuals, associations between patterns of co-occurring HTN, HLD, and DM history and longitudinal change in WM integrity as measured by DTI. We assessed this goal by relating cumulative exposure of HTN, HLD, and DM history to the change in fractional anisotropy (FA), a DTI-derived measure, using a sample of 121 cognitively normal older adult individuals. We chose to study cognitively normal older individuals as differences in FA measures in certain brain regions are associated with Alzheimer’s disease (Clerx, et al., 2012, Nir, et al., 2013, Teipel, et al., 2014) which might confound our understanding of the potentially subtle effects of vascular risk factors on white matter integrity.
Methods
Sample
225 community-dwelling individuals received comprehensive clinical diagnoses according to standardized criteria at the Alzheimer’s Disease Center at the University of California, Davis (UCD ADC) and brain MRI including DTI on two occasions. The present sample included individuals participating in the UCD ADC longitudinal community diversity study (Hinton, et al., 2010) who were classified as cognitively normal at baseline and follow-up based on detailed medical history, neurological examination and neuropsychological testing using the Uniform Data Set battery (Morris, et al., 2006, Weintraub, et al., 2009), resulting in a sample of 121 individuals. The presence or absence of HTN, HLD or DM was assessed for each individual based on thorough review of the participant’s medical history, medical records, and medications brought into the clinic at the time of both initial, follow-up and in between evaluations. After assessment, each individual was designated as belonging to one of 4 groups: 0, 1, 2 or 3 VRFs in accordance to their individual history of exposure to HTN, HLD or DM. Table 1 summarizes the participant characteristics.
Table 1.
Summary of participants’ characteristics. Data presented as means ±SD for continuous data or #; % for categorical data.
| All | Vascular risk factors (VRF)
|
P value | |||||
|---|---|---|---|---|---|---|---|
| 0 | 1 | 2 | 3 | ||||
| Number | 121 | 12 | 30 | 41 | 38 | – | |
|
| |||||||
| Baseline age, y | 73.9±6.6 | 71.5±5.3 | 74.5±5.7 | 75.3±7.2 | 72.8±6.6 | 0.98 | |
|
| |||||||
| Years of Education | 12.7±4.9 | 13.7±5.7 | 12.1±5.3 | 13.7±3.80 | 11.7±5.2 | 0.36 | |
|
| |||||||
| Inter-time scan interval | 3.4±1.7 | 3.8±1.4 | 3.4±1.7 | 3.6±1.8 | 3.1±1.5 | 0.24 | |
|
| |||||||
| Sex (male) | 32; 26.4 | 2; 16.7 | 13; 43.3 | 7; 17.1 | 10±26.3 | 0.077 | |
|
| |||||||
| Race | African American | 25; 20.7 | 2; 16.7 | 4; 13.3 | 7; 17.1 | 12; 31.6 | 0.24 |
| Hispanic | 46; 28.0 | 3; 25.0 | 10; 33.3 | 14; 34.1 | 19; 50.0 | 0.29 | |
| White | 50; 41.3 | 7; 58.3 | 16; 53.3 | 20; 48.8 | 7; 18.4 | 0.0067* | |
|
| |||||||
| Hypertension | 97; 80.2 | 0; 0 | 19; 63.3 | 40; 97.6 | 38; 100 | – | |
|
| |||||||
| Hyperlipidemia | 86; 71.1 | 0; 0 | 10; 33.3 | 38; 95.0 | 38; 100 | – | |
|
| |||||||
| Diabetes mellitus | 43; 35.5 | 0; 0 | 1; 3.3 | 4; 9.8 | 38; 100 | – | |
|
| |||||||
| Medication (yes) | 96; 79.3 | 2; 16.7 | 21; 70.0 | 36; 87.8 | 37; 97.4 | <0.001ζ | |
|
| |||||||
| Body Mass Index | 30.4±9.0 | 31.1±14.5 | 27.2±6.2 | 31.5±11.2 | 31.6±4.8 | 0.20 | |
|
| |||||||
| Smoking status | Non smoker | 74; 61.2 | 7; 58.3 | 20; 66.7 | 26; 63.4 | 21; 55.3 | 0.78 |
| Former smoker | 42; 34.7 | 3; 25.0 | 9; 30.0 | 14; 34.1 | 16; 42.1 | 0.63 | |
| Current smoker | 5; 4.1 | 2; 16.7 | 1; 3.3 | 1; 2.4 | 1; 2.6 | 0.15 | |
|
| |||||||
| Baseline episodic memory scores | 102.7±13.1 | 101.2±9.7 | 104.0±16.5 | 104.4±14.3 | 100.2±9.8 | 0.57 | |
|
| |||||||
| Baseline executive function scores | 102.8±13.9 | 103.4±13.7 | 106.5±16.3 | 104.0±13.1 | 98.6±12.8 | 0.12 | |
|
| |||||||
| Baseline brain matter volume (% ICV) | 79.1±4.2 | 79.1±3.6 | 78.5±4.0 | 79.8±4.3 | 78.8±4.3 | 0.83 | |
|
| |||||||
| White matter hyperintensities volume (% ICV) | 0.45±0.67 | 0.44±0.82 | 0.44±0.81 | 0.54±0.68 | 0.39±0.57 | 0.91 | |
ζ, ψ and * respectively indicate significant (<0.05) difference for post hoc pairwise comparisons, corrected for multiple comparisons using Bonferroni correction, between groups with (1) 0 and 1 VRFs, (2) 1 and 2 VRFs and (3) 2 and 3 VRFs. Executive function and episodic memory measures were obtained using the Spanish and English Neuropsychological Assessment Scales (Mungas, et al., 2004, Mungas, et al., 2005, Mungas, et al., 2000). Baseline brain matter and white matter hyperintensities volumes are expressed as ratio of intracranial volumes (ICV). Please see Supplemental Data for more detailed description of medication use.
The Institutional Review Boards at all participating institutions approved this study, and participants gave written informed consent.
Image acquisition and processing
All participants also received a standardized MRI scan of the brain at two different dates with a mean (SD) inter-scan interval of 3.4 (1.7) years. All brain imaging was performed at the University of California, Davis Imaging Research Center on a 1.5-T GE Signa Horizon LX Echospeed system. Three sequences were used: a 3-dimensional T1-weighted coronal spoiled gradient- recalled echo acquisition (3DSPGR, IR-prepped, TE = 1.9 ms, flip angle = 20°, field of view (FOV) = 24 cm, matrix = 256 × 256, 124 contiguous slices, slice thickness = 1.6 mm), an axial-oblique 2D FLAIR fast spin echo sequence (TE = 144 ms, TR = 11000 ms, TI = 2250 ms, flip angle = 90°, FOV = 22 cm, matrix = 256 × 192, contiguous slices, slice thickness = 3 mm) and DTI using the diffusion tensor weighted echo-planar sequence (TE = 94 ms, TR = 8000 ms, flip angle = 90°, FOV = 22 cm, matrix = 128 × 128, slice thickness = 5 mm). All image acquisition was performed according to previously reported methods (see Supplemental Methods). Diffusion weighted images were generated using gradients applied in six directions, repeated four times, given by (Gx,Gy,Gz) = (1,1,0), (1,−1,0), (1,0,1), (1, 0, −1), (0,1,1) (0,1,−1) with total gradient diffusion sensitivity measured at b=1000 s/mm2. Two diffusion unweighted images were also acquired. Signal to noise ratio was estimated using the diffusion unweighted images (please see Supplementary Data). All procedures described below were performed using FSL software tools (Jenkinson, et al., 2012). DTI data were corrected for eddy current-induced distortions and participant movements. FA was calculated at each image from the 3 eigenvalues of the diffusing tensor. Baseline and follow-up FA maps were computed from DTI images, aligned and subtracted to provide FA change (ΔFA) maps. ΔFA maps were then warped using linear and nonlinear transformations to a common DTI template and finally normalized by the inter scan time interval (please see Supplementary Data). To ensure the reliability of ΔFA measures, we applied the same method to a subsample of 10 young healthy individuals (mean ± SD age: 24.4 ± 1.9) who underwent 2 DTI exams (mean ± SD inter-scan interval: 1.3 ± 0.6 months) and performed, at each voxel, a linear regression with ΔFA as the dependent variable, controlling for age and gender. No voxel exhibited significant change in FA, after correcting for multiple comparisons (p<0.05, data not shown).
Segmentation of WMH was performed by a semiautomated procedure using a set of in-house computer algorithms and programs previously described (DeCarli, et al., 2005) and which demonstrate high inter-rater reliability (Carmichael, et al., 2012). Total cranial volume based on FLAIR was quantified using the Quanta 2 package of software routines according to a previously reported analysis protocol (DeCarli, et al., 2005) and was used to correct cerebral brain and WMH volumes for differences in head size.
Statistical analysis
Descriptive statistics of participant characteristics
Continuous and categorical variables were compared using Student t-test and Chi-squared tests respectively and, when significant (p<0.05), posthoc pairwise comparisons corrected for multiple comparisons using Bonferroni correction were performed between groups when comparing (1) 0 vs. 1; (2) 1 vs. 2 and (3) 2 vs. 3 VRFs.
Voxel-based analyses
The primary goal of the statistical analysis was to determine if, at the voxel level, exposure to a greater number of risk factors was associated with greater annual rate of white matter integrity change as indicated by ΔFA. To achieve this goal, we investigated group differences between individuals with (1) 0 and 1 VRF; (2) 1 and 2 VRF and (3) 2 and 3 VRF. At each voxel we performed linear regressions with ΔFA as the dependent variable and number of VRF as the independent variable of interest, with age, gender, education, smoking status (non-, former or current smoker), body mass index and baseline FA as additional nuisance covariates.
The second goal was to determine if, at the voxel level, exposure to a greater number of risk factors was associated with lesser white matter integrity at baseline as measured by baseline FA. To achieve this goal we used linear regressions with measures of baseline FA as the dependent variable and VRF group membership as described above as the independent variable of interest, with age, gender, education, smoking status and body mass index as additional nuisance covariates.
Main associations from overall multivariate models between baseline FA and ΔFA with each of the variables are illustrated in the Supplemental Figure 2 (see Supplementary Data). The T-maps obtained for longitudinal and cross sectional analyses were evaluated for statistical significance using threshold free cluster enhancement (TFCE) at the p<0.05 level and corrected for multiple comparison using permutation-based correction (please see Supplementary Data).
We then overlaid the permutation corrected T-maps onto the Johns Hopkins University probabilistic fiber map atlas (Zhang, et al., 2010), warped to the DTI template space, to provide a post hoc description of the WM tracts to which the various clusters of significant voxels most likely belonged.
In addition, because body mass index (BMI) may be associated with increased risk of the medical illnesses studied, we investigated whether BMI modulated the relationship between VRF group and FA within WM regions in which lower FA and larger annual FA losses were found associated with increasing number of VRFs. To measure this effect, we calculated the corresponding mean ΔFA and baseline FA and conducted linear regressions with baseline FA and ΔFA as the dependent variables and number of VRFs and body mass index as the independent variables of interest, as well as the interaction between the two variables, controlling for age, gender, education and smoking status for each cluster of significant voxels.
Finally, we explored whether medication treatment affected FA measures within each VRF group. Analyses revealed effects of treatments on ΔFA or baseline FA only in punctuate WM regions that did not alter the results reported below (see Supplemental Figure 3 in the Supplemental Data for these findings).
Statistical analyses were performed using R version 2.10.0 (R Development Core Team, 2009, Vienna, Austria).
Results
Demographics
The age of the sample ranged from 60 to 92 years and the majority of the participants were female with a high school education. The cohort is racially and ethnically diverse by design (Hinton, et al., 2010) and 80% of the participants suffered with one or more VRFs. Consistent with the literature, Hispanic and African American participants were more likely to have multiple VRFs as compared to Whites, particularly when comparing the prevalence of 2 VRFs versus 3 VRFs (48.8 vs. 18.4% respectively, p=0.016). There were no significant differences between the four groups under study (0, 1, 2 or 3 VRFs among HTN, HLD and DM) in terms of age, sex, smoking status, body mass index, years of education, episodic memory and executive scores, mean FA, brain matter volume, WMH volume (see Supplemental Figure 4 for an illustration of WMH spatial distribution according to VRF groups), and race. Medication use differed in the expected direction (p values <0.01, see Tables 1 and 2 in the Supplemental Data for more detailed description of medication usage).
Table 2.
Cross sectional and longitudinal associations between decreasing baseline fractional anisotropy (FA) and greater rate of FA loss (ΔFA) respectively with increasing number of vascular risk factors (VRFs). Data indicate volume (mL) of WM significantly different between comparison groups in given WM region and percentage of WM mask voxels that were significantly different between comparison groups in given WM region.
| Groups | Design | Cerebral region | Volume (mL) |
Percentage (%) | P value |
|---|---|---|---|---|---|
| 0 vs. 1 VRF | Cross sectional | WM mask | 0.06 | 100.00 | <0.001 |
| CC | 0.03 | 58.82 | <0.001 | ||
| UNC | 0.02 | 35.29 | <0.001 | ||
|
| |||||
| Longitudinal | WM mask | 0.09 | 100.00 | <0.001 | |
| CC | 0.08 | 85.71 | 0.0029 | ||
| ILF | 0.01 | 7.14 | <0.001 | ||
|
| |||||
| 1 vs. 2 VRFs | Cross sectional | WM mask | 22.72 | 100.00 | <0.001 |
| CC | 6.26 | 27.57 | <0.001 | ||
| TH | 5.59 | 24.60 | <0.001 | ||
| SAF | 3.74 | 16.48 | <0.001 | ||
| CST | 2.02 | 8.88 | 0.0020 | ||
| IFO | 1.59 | 7.01 | <0.001 | ||
| SLF | 1.38 | 6.06 | <0.001 | ||
| CGC | 1.37 | 6.03 | <0.001 | ||
| UNC | 0.72 | 3.15 | <0.001 | ||
| ILF | 0.05 | 0.21 | 0.0071 | ||
|
| |||||
| Longitudinal | WM mask | 6.01 | 100 | <0.001 | |
| CC | 2.14 | 35.60 | <0.001 | ||
| CST | 1.02 | 16.96 | <0.001 | ||
| SAF | 0.90 | 15.05 | <0.001 | ||
| TH | 0.78 | 12.91 | <0.001 | ||
| CGC | 0.70 | 11.62 | 0.0016 | ||
| SLF | 0.25 | 4.21 | <0.001 | ||
| IFO | 0.12 | 2.08 | <0.001 | ||
| UNC | 0.08 | 1.40 | 0.0014 | ||
| ILF | 0.01 | 0.17 | 0.0048 | ||
|
| |||||
| 2 vs. 3 VRFs | Cross sectional | WM mask | 2.07 | 100.00 | <0.001 |
| CC | 1.61 | 77.65 | <0.001 | ||
| CGC | 0.46 | 22.35 | <0.001 | ||
|
| |||||
| Longitudinal | WM mask | 31.91 | 100.00 | <0.001 | |
| CC | 12.81 | 40.16 | <0.001 | ||
| CGC | 4.20 | 13.16 | <0.001 | ||
| SAF | 3.81 | 11.94 | <0.001 | ||
| TH | 3.50 | 10.96 | <0.001 | ||
| SLF | 2.73 | 8.55 | <0.001 | ||
| CST | 2.25 | 7.07 | 0.0015 | ||
| IFO | 1.07 | 3.35 | <0.001 | ||
| UNC | 0.89 | 2.78 | 0.0014 | ||
| ILF | 0.65 | 2.03 | <0.001 | ||
CC: corpus callosum; SAF: short association fibers; TH: thalamic radiations; CST: corticospinal tracts; CGC: Cingulum; SLF: superior longitudinal fasciculus; IFO: inferior fronto-occipital tracts.
Distribution of hypertension, hyperlipidemia and diabetes history and medication use across VRFs groups
Upon review of this categorization scheme, we noted that hypertension was the most common vascular risk in isolation, i.e within the group with 1 VRF (63%). The group with 2 VRFs was mostly composed of individuals with a combined history of hypertension and hyperlipidemia (90%, see Table 1). Interestingly, this distribution of VRFs corresponds to the most frequent profile for older and cognitively normal individuals reported in the literature (Davis, et al., 2011, Fryar, et al., 2010). Among individuals with 0 VRFs, two were found to use medications that would affect blood pressure without history or evidence of hypertension suggesting an alternative use for these medications. Among individuals with 1 VRF, 9 were treated neither for hypertension, hyperlipidemia nor diabetes, and 13 were under treatment for hypertension. Of the 41 individuals with 2 VRFs, 21 were treated for both hypertension and hyperlipidemia and 11 for hypertension only. Finally, 23 of the 38 individuals with a history of hypertension, hyperlipidemia and diabetes received treatments for all 3 medical conditions (see Table 1 and Table 2 in the Supplemental Data for more detailed description of medication use).
0 vs. 1 vascular risk factor
Compared to controls, individuals with a history of single VRF differed in FA values at baseline in only areas areas (see Figures 1 and 2) covering 0.06 mL of the WM and located mostly in the corpus callosum (CC) region (see Table 2). Those with 1 VRF also had greater FA decline over time (see Figures 1 and 2) in similarly small regions covering only 0.9 mL of the WM (see Table 2).
Figure 1.
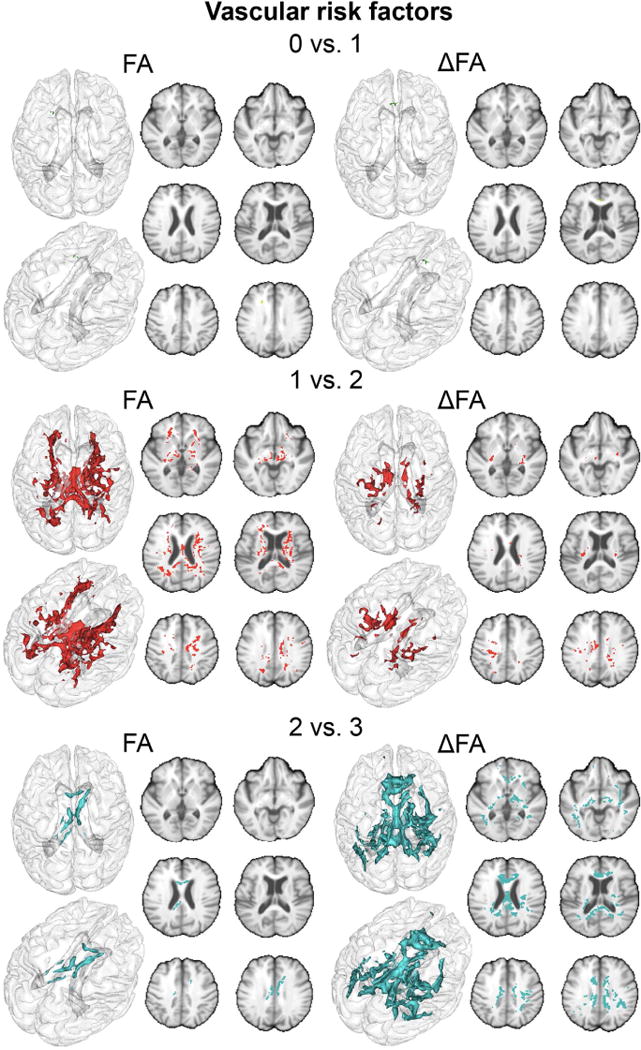
Regions of the cerebral white matter in which lower FA and larger annual FA losses are significantly associated with increasing number of vascular risks (VRFs) (green: 0 vs. 1 VRF, red: 1 vs. 2 VRFs and blue: 2 vs. 3 VRFs).
Figure 2.
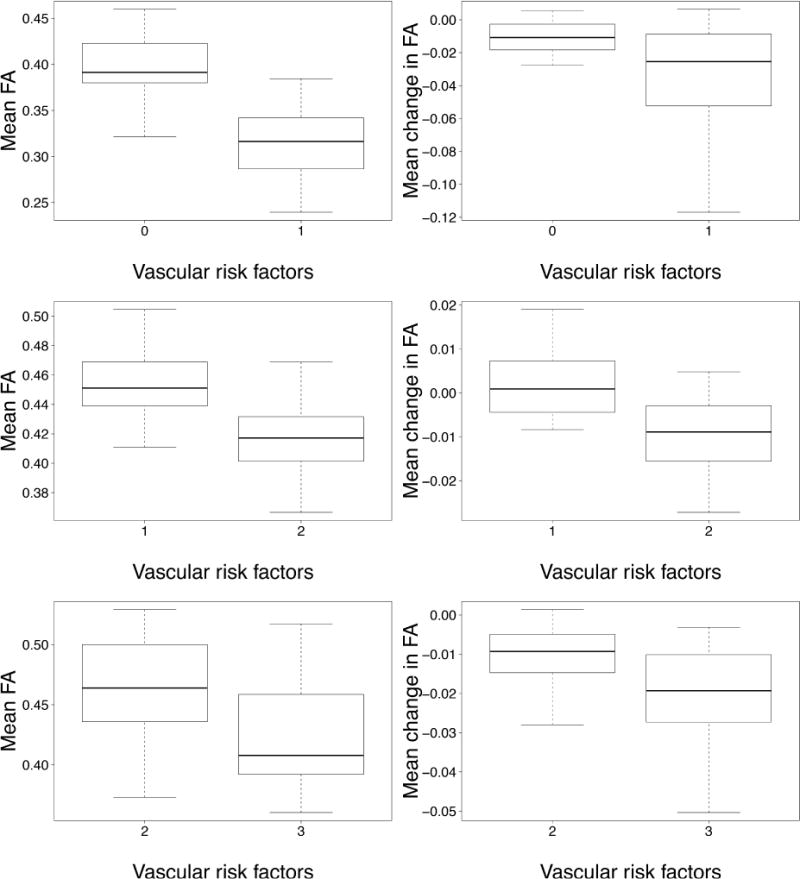
Boxplot of mean FA and annual change in FA computed in regions significantly associated with increasing number of vascular risks (VRFs)
1 vs. 2 vascular risk factors
Individuals with 2 VRFs showed lower FA values at baseline in a larger (22.72 mL) volume of cerebral WM (see Figures 1 and 2) compared to those with 1 VRF. The CC and thalamic radiations were the most heavily involved WM tracts in this comparison (6.26 and 5.59 mL respectively, see Table 2). Those with 2 VRFs also had greater FA reductions over time (see Figures 1 and 2) within voxels covering 6.01 mL of the WM. Again, the CC was the most heavily involved tract (2.14 mL, equivalent to 36% of significant voxels, see Table 2).
2 vs. 3 vascular risk factors
Compared to individuals with 2 VRFs, those with an additional VRF had lower FA values at baseline (see Figures 1 and 2) within voxels covering 2.07 mL of the WM including 1.61 mL of the CC (see Table 2). These individuals also experienced greater reduction in FA values over time within voxels that covered 31.9 mL of the WM (see Figures 1 and 2). The CC was particularly prone to greater FA reductions in this group (12.81 mL, equivalent to 40% of significant voxels, see Table 2).
Interaction between VRFs number and body mass index
The associations between both baseline FA and ΔFA and increased number of VRFs were not found to be modulated by the body mass index except in the CC and the superior longitudinal fasciculus regions where the association between an increase in VRF number from 1 to 2 was found to be accentuated with increasing body mass index (p=0.027 and p=0.035 respectively, see Supplemental Table 3).
Discussion
Our results reveal three important findings. First, among cognitively healthy older adult individuals with generally average exposure to various VRFs, a prior history of only one VRF among hypertension (approximately 60%), hyperlipidemia (approximately 35%), or diabetes was associated with extremely mild exacerbation of age-related WM integrity loss. Second, as compared with individuals with only one VRF, additional VRFs were associated with greater WM integrity loss over time within a substantial portion of the WM. Third, while we had limited power to assess the impact of medical treatment on baseline and longitudinal change in FA, results showed only small differences that suggested lower FA integrity for those being treated. From these findings we concluded that medical treatment may be an indicator of worse severity as suggested by the literature (Wolf, et al., 1991). Taken together, these longitudinal findings strengthen evidence that greater VRF exposure is associated with poorer trajectories of brain health late in life (Luchsinger, et al., 2005, Whitmer, et al., 2005). These results also emphasize the fact that VRFs often occur in conjunction (Davis, et al., 2011, Fryar, et al., 2010) and that it is this co-occurrence that is likely to have the greatest impact on brain structure and function (Luchsinger, et al., 2005, Whitmer, et al., 2005), particularly when diabetes is present (Luchsinger, et al., 2005).
Because progression of WM injury is accompanied by concomitant decline in cognitive performance (Maillard, et al., 2012), it is crucial to determine how VRFs impact WM integrity and may be differentially associated with accelerated WM degeneration. The present work revealed that a prior history of only one VRF explained only limited variability in microstructural WM integrity. This finding may reflect the fact that our subgroup with one VRF, mostly consisting of isolated HTN, had either relatively mild hypertension or a relatively limited duration of exposure, or both. We base this conclusion on data from prior reports which show that older adult individuals who experience prolonged exposure to HTN (such as those with a history of midlife HTN) show significantly poorer brain structure and function (Swan, et al., 1998).
Unlike isolated HTN, the co-occurrence of two VRFs appears to have a strong negative effect on WM integrity. Individuals in this subgroup predominantly had a prior combined history of HTN and HLD (90%, see Table 1). Like HTN, HLD is independently associated with elevated risk of cognitive decline, dementia and Alzheimer’s disease (Anstey, et al., 2008, Blom, et al., 2013). Our data suggests that in the context of HTN, HLD appears to have especially serious effects on WM integrity. This finding parallels findings of previous observational prospective studies that did not find a consistent relationship between cholesterol levels and incidence of stroke, except in individuals with risk factors for cardiovascular disease (including hypertension) (Borghi, 2002). While this interaction between HLD and HTN is poorly understood in the context of small cerebral vessels thought to be involved in WM injury, much more is known about their effects on larger cerebral vessels. Briefly, the mechanisms of interaction between HLD and HTN may contribute to increased vessel wall shear stresses, resulting in endothelial dysfunction and increased oxidative stress of the intrarenal renin-angiotensin system (Singh and Mehta, 2003). Such endothelial dysfunction represents a key early step in the development of atherosclerosis, with elevated cholesterol representing another key contributor (Hadi, et al., 2005). Additional work is needed to understand WM vulnerability related to HLD-HTN co-occurrence highlighted in the present work.
Because the frequency of individuals with DM history in the group with 2 VRFs was extremely low (n=4 out of 41), we presumed that differences observed between this group and that combining the triad of HTN, HLD and DM history (n=38) was explained predominantly by the additional effect of DM. It is widely recognized that DM is associated with increased risk for cerebrovascular disease and mortality (Go, et al., 2013) and recent studies suggested that arterial stiffness may play an important role in linking diabetes with CVD (de Oliveira Alvim, et al., 2013, Stehouwer, et al., 2008). Complementary to two recent cross-sectional DTI studies suggesting that DM may injure WM in restricted brain regions (Hsu, et al., 2012, Yau, et al., 2013) among individuals in their fifth and sixth decades of life, the present study suggests that, ten to twenty years later in the lifespan, individuals with a history of DM may exhibit ongoing decrements in WM integrity in large areas of the CC, and may support previous findings that reported an association between DM and cognition only in individuals of 60 years of age and older (Biessels, et al., 2008, Xu, et al., 2009). Interestingly, the main effect of DM in the context of combined HLD and HTN was to extend the spatial extent of WM damage, but not to increase the magnitude of change in regions that were damaged in individuals who, for the most part, exhibited the combination of HLD and HTN. DM may enhance arterial stiffness through pathological changes in the vascular bed, such as reduced nitric oxide bioavailability, chronic low-grade inflammation, increased sympathetic tone and changes in type or structure of elastin and/or collagen in the arterial wall (de Oliveira Alvim, et al., 2013). The diabetic state is also typified by an increased tendency for oxidative stress and high levels of oxidized lipoproteins, especially the so-called small, dense low-density lipoprotein (Hadi, et al., 2005). DM, when combined with HTN and HLD, likely worsens the effects on endothelial adhesiveness and its consequences. Additional studies are needed to understand the chronology and factors linking the combined effects of these risk factors on arterial aging, microvascular damage and WM injury.
We found that compared to other WM pathways, the CC was differentially vulnerable to the effects of co-occurring VRFs. This structure has a unique myelination pattern that includes small diameter fibers most frequent in the anterior CC (genu) which myelinates much later in normal development, in conjunction with fibers of large diameter, especially in the splenium that myelinate early in development. Several cross-sectional studies have found an association between altered diffusivity measures in CC with global cognitive function, AD and MCI (Chua, et al., 2008), emphasizing the need of understanding the biological mechanisms that result in associations between VRFs and microstructural integrity of CC most specifically. Importantly, our findings of preferential impact in posterior white matter tracts is consistent with recent cortical thickness studies that find reduced thickness due to VRFs in regions vulnerable to the AD process (Villeneuve, et al., 2014).
Study Limitations
Our study, however, is not without some limitations. First, we examined only the cumulative impact of HTN, HDL and DM and did not include co-occurring vascular disease such coronary artery disease or stroke which can accompany these medical illnesses. In addition, we did not measure potential modifying behaviors such as exercise, diet or weight control. While the present study aimed to focus on biological rather than behavioral measures, including such measures may be of interest for future studies with larger sample sizes. In addition, while medication use was collected at each visit, we did not have the number of participants in this study to effectively examine the impact of medication, isolated or in combination, on white matter integrity measures across VRFs groups, with the exception of individuals with 1 VRF treated or not for hypertension and individuals with 2 VRFs treated for both hypertension and hyperlipidemia or for hypertension only (see Supplemental Data). Finally, although supported by visual inspection, the superposition with JHU map indicated that CC appears to be the WM region the most implicated in the associations but only provided a posthoc quantitative description that highly relies on the warping process. To bypass this limitation and comfort the present findings, further studies may use tractography which, although relying on registration of specific a priori regions of interest or specific tracts into the subject DTI space, uses the more anisotropic tensors to form streamlines of tensors leading to estimations of white matter fiber tracts.
Summary/Conclusions
This is one of very few studies of longitudinal DTI change in the older adults. It is unclear whether differences in microstructural WM trajectories associated with hypertension, hyperlipidemia and diabetes are preventable, but the current study emphasizes the importance of early management of these medical illnesses as a possible preventive strategy against white matter integrity loss in late life, in addition to the recognized benefits of treatment on cardio- and cerebrovascular events (Chobanian, et al., 2003, Collins, et al., 2004).
Supplementary Material
We explore effects of vascular risk factors (VRFs) on white matter integrity change
VRFs include hypertension, hyperlipidemia and diabetes mellitus type II
Diffusion tensor imaging derived measure is used to describe white matter integrity
Accumulation of VRFs affect both baseline and change in white matter integrity
Injured regions are known to be involved in mild cognitive impairment and dementia
Acknowledgments
Source of Funding: The study was supported by NIH grants R01AG010220, R01AG031563 and P30AG010129
Footnotes
Publisher's Disclaimer: This is a PDF file of an unedited manuscript that has been accepted for publication. As a service to our customers we are providing this early version of the manuscript. The manuscript will undergo copyediting, typesetting, and review of the resulting proof before it is published in its final citable form. Please note that during the production process errors may be discovered which could affect the content, and all legal disclaimers that apply to the journal pertain.
Conflict of Interest/Disclosure: The authors report no actual or potential conflicts of interest in relation to this manuscript.
References
- Alexander CM, Landsman PB, Teutsch SM, Haffner SM, Third National, H., Nutrition Examination, S. et al. NCEP-defined metabolic syndrome, diabetes, and prevalence of coronary heart disease among NHANES III participants age 50 years and older. Diabetes. 2003;52(5):1210–4. doi: 10.2337/diabetes.52.5.1210. [DOI] [PubMed] [Google Scholar]
- Anstey KJ, Lipnicki DM, Low LF. Cholesterol as a risk factor for dementia and cognitive decline: a systematic review of prospective studies with meta-analysis. Am J Geriatr Psychiatry. 2008;16(5):343–54. doi: 10.1097/JGP.0b013e31816b72d4. [DOI] [PubMed] [Google Scholar]
- Arvanitakis Z, Schneider JA, Wilson RS, Li Y, Arnold SE, Wang Z, et al. Diabetes is related to cerebral infarction but not to AD pathology in older persons. Neurology. 2006;67(11):1960–5. doi: 10.1212/01.wnl.0000247053.45483.4e. [DOI] [PubMed] [Google Scholar]
- Biessels GJ, Deary IJ, Ryan CM. Cognition and diabetes: a lifespan perspective. Lancet neurology. 2008;7(2):184–90. doi: 10.1016/S1474-4422(08)70021-8. [DOI] [PubMed] [Google Scholar]
- Blom K, Emmelot-Vonk MH, Koek HD. The influence of vascular risk factors on cognitive decline in patients with dementia: a systematic review. Maturitas. 2013;76(2):113–7. doi: 10.1016/j.maturitas.2013.06.011. [DOI] [PubMed] [Google Scholar]
- Borghi C. Interactions between hypercholesterolemia and hypertension: implications for therapy. Current opinion in nephrology and hypertension. 2002;11(5):489–96. doi: 10.1097/00041552-200209000-00003. [DOI] [PubMed] [Google Scholar]
- Carmichael O, Mungas D, Beckett L, Harvey D, Tomaszewski Farias S, Reed B, et al. MRI predictors of cognitive change in a diverse and carefully characterized elderly population. Neurobiol Aging. 2012;33(1):83–95. doi: 10.1016/j.neurobiolaging.2010.01.021. [DOI] [PMC free article] [PubMed] [Google Scholar]
- Chobanian AV, Bakris GL, Black HR, Cushman WC, Green LA, Izzo JL, Jr, et al. The Seventh Report of the Joint National Committee on Prevention, Detection, Evaluation, and Treatment of High Blood Pressure: the JNC 7 report. JAMA. 2003;289(19):2560–72. doi: 10.1001/jama.289.19.2560. [DOI] [PubMed] [Google Scholar]
- Chua TC, Wen W, Slavin MJ, Sachdev PS. Diffusion tensor imaging in mild cognitive impairment and Alzheimer’s disease: a review. Current opinion in neurology. 2008;21(1):83–92. doi: 10.1097/WCO.0b013e3282f4594b. [DOI] [PubMed] [Google Scholar]
- Clerx L, Visser PJ, Verhey F, Aalten P. New MRI markers for Alzheimer’s disease: a meta-analysis of diffusion tensor imaging and a comparison with medial temporal lobe measurements. J Alzheimers Dis. 2012;29(2):405–29. doi: 10.3233/JAD-2011-110797. [DOI] [PubMed] [Google Scholar]
- Collins R, Armitage J, Parish S, Sleight P, Peto R, Heart Protection Study Collaborative, G Effects of cholesterol-lowering with simvastatin on stroke and other major vascular events in 20536 people with cerebrovascular disease or other high-risk conditions. Lancet. 2004;363(9411):757–67. doi: 10.1016/S0140-6736(04)15690-0. [DOI] [PubMed] [Google Scholar]
- Crawford AG, Cote C, Couto J, Daskiran M, Gunnarsson C, Haas K, et al. Prevalence of obesity, type II diabetes mellitus, hyperlipidemia, and hypertension in the United States: findings from the GE Centricity Electronic Medical Record database. Population health management. 2010;13(3):151–61. doi: 10.1089/pop.2009.0039. [DOI] [PubMed] [Google Scholar]
- Das RR, Seshadri S, Beiser AS, Kelly-Hayes M, Au R, Himali JJ, et al. Prevalence and correlates of silent cerebral infarcts in the Framingham offspring study. Stroke. 2008;39(11):2929–35. doi: 10.1161/STROKEAHA.108.516575. [DOI] [PMC free article] [PubMed] [Google Scholar]
- Davis JW, Chung R, Juarez DT. Prevalence of comorbid conditions with aging among patients with diabetes and cardiovascular disease. Hawaii medical journal. 2011;70(10):209–13. [PMC free article] [PubMed] [Google Scholar]
- de Oliveira Alvim R, Santos PC, Musso MM, de Sa Cunha R, Krieger JE, Mill JG, et al. Impact of diabetes mellitus on arterial stiffness in a representative sample of an urban Brazilian population. Diabetology & metabolic syndrome. 2013;5(1):45. doi: 10.1186/1758-5996-5-45. [DOI] [PMC free article] [PubMed] [Google Scholar]
- de Sereday MS, Gonzalez C, Giorgini D, De Loredo L, Braguinsky J, Cobenas C, et al. Prevalence of diabetes, obesity, hypertension and hyperlipidemia in the central area of Argentina. Diabetes & metabolism. 2004;30(4):335–9. doi: 10.1016/s1262-3636(07)70125-8. [DOI] [PubMed] [Google Scholar]
- Debette S, Beiser A, DeCarli C, Au R, Himali JJ, Kelly-Hayes M, et al. Association of MRI markers of vascular brain injury with incident stroke, mild cognitive impairment, dementia, and mortality: the Framingham Offspring Study. Stroke. 2010;41(4):600–6. doi: 10.1161/STROKEAHA.109.570044. [DOI] [PMC free article] [PubMed] [Google Scholar]
- Debette S, Seshadri S, Beiser A, Au R, Himali JJ, Palumbo C, et al. Midlife vascular risk factor exposure accelerates structural brain aging and cognitive decline. Neurology. 2011;77(5):461–8. doi: 10.1212/WNL.0b013e318227b227. [DOI] [PMC free article] [PubMed] [Google Scholar]
- DeCarli C, Fletcher E, Ramey V, Harvey D, Jagust WJ. Anatomical mapping of white matter hyperintensities (WMH): exploring the relationships between periventricular WMH, deep WMH, and total WMH burden. Stroke. 2005;36(1):50–5. doi: 10.1161/01.STR.0000150668.58689.f2. [DOI] [PMC free article] [PubMed] [Google Scholar]
- Fryar CD, Hirsch R, Eberhardt MS, Yoon SS, Wright JD. Hypertension, high serum total cholesterol, and diabetes: racial and ethnic prevalence differences in U.S. adults, 1999–2006. NCHS data brief. 2010;36:1–8. [PubMed] [Google Scholar]
- Go AS, Mozaffarian D, Roger VL, Benjamin EJ, Berry JD, Borden WB, et al. Heart disease and stroke statistics–2013 update: a report from the American Heart Association. Circulation. 2013;127(1):e6–e245. doi: 10.1161/CIR.0b013e31828124ad. [DOI] [PMC free article] [PubMed] [Google Scholar]
- Hadi HA, Carr CS, Al Suwaidi J. Endothelial dysfunction: cardiovascular risk factors, therapy, and outcome. Vascular health and risk management. 2005;1(3):183–98. [PMC free article] [PubMed] [Google Scholar]
- Hinton L, Carter K, Reed BR, Beckett L, Lara E, DeCarli C, et al. Recruitment of a community-based cohort for research on diversity and risk of dementia. Alzheimer Dis Assoc Disord. 2010;24(3):234–41. doi: 10.1097/WAD.0b013e3181c1ee01. [DOI] [PMC free article] [PubMed] [Google Scholar]
- Hsu JL, Chen YL, Leu JG, Jaw FS, Lee CH, Tsai YF, et al. Microstructural white matter abnormalities in type 2 diabetes mellitus: a diffusion tensor imaging study. Neuroimage. 2012;59(2):1098–105. doi: 10.1016/j.neuroimage.2011.09.041. [DOI] [PubMed] [Google Scholar]
- Jeerakathil T, Wolf PA, Beiser A, Massaro J, Seshadri S, D’Agostino RB, et al. Stroke risk profile predicts white matter hyperintensity volume: the Framingham Study. Stroke. 2004;35(8):1857–61. doi: 10.1161/01.STR.0000135226.53499.85. [DOI] [PubMed] [Google Scholar]
- Jenkinson M, Beckmann CF, Behrens TE, Woolrich MW, Smith SM. Fsl. Neuroimage. 2012;62(2):782–90. doi: 10.1016/j.neuroimage.2011.09.015. [DOI] [PubMed] [Google Scholar]
- Jones DK, Cercignani M. Twenty-five pitfalls in the analysis of diffusion MRI data. NMR Biomed. 2010;23(7):803–20. doi: 10.1002/nbm.1543. [DOI] [PubMed] [Google Scholar]
- Jovicich J, Marizzoni M, Bosch B, Bartres-Faz D, Arnold J, Benninghoff J, et al. Multisite longitudinal reliability of tract-based spatial statistics in diffusion tensor imaging of healthy elderly subjects. Neuroimage. 2014;101C:390–403. doi: 10.1016/j.neuroimage.2014.06.075. [DOI] [PubMed] [Google Scholar]
- Kivipelto M, Helkala EL, Hanninen T, Laakso MP, Hallikainen M, Alhainen K, et al. Midlife vascular risk factors and late-life mild cognitive impairment: A population-based study. Neurology. 2001a;56(12):1683–9. doi: 10.1212/wnl.56.12.1683. [DOI] [PubMed] [Google Scholar]
- Kivipelto M, Helkala EL, Laakso MP, Hanninen T, Hallikainen M, Alhainen K, et al. Midlife vascular risk factors and Alzheimer’s disease in later life: longitudinal, population based study. BMJ. 2001b;322(7300):1447–51. doi: 10.1136/bmj.322.7300.1447. [DOI] [PMC free article] [PubMed] [Google Scholar]
- Kodl CT, Franc DT, Rao JP, Anderson FS, Thomas W, Mueller BA, et al. Diffusion tensor imaging identifies deficits in white matter microstructure in subjects with type 1 diabetes that correlate with reduced neurocognitive function. Diabetes. 2008;57(11):3083–9. doi: 10.2337/db08-0724. [DOI] [PMC free article] [PubMed] [Google Scholar]
- Luchsinger JA, Reitz C, Honig LS, Tang MX, Shea S, Mayeux R. Aggregation of vascular risk factors and risk of incident Alzheimer disease. Neurology. 2005;65(4):545–51. doi: 10.1212/01.wnl.0000172914.08967.dc. [DOI] [PMC free article] [PubMed] [Google Scholar]
- Maillard P, Carmichael O, Fletcher E, Reed B, Mungas D, Decarli C. Coevolution of white matter hyperintensities and cognition in the elderly. Neurology. 2012;79(5):442–8. doi: 10.1212/WNL.0b013e3182617136. [DOI] [PMC free article] [PubMed] [Google Scholar]
- Maillard P, Carmichael O, Harvey D, Fletcher E, Reed B, Mungas D, et al. FLAIR and diffusion MRI signals are independent predictors of white matter hyperintensities. AJNR Am J Neuroradiol. 2013;34(1):54–61. doi: 10.3174/ajnr.A3146. [DOI] [PMC free article] [PubMed] [Google Scholar]
- Maillard P, Fletcher E, Harvey D, Carmichael O, Reed B, Mungas D, et al. White matter hyperintensity penumbra. Stroke. 2011;42(7):1917–22. doi: 10.1161/STROKEAHA.110.609768. [DOI] [PMC free article] [PubMed] [Google Scholar]
- Maillard P, Fletcher E, Lockhart SN, Roach AE, Reed B, Mungas D, et al. White Matter Hyperintensities and Their Penumbra Lie Along a Continuum of Injury in the Aging Brain. Stroke. 2014;45(6):1721–6. doi: 10.1161/STROKEAHA.113.004084. [DOI] [PMC free article] [PubMed] [Google Scholar]
- Moran C, Phan TG, Chen J, Blizzard L, Beare R, Venn A, et al. Brain Atrophy in Type 2 Diabetes: Regional distribution and influence on cognition. Diabetes Care. 2013;36(12):4036–42. doi: 10.2337/dc13-0143. [DOI] [PMC free article] [PubMed] [Google Scholar]
- Morris JC, Weintraub S, Chui HC, Cummings J, Decarli C, Ferris S, et al. The Uniform Data Set (UDS): Clinical and Cognitive Variables and Descriptive Data From Alzheimer Disease Centers. Alzheimer Dis Assoc Disord. 2006;20(4):210–6. doi: 10.1097/01.wad.0000213865.09806.92. [DOI] [PubMed] [Google Scholar]
- Mungas D, Reed BR, Crane PK, Haan MN, Gonzalez H. Spanish and English Neuropsychological Assessment Scales (SENAS): further development and psychometric characteristics. Psychol Assess. 2004;16(4):347–59. doi: 10.1037/1040-3590.16.4.347. [DOI] [PubMed] [Google Scholar]
- Mungas D, Reed BR, Haan MN, Gonzalez H. Spanish and English neuropsychological assessment scales: relationship to demographics, language, cognition, and independent function. Neuropsychology. 2005;19(4):466–75. doi: 10.1037/0894-4105.19.4.466. [DOI] [PubMed] [Google Scholar]
- Mungas D, Reed BR, Marshall SC, Gonzalez HM. Development of psychometrically matched English and Spanish language neuropsychological tests for older persons. Neuropsychology. 2000;14(2):209–23. doi: 10.1037//0894-4105.14.2.209. [DOI] [PubMed] [Google Scholar]
- Nir TM, Jahanshad N, Villalon-Reina JE, Toga AW, Jack CR, Weiner MW, et al. Effectiveness of regional DTI measures in distinguishing Alzheimer’s disease, MCI, and normal aging. NeuroImage Clinical. 2013;3:180–95. doi: 10.1016/j.nicl.2013.07.006. [DOI] [PMC free article] [PubMed] [Google Scholar]
- O’Sullivan M, Summers PE, Jones DK, Jarosz JM, Williams SC, Markus HS. Normal-appearing white matter in ischemic leukoaraiosis: a diffusion tensor MRI study. Neurology. 2001;57(12):2307–10. doi: 10.1212/wnl.57.12.2307. [DOI] [PubMed] [Google Scholar]
- Prabhakaran S, Wright CB, Yoshita M, Delapaz R, Brown T, DeCarli C, et al. Prevalence and determinants of subclinical brain infarction: the Northern Manhattan Study. Neurology. 2008;70(6):425–30. doi: 10.1212/01.wnl.0000277521.66947.e5. [DOI] [PMC free article] [PubMed] [Google Scholar]
- Schneider JA, Arvanitakis Z, Bang W, Bennett DA. Mixed brain pathologies account for most dementia cases in community-dwelling older persons. Neurology. 2007a;69(24):2197–204. doi: 10.1212/01.wnl.0000271090.28148.24. [DOI] [PubMed] [Google Scholar]
- Schneider JA, Boyle PA, Arvanitakis Z, Bienias JL, Bennett DA. Subcortical infarcts, Alzheimer’s disease pathology, and memory function in older persons. Ann Neurol. 2007b;62(1):59–66. doi: 10.1002/ana.21142. [DOI] [PubMed] [Google Scholar]
- Schneider JA, Wilson RS, Bienias JL, Evans DA, Bennett DA. Cerebral infarctions and the likelihood of dementia from Alzheimer disease pathology. Neurology. 2004;62(7):1148–55. doi: 10.1212/01.wnl.0000118211.78503.f5. [DOI] [PubMed] [Google Scholar]
- Schneider JA, Wilson RS, Cochran EJ, Bienias JL, Arnold SE, Evans DA, et al. Relation of cerebral infarctions to dementia and cognitive function in older persons. Neurology. 2003;60(7):1082–8. doi: 10.1212/01.wnl.0000055863.87435.b2. [DOI] [PubMed] [Google Scholar]
- Seshadri S, Wolf PA, Beiser A, Elias MF, Au R, Kase CS, et al. Stroke risk profile, brain volume, and cognitive function: the Framingham Offspring Study. Neurology. 2004;63(9):1591–9. doi: 10.1212/01.wnl.0000142968.22691.70. [DOI] [PubMed] [Google Scholar]
- Singh BM, Mehta JL. Interactions between the renin-angiotensin system and dyslipidemia: relevance in the therapy of hypertension and coronary heart disease. Arch Intern Med. 2003;163(11):1296–304. doi: 10.1001/archinte.163.11.1296. [DOI] [PubMed] [Google Scholar]
- Stehouwer CD, Henry RM, Ferreira I. Arterial stiffness in diabetes and the metabolic syndrome: a pathway to cardiovascular disease. Diabetologia. 2008;51(4):527–39. doi: 10.1007/s00125-007-0918-3. [DOI] [PubMed] [Google Scholar]
- Swan GE, DeCarli C, Miller BL, Reed T, Wolf PA, Jack LM, et al. Association of midlife blood pressure to late-life cognitive decline and brain morphology. Neurology. 1998;51(4):986–93. doi: 10.1212/wnl.51.4.986. [DOI] [PubMed] [Google Scholar]
- Teipel SJ, Grothe MJ, Filippi M, Fellgiebel A, Dyrba M, Frisoni GB, et al. Fractional anisotropy changes in Alzheimer’s disease depend on the underlying fiber tract architecture: a multiparametric DTI study using joint independent component analysis. J Alzheimers Dis. 2014;41(1):69–83. doi: 10.3233/JAD-131829. [DOI] [PubMed] [Google Scholar]
- Teipel SJ, Meindl T, Wagner M, Stieltjes B, Reuter S, Hauenstein KH, et al. Longitudinal changes in fiber tract integrity in healthy aging and mild cognitive impairment: a DTI follow-up study. J Alzheimers Dis. 2010;22(2):507–22. doi: 10.3233/JAD-2010-100234. [DOI] [PubMed] [Google Scholar]
- Villeneuve S, Reed BR, Madison CM, Wirth M, Marchant NL, Kriger S, et al. Vascular risk and Abeta interact to reduce cortical thickness in AD vulnerable brain regions. Neurology. 2014;83(1):40–7. doi: 10.1212/WNL.0000000000000550. [DOI] [PMC free article] [PubMed] [Google Scholar]
- Weintraub S, Salmon D, Mercaldo N, Ferris S, Graff-Radford NR, Chui H, et al. The Alzheimer’s Disease Centers’ Uniform Data Set (UDS): the neuropsychologic test battery. Alzheimer Dis Assoc Disord. 2009;23(2):91–101. doi: 10.1097/WAD.0b013e318191c7dd. [DOI] [PMC free article] [PubMed] [Google Scholar]
- Whitmer RA, Sidney S, Selby J, Johnston SC, Yaffe K. Midlife cardiovascular risk factors and risk of dementia in late life. Neurology. 2005;64(2):277–81. doi: 10.1212/01.WNL.0000149519.47454.F2. [DOI] [PubMed] [Google Scholar]
- Wolf PA, D’Agostino RB, Belanger AJ, Kannel WB. Probability of stroke: a risk profile from the Framingham Study. Stroke; a journal of cerebral circulation. 1991;22(3):312–8. doi: 10.1161/01.str.22.3.312. [DOI] [PubMed] [Google Scholar]
- Xu W, Qiu C, Gatz M, Pedersen NL, Johansson B, Fratiglioni L. Mid- and late-life diabetes in relation to the risk of dementia: a population-based twin study. Diabetes. 2009;58(1):71–7. doi: 10.2337/db08-0586. [DOI] [PMC free article] [PubMed] [Google Scholar]
- Yau PL, Hempel R, Tirsi A, Convit A. Cerebral white matter and retinal arterial health in hypertension and type 2 diabetes mellitus. International journal of hypertension. 2013;2013:329602. doi: 10.1155/2013/329602. [DOI] [PMC free article] [PubMed] [Google Scholar]
- Zhang Y, Zhang J, Oishi K, Faria AV, Jiang H, Li X, et al. Atlas-guided tract reconstruction for automated and comprehensive examination of the white matter anatomy. Neuroimage. 2010;52(4):1289–301. doi: 10.1016/j.neuroimage.2010.05.049. [DOI] [PMC free article] [PubMed] [Google Scholar]
Associated Data
This section collects any data citations, data availability statements, or supplementary materials included in this article.