

Abstract
Computational protein design (CPD) predictions are highly dependent on the structure of the input template used. However, it is unclear how small differences in template geometry translate to large differences in stability prediction accuracy. Herein, we explored how structural changes to the input template affect the outcome of stability predictions by CPD. To do this, we prepared alternate templates by Rotamer Optimization followed by energy Minimization (ROM) and used them to recapitulate the stability of 84 protein G domain β1 mutant sequences. In the ROM process, side-chain rotamers for wild-type (WT) or mutant sequences are optimized on crystal or nuclear magnetic resonance (NMR) structures prior to template minimization, resulting in alternate structures termed ROM templates. We show that use of ROM templates prepared from sequences known to be stable results predominantly in improved prediction accuracy compared to using the minimized crystal or NMR structures. Conversely, ROM templates prepared from sequences that are less stable than the WT reduce prediction accuracy by increasing the number of false positives. These observed changes in prediction outcomes are attributed to differences in side-chain contacts made by rotamers in ROM templates. Finally, we show that ROM templates prepared from sequences that are unfolded or that adopt a nonnative fold result in the selective enrichment of sequences that are also unfolded or that adopt a nonnative fold, respectively. Our results demonstrate the existence of a rotamer bias caused by the input template that can be harnessed to skew predictions toward sequences displaying desired characteristics.
Keywords: rotamer optimization followed by energy minimization, protein stability prediction, single-state design, backbone template, rotamer bias, mutant sequences, protein G domain β1
Introduction
Computational protein design (CPD) algorithms have been successfully applied to the prediction of protein sequences exhibiting desired properties such as increased stability,1,2 altered specificity,3 and novel enzymatic activity.4 Traditionally, CPD calculations are performed using a single-state design (SSD) approach whereby sequences are evaluated in the context of a single fixed protein backbone template, which is typically a high-resolution crystal structure that may be energy-minimized to alleviate steric clashes present in the deposited coordinates. In SSD, changes to amino acid side-chain conformation and identity are modeled using a library of discrete rotamers that are threaded onto designed template positions during calculation. Sequences are then evaluated using an energy function5 that computes the pairwise interaction energies for each rotamer with both the template and other rotamers. The calculation is completed using an optimization algorithm that searches through sequence and rotamer space to identify stable sequences, resulting in a list of sequences that are ranked according to their predicted stability on the protein backbone template used throughout calculation.
Despite numerous successes, the SSD methodology is prone to false negative predictions that result from the combined use of a single fixed backbone template and a discrete set of rigid rotamers.6 This known artifact of SSD leads to the incorrect rejection of sequences that could have been otherwise tolerated using slightly different rotamer and backbone geometries during calculation.7 To address this artifact, a variety of computational strategies have been developed such as the use of softer repulsive potential energy terms,8–10 iterative energy minimization,11,12 continuous rotamer optimization,13 flexible backbone design,14–16 and multistate design with native backbone ensembles.17 Although these strategies reduce false negative predictions, the outcome of CPD calculations remains heavily dependent on the initial geometry of the input backbone template used. For example, Mayo and coworkers showed that identical SSD calculations using structurally similar templates prepared by energy minimization of either a high-resolution crystal structure or an nuclear magnetic resonance (NMR) averaged structure lead to different prediction outcomes, with the crystal or NMR structure calculations resulting in a majority of folded or unfolded proteins, respectively.2 In another study, NMR structures were shown to be on average worse templates for SSD than crystal structures for a set of 29 proteins whose structure had been solved using both methods.18 More recently, it was shown that the accuracy of protein stability predictions could be substantially improved by optimizing sequences on a set of wild-type (WT) and mutant protein crystal structure templates.19 This backbone drift approach increased prediction accuracy by identifying the most favorable template to score each sequence allowing for a better correlation with its experimentally measured stability. The examples described earlier clearly demonstrate that the choice of input template has a significant effect on the predictions made by SSD. However, it is still unclear how small differences in input template geometries translate to large differences in protein stability prediction accuracy.
In this study, we explored how structural changes to the input template used in SSD affect the outcome of stability predictions. Because amino acid mutations can alter the protein backbone as well as the side-chain conformation of neighboring residues, we hypothesized that the use of templates prepared from sequences known to stabilize the protein fold would improve prediction accuracy because their structures would be more amenable to the identification of other stable sequences. To test this hypothesis, we developed a method for template preparation called ROM for Rotamer Optimization followed by energy Minimization. In this process, side-chain rotamers for WT or mutant sequences are optimized by SSD on crystal or NMR structures and the resulting templates are subsequently energy-minimized, resulting in alternate structures that we term ROM templates. ROM templates were then used as inputs to SSD to predict the stability of mutant sequences (Fig. 1). We show that the use of ROM templates prepared from sequences known to be highly stable results predominantly in improved prediction accuracy compared to using the minimized crystal or NMR structures. Conversely, ROM templates prepared from sequences that are less stable than the WT reduce prediction accuracy by increasing the number of false positives. These observed changes in prediction outcomes are attributed to differences in side-chain contacts made by rotamers in ROM templates. Finally, we show that ROM templates prepared from sequences known to be unfolded or postulated to adopt a nonnative fold result in the selective enrichment of sequences that are also unfolded or that adopt a nonnative fold, respectively. Our results demonstrate the existence of a rotamer bias caused by the input template that can be harnessed to skew predictions toward sequences displaying desired characteristics by simply altering the template preparation procedure.
Figure 1.
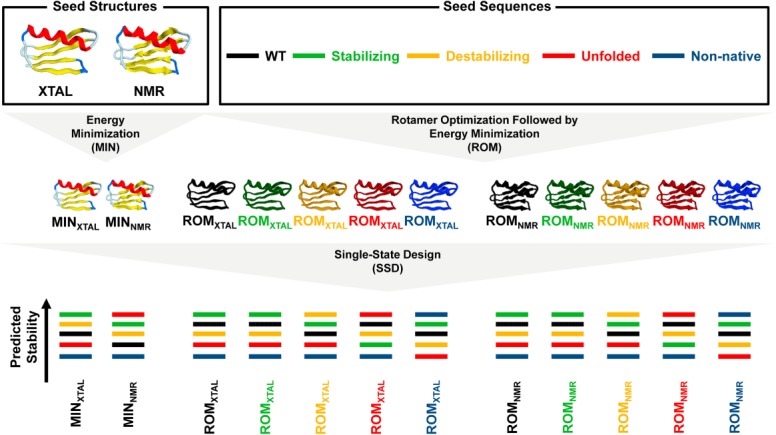
Computational methodology. Rotamer optimized and energy minimized (ROM) templates were prepared from stabilizing (green), destabilizing (yellow), unfolded (red), and nonnative (blue) mutant Gβ1 sequences as well as from the WT (black). To do so, rotamers for each seed sequence were optimized on the crystal (XTAL, PDB ID: 1PGA) or NMR (PDB ID: 2GB1) seed structures using SSD. The resulting templates were then energy minimized, completing the ROM procedure. Energy minimized crystal (MINXTAL) and NMR (MINNMR) templates were also prepared from the seed structures. MINXTAL, MINNMR, ROMXTAL, and ROMNMR templates were then used in SSD to predict the stability of each Gβ1 sequence.
Results
Rotamer configuration of input template biases SSD predictions
In this study, we investigated the effect that rotamer identity and configuration in input templates have on the accuracy of protein stability predictions made by SSD. To do this, we prepared templates by optimizing rotamers of core residues on the crystal (PDB ID: 1PGA)20 and NMR (PDB ID: 2GB1)21 structures of streptococcal protein G domain β1 (Gβ1) followed by energy minimization of each rotamer optimized template. This procedure, which we term ROM (Fig. 1), was used to generate different backbone templates derived from the WT or one of 84 Gβ1 mutant sequences of known stability.2 These 84 mutant sequences are classified into one of four stability groups: (i) 24 sequences displaying stability greater than or approximately equal to the WT (Supporting Information Fig. S1, stabilizing), (ii) 12 sequences of lower stability than the WT (Supporting Information Fig. S1, destabilizing), (iii) 24 sequences that do not fold (Supporting Information Fig. S1, unfolded), and (iv) 24 sequences postulated to adopt an alternate nonnative fold (Supporting Information Fig. S1, nonnative).2 Threading of the WT and 84 mutant sequences on the crystal and NMR structures followed by energy minimization resulted in two sets of 85 ROM templates identified as ROMXTAL and ROMNMR, respectively (Fig. 1).
ROM templates as well as minimized crystal and NMR structures (Fig. 1, MINXTAL and MINNMR) were used as inputs for SSD in an attempt to recapitulate the known stability of the 84 Gβ1 mutant sequences.2 Prediction accuracy of these calculations was evaluated by their ability to correctly bin mutant sequences as stable or unstable with respect to a cutoff value. As this value is design problem specific, we used the WT sequence score on each template as the cutoff because the WT sequence is known to be stable and ranked favorably in the context of the Gβ1 fold.6 In this sequence binning analysis, sequences of lower or higher scores relative to the WT were predicted to be stable or unstable, respectively. For the purpose of our analysis, unstable sequences include the 60 undesirable mutant Gβ1 sequences (Supporting Information Fig. S1, destabilizing, unfolded, and nonnative). As shown in Table I, binning analysis of SSD predictions using each ROM template, as well as the MINXTAL and MINNMR structures, classifies the 84 mutant Gβ1 sequences into one of four categories: (i) true positives are stable sequences that are correctly scored below the WT, (ii) false negatives are stable sequences that are incorrectly scored above the WT, (iii) false positives are unstable sequences that are incorrectly scored below the WT, and (iv) true negatives are unstable sequences that are correctly scored above the WT. In addition, the success rate reports on the percentage of stable and unstable sequences that are correctly binned.
Table I.
Sequence Binning Results
| XTAL | NMR | |||||||||||
|---|---|---|---|---|---|---|---|---|---|---|---|---|
| Success rate (%) | True positive | False negative | False positive | True negative | Cutoff (kcal/mol) | Success rate (%) | True positive | False negative | False positive | True negative | Cutoff (kcal/mol) | |
| MIN | ||||||||||||
| WT | 79 | 8 | 16 | 2 | 58 | −71.5 | 71 | 2 | 22 | 2 | 58 | −63.6 |
| ROM | ||||||||||||
| WT | 81 | 8 | 16 | 0 | 60 | −78.2 | 73 | 1 | 23 | 0 | 60 | −80.9 |
| ROM prepared from stabilizing sequences | ||||||||||||
| 1 | 88 | 16 | 8 | 2 | 58 | −73.1 | 73 | 9 | 15 | 8 | 52 | −73.1 |
| 2 | 90 | 18 | 6 | 2 | 58 | −67.3 | 88 | 18 | 6 | 4 | 56 | −55.9 |
| 3 | 57 | 19 | 5 | 31 | 29 | −12.0 | 90 | 22 | 2 | 6 | 54 | −53.5 |
| 4 | 87 | 18 | 6 | 5 | 55 | −68.3 | 67 | 9 | 15 | 13 | 47 | −71.4 |
| 5 | 82 | 10 | 14 | 1 | 59 | −73.6 | 73 | 7 | 17 | 6 | 54 | −73.7 |
| 6 | 80 | 15 | 9 | 8 | 52 | −54.0 | 77 | 12 | 12 | 7 | 53 | −70.0 |
| 7 | 87 | 19 | 5 | 6 | 54 | −56.4 | 88 | 19 | 5 | 5 | 55 | −55.8 |
| 8 | 89 | 18 | 6 | 3 | 57 | −69.2 | 77 | 14 | 10 | 9 | 51 | −57.1 |
| 9 | 87 | 14 | 10 | 1 | 59 | −73.1 | 75 | 9 | 15 | 6 | 54 | −66.6 |
| 10 | 89 | 18 | 6 | 3 | 57 | −66.3 | 80 | 14 | 10 | 7 | 53 | −56.9 |
| 11 | 88 | 17 | 7 | 3 | 57 | −69.7 | 92 | 18 | 6 | 1 | 59 | −58.2 |
| 12 | 90 | 16 | 8 | 0 | 60 | −75.6 | 73 | 7 | 17 | 6 | 54 | −75.2 |
| 13 | 74 | 23 | 1 | 21 | 39 | −47.8 | 77 | 8 | 16 | 3 | 57 | −65.4 |
| 14 | 87 | 15 | 9 | 2 | 58 | −72.5 | 77 | 14 | 10 | 9 | 51 | −55.0 |
| 15 | 81 | 8 | 16 | 0 | 60 | −77.7 | 77 | 5 | 19 | 0 | 60 | −76.5 |
| 16 | 82 | 10 | 14 | 1 | 59 | −71.2 | 74 | 7 | 17 | 5 | 55 | −72.9 |
| 17 | 86 | 14 | 10 | 2 | 58 | −71.4 | 73 | 9 | 15 | 8 | 52 | −71.8 |
| 18 | 88 | 18 | 6 | 4 | 56 | −59.4 | 83 | 18 | 6 | 8 | 52 | −58.3 |
| 19 | 88 | 16 | 8 | 2 | 58 | −71.0 | 86 | 14 | 10 | 2 | 58 | −59.8 |
| 20 | 93 | 18 | 6 | 0 | 60 | −74.0 | 86 | 15 | 9 | 3 | 57 | −61.0 |
| 21 | 83 | 10 | 14 | 0 | 60 | −76.0 | 71 | 7 | 17 | 7 | 53 | −71.5 |
| 22 | 79 | 9 | 15 | 3 | 57 | −67.2 | 79 | 6 | 18 | 0 | 60 | −73.5 |
| 23 | 77 | 10 | 14 | 5 | 55 | −62.1 | 92 | 20 | 4 | 3 | 57 | −56.4 |
| 24 | 87 | 13 | 11 | 0 | 60 | −76.1 | 87 | 15 | 9 | 2 | 58 | −59.9 |
| ROM prepared from destabilizing sequences | ||||||||||||
| 25 | 73 | 15 | 9 | 14 | 46 | −68.2 | 67 | 17 | 7 | 21 | 39 | −51.1 |
| 26 | 67 | 18 | 6 | 22 | 38 | −48.5 | 52 | 18 | 6 | 34 | 26 | 0.0a |
| 27 | 73 | 18 | 6 | 17 | 43 | −55.2 | 54 | 18 | 6 | 33 | 27 | −40.9 |
| 28 | 71 | 14 | 10 | 14 | 46 | −69.1 | 69 | 14 | 10 | 16 | 44 | −57.6 |
| 29 | 77 | 18 | 6 | 13 | 47 | −67.0 | 46 | 18 | 6 | 39 | 21 | −18.0 |
| 30 | 69 | 9 | 15 | 11 | 49 | −74.6 | 71 | 15 | 9 | 15 | 45 | −56.8 |
| 31 | 70 | 13 | 11 | 14 | 46 | −68.4 | 58 | 13 | 11 | 24 | 36 | −50.7 |
| 32 | 70 | 11 | 13 | 12 | 48 | −69.8 | 67 | 9 | 15 | 13 | 47 | −58.2 |
| 33 | 62 | 9 | 15 | 17 | 43 | −65.0 | 46 | 3 | 21 | 24 | 36 | 0.0a |
| 34 | 76 | 17 | 7 | 13 | 47 | −71.4 | 76 | 15 | 9 | 11 | 49 | −57.7 |
| 35 | 73 | 13 | 11 | 12 | 48 | −73.1 | 75 | 15 | 9 | 12 | 48 | −57.2 |
| 36 | 64 | 7 | 17 | 13 | 47 | −66.7 | 57 | 9 | 15 | 21 | 39 | −31.5 |
Cutoff values of 0 kcal/mol were assigned to ROMNMR templates prepared from sequences 26 and 33 because SSD could not favorably score the WT sequence on these templates.
Table I shows that SSD with the WT ROMXTAL and WT ROMNMR templates improves the scoring of the WT sequence resulting in a lower cutoff value compared to SSD with the MINXTAL and MINNMR structures, respectively. This result is to be expected given that core-residue rotamers were optimized prior to minimization in the WT ROM templates but not in the MINXTAL and MINNMR structures. The lower cutoff value increases stringency which improves the success rate through a reduction in the number of false positives. The increased stringency also has the consequence of decreasing the number of true positives in the case of the WT ROMNMR template. The improved prediction accuracy obtained using WT ROM templates lead us to hypothesize that SSD with ROM templates prepared from alternate sequences known to stabilize the Gβ1 fold (Supporting Information Fig. S1, stabilizing) might further improve the success rate by altering scoring of the WT and mutant Gβ1 sequences. As shown in Table I, SSD with 18 of the 24 ROMXTAL and 18 of the 24 ROMNMR templates prepared from stabilizing sequences resulted in improved success rates relative to SSD with the WT ROM templates. SSD with all ROM templates prepared from stabilizing sequences also yielded a higher WT score than that obtained on the corresponding WT ROM template, a consequence of their structures no longer being perfectly complementary to the WT sequence. The higher WT score results in an equal or reduced number of false negatives and an increased number of false positives for SSD using a majority of ROMXTAL (19/24) and ROMNMR (22/24) templates prepared from stabilizing sequences. Despite the increased number of false positives, the success rates of these calculations improved due to a disproportionate increase of true positives. This is best exemplified by SSD with the Sequence 3 ROMNMR template, which resulted in 22 true positives and a success rate of 90%, a significant improvement in prediction accuracy compared to SSD with the minimized NMR structure, which resulted in only two true positives and a 71% success rate. This improved success rate results from the use of a template on which scoring of the WT sequence is worsened and scoring of stabilizing sequences is improved.
To verify whether the use of templates on which the WT sequence is poorly scored is sufficient to improve binning success rate, we performed SSD using ROM templates prepared from the 12 destabilizing sequences (Supporting Information Fig. S1). As was observed for SSD with ROM templates prepared from stabilizing sequences, the WT cutoff value was increased relative to that obtained with the WT ROM templates, leading to a reduction of false negatives for most (11/12) or all of the ROMXTAL and ROMNMR templates, respectively. Despite a higher number of true positives for all but one of these calculations (Table I, Sequence 36 ROMXTAL), the success rate of SSD using ROM templates prepared from destabilizing sequences was decreased for all ROMXTAL and 10 of the 12 ROMNMR templates relative to results obtained for the WT ROM templates. This reduced prediction accuracy cannot be attributed to the stringency of the cutoff value, as the calculated WT scores fall mostly within the range of those obtained using ROM templates prepared from stabilizing sequences. Instead, the reduced success rates are due to the fact that unstable sequences are scored more favorably than the WT by SSD using ROM templates prepared from destabilizing sequences. This scoring behavior results in a large increase of false positives relative to SSD with the WT ROM templates. Clearly, predictions made by SSD are affected by the stability of the sequence used in ROM template preparation. This suggests the existence of a rotamer bias, which is a preference for certain sequences during calculation that is caused by the identity and configuration of rotamers found in the input template.
To confirm the existence of rotamer bias, we examined the sequence enrichment profiles for SSD using all 170 ROM templates. Sequence enrichment is defined as the ability of SSD to identify stable protein sequences and score them favorably such that they represent a majority of the top-ranked sequences. In this analysis, we examined the top 24 sequences (excluding WT) because our test set of 84 Gβ1 mutants contains 24 sequences displaying stability greater than or approximately equal to the WT. Enrichment profiles (Fig. 2) show the distribution of sequences found in the top 24 following SSD with all templates. Visual inspection of the enrichment profiles shows that SSD with a majority of ROM templates resulted in an enrichment of sequences from the same stability group as the sequence used to prepare the ROM template, supporting the existence of rotamer bias. Interestingly, ROM templates prepared from unfolded and nonnative sequences bias SSD calculations in a way that results in enrichment of sequences from the same stability group even though it is unlikely that these mutants adopt the folded Gβ1 structure in solution. Because sequence enrichment may result from the tendency of SSD to score more favorably rotamers optimized for compatibility with the template structure than rotamers that have not been optimized, we performed SSD calculations in which ROM-minimized rotamers were discarded and only unoptimized library rotamers were sampled. As can be seen in Supporting Information Figure S2 and Table S1, similar enrichment profiles were obtained regardless of inclusion of ROM-minimized rotamers, with the exception of SSD calculations using ROMNMR templates prepared from destabilizing sequences, which did not enrich for destabilizing sequences. These results demonstrate that sequence enrichment is not solely caused by preferential scoring of optimized rotamers. Because SSD calculations including or excluding ROM-minimized rotamers yielded similar enrichment profiles, all subsequent calculations included these rotamers. It is important to note that none of these SSD calculations resulted in an enrichment profile containing sequences from a single stability group, demonstrating that no template is ideal to score favorably all sequences for a given stability group. In addition, a majority of the enrichment profiles obtained from SSD calculations with ROMNMR templates prepared using nonnative sequences do not contain 24 sequences. This is due to the inability of SSD to score favorably (i.e., <0 kcal/mol) most sequences on these ROMNMR templates, suggesting that their structures are incompatible with the sequences and rotamers used during calculation.
Figure 2.
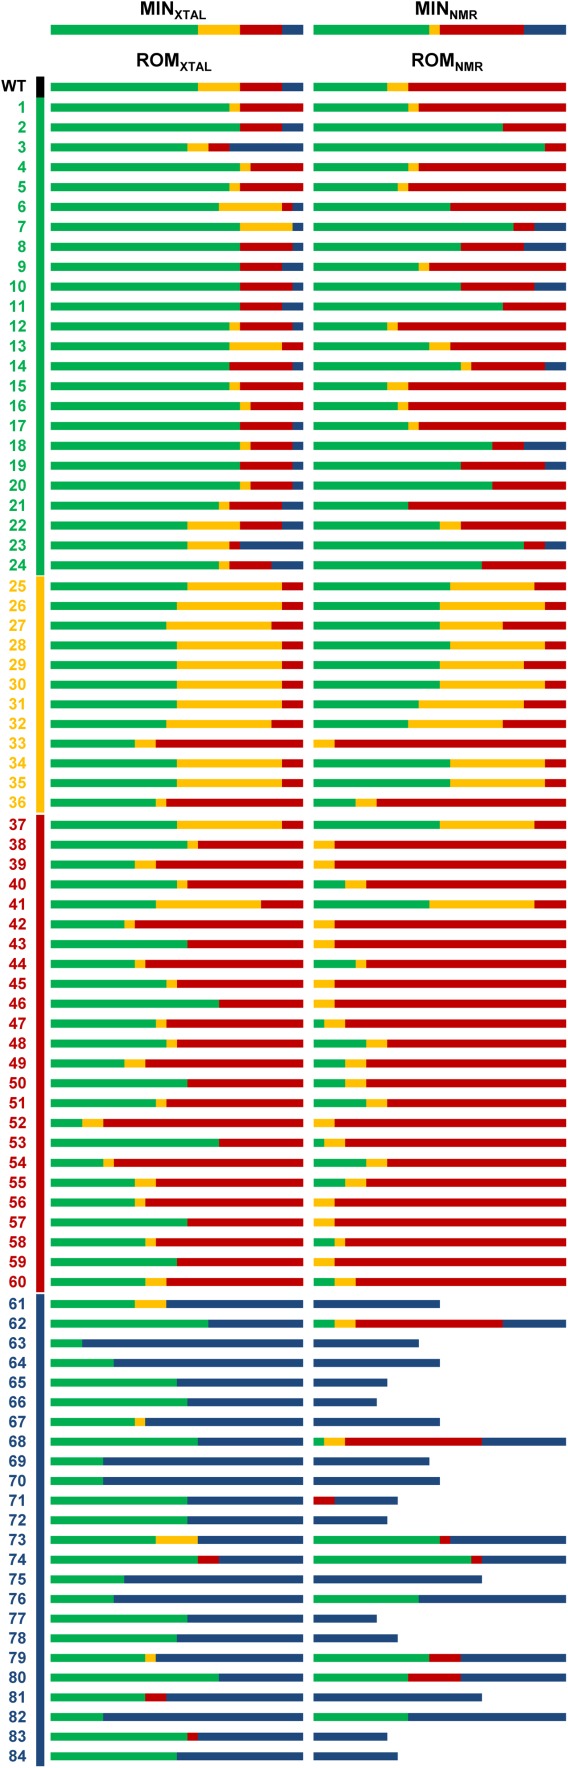
Enrichment profiles. The top 24 sequences (excluding WT) predicted by SSD using the energy minimized crystal (MINXTAL) and NMR (MINNMR) structures as well as ROM crystal (ROMXTAL) and NMR (ROMNMR) templates are shown as bars. Each bar is colored according to the proportion of sequences from each stability group found in the top 24, with stabilizing, destabilizing, unfolded, and nonnative sequences colored green, yellow, red, and blue, respectively. ROM templates were prepared from the WT (black) and 84 mutant Gβ1 sequences that are numbered and colored according to their stability group. Enrichment profiles of several ROMNMR templates prepared from nonnative sequences do not contain 24 sequences, and are shown as bars of reduced length.
To evaluate whether observed differences in enrichment profiles between ROM templates from the four stability groups were significant, we calculated the average and standard deviation of the number of sequences from each stability group that were found in the top 24 across all ROM templates prepared from sequences of the same group. As shown in Table II, SSD with ROMXTAL templates prepared from sequences of each stability group results on average in a higher number of sequences from the same stability group in the top 24 ranked sequences compared to SSD with the MINXTAL or with the WT ROMXTAL template. Conversely, SSD with ROMNMR templates derived from stabilizing or unfolded sequences does not significantly increase the number of sequences from the same stability group found in the top 24 compared to the MINNMR or WT ROMNMR template, respectively. This suggests that the crystal structure is more sensitive to rotamer bias than the NMR structure. Finally, it is important to note that SSD with the MINXTAL template results in a majority of stabilizing sequences in the top 24 whereas SSD with the MINNMR template does not. This result is in agreement with Keating and coworkers18 who showed that NMR structures are on average less useful templates for CPD than crystal structures. Nevertheless, our results show that applying the ROM procedure on NMR structures can lead to substantial improvements in stability prediction accuracy by increasing the number of true positives and decreasing the number of false negatives (Table I).
Table II.
Sequence Enrichment Results
| Sequences in top 24 | ||||
|---|---|---|---|---|
| Template | Stabilizing | Destabilizing | Unfolded | Nonnative |
| MINXTAL | 14 | 4 | 4 | 2 |
| MINNMR | 11 | 1 | 8 | 4 |
| ROMXTAL | ||||
| WT | 14 | 4 | 4 | 2 |
| Stabilizing | 17 ± 2 | 2 ± 2 | 4 ± 2 | 2 ± 2 |
| Destabilizing | 11 ± 1 | 9 ± 3 | 4 ± 4 | 0 |
| Unfolded | 10 ± 3 | 2 ± 3 | 12 ± 4 | 0 |
| Nonnative | 10 ± 4 | 0 | 0 | 13 ± 4 |
| ROMNMR | ||||
| WT | 7 | 2 | 15 | 0 |
| Stabilizing | 13 ± 5 | 1 ± 1 | 10 ± 5 | 1 ± 1 |
| Destabilizing | 10 ± 4 | 8 ± 3 | 6 ± 7 | 0 |
| Unfolded | 3 ± 3 | 3 ± 2 | 19 ± 5 | 0 |
| Nonnative | 3 ± 5 | 0 | 2 ± 4 | 10 ± 3 |
Variations in side-chain contacts made by ROM templates cause rotamer bias
The sequence binning and enrichment results described earlier demonstrate the existence of rotamer bias in CPD calculations and confirm observations made by others2,18,19 that the outcome of SSD is highly dependent on the input template used. However, our results do not explain which template property is responsible for the observed effects. Because fixed backbone methods tend to predict sequences with high identity to the WT sequence,14 we first investigated whether the observed rotamer bias could be attributed to similarity between sequences used to prepare ROM templates and other Gβ1 sequences. Sequence similarity between pairs of sequences was computed as the BLOSUM6222 score for the eight designed positions that varied in identity during calculation (Supporting Information Fig. S1, residues 3, 5, 7, 30, 34, 39, 52, and 54). In addition, we examined identity between the sequence used to generate each ROM template and other Gβ1 sequences by calculating the number of identical residues at the eight designed positions between each sequence pair. The assessment of both sequence similarity and identity allowed us to perform a pair-wise comparison of the Gβ1 sequences in a matter that is independent of the structural features of the templates.
Similarity and identity relationships between sequences, reported as the average BLOSUM62 score or the average number of identical designed residues between sequences belonging to each stability group are shown in Table III. As expected, sequences from the same stability group have high similarity, represented by BLOSUM62 scores of approximately 30, and strong identity, represented by a high number of identical designed residues (6 ± 1 out of a possible 8). Interestingly, stabilizing, destabilizing, and unfolded sequences are also highly similar with each other and with the WT sequence, with average BLOSUM62 scores in the 26–32 range. This is not the case for nonnative sequences which, although similar to each other, are considerably less similar to sequences from other stability groups and to the WT, with BLOSUM62 scores lower than 20. Identical trends are obtained when comparing sequence identity. These results demonstrate that, with the exception of nonnative sequences, sequence similarity and identity alone cannot account for the observed differences in sequence binning and enrichment obtained by SSD using ROM templates, suggesting that rotamer bias arises from structural differences in input templates.
Table III.
Sequence Homology and Identity
| WT | Stabilizing | Destabilizing | Unfolded | Nonnative | |
|---|---|---|---|---|---|
| Sequence homology | |||||
| Stabilizing | 31 ± 2 | 34 ± 2 | 32 ± 3 | 28 ± 2 | 17 ± 4 |
| Destabilizing | 30 ± 2 | 32 ± 3 | 33 ± 4 | 28 ± 3 | 15 ± 5 |
| Unfolded | 26 ± 2 | 28 ± 2 | 28 ± 3 | 31 ± 3 | 11 ± 4 |
| Nonnative | 14 ± 4 | 17 ± 4 | 15 ± 5 | 11 ± 4 | 31 ± 4 |
| Sequence identity | |||||
| Stabilizing | 5 ± 1 | 6 ± 1 | 5 ± 1 | 5 ± 1 | 3 ± 1 |
| Destabilizing | 5 ± 1 | 5 ± 1 | 6 ± 1 | 5 ± 1 | 3 ± 1 |
| Unfolded | 5 ± 1 | 5 ± 1 | 5 ± 1 | 6 ± 1 | 2 ± 1 |
| Nonnative | 2 ± 1 | 3 ± 1 | 3 ± 1 | 2 ± 1 | 6 ± 1 |
We next investigated how structural changes arising from the ROM procedure were responsible for the observed prediction differences. To do so, we calculated backbone RMSD between pairs of ROM templates and examined the average for sequences belonging to each stability group. As shown in Supporting Information Figure S3, ROMXTAL and ROMNMR templates are more structurally similar to their parent crystal or NMR structure, respectively. This result is expected given that the energy minimization step in the ROM procedure does not allow for exploration of the potential energy surface and only solves the location of the nearest local minimum. In addition, all ROMXTAL or ROMNMR templates deviate similarly from either the crystal or NMR structures regardless of which stability group they belong to. This result confirms that the rotamer optimization step of the ROM procedure does not lead to clashes in the protein core that would need to be alleviated by significant structural rearrangements during energy minimization. The diversity of ROM templates, defined as the average pairwise RMSD between templates belonging to the same stability group, does not significantly vary between stability groups and is lower than RMSD to the crystal or NMR structure from which they are derived. This result indicates that sequence differences in ROM templates belonging to the same stability group only result in subtle backbone structural changes. Additionally, a pairwise comparison of stability groups shows that backbones belonging to ROM templates prepared from nonnative sequences are the least similar to the other templates, consistent with observed sequence similarity and identity differences. However, backbone deviations are small across all stability groups, suggesting that they are not the main cause of the different enrichment profiles obtained by SSD. Interestingly, the average backbone RMSD values obtained for ROMNMR templates (Supporting Information Fig. S3B) are higher than those of the ROMXTAL templates (Supporting Information Fig. S3A), suggesting that rotamer configurations obtained for each sequence following the rotamer optimization step of the ROM procedure resulted in greater side-chain orientation variability on the NMR structure than on the crystal structure.
To investigate side-chain orientation variability, we examined the distribution of χ1 dihedral angles (N–Cα–Cβ–Cγ) for rotamers found at each designed position in the templates used in this study (Fig. 3). In the case of the input crystal and NMR structures, energy minimization relaxes the χ1 dihedrals without altering the general side-chain conformation (e.g., trans, gauche+, and gauche−) as expected. However, minimization of the NMR structure resulted in a greater change to the χ1 angle for all but two of the designed positions (39 and 54) compared to the crystal structure, supporting the observation that NMR structures are less rotameric than crystal structures.18 In the crystal and NMR structures, side chains at designed positions occupy one of three conformations, with residue 54 being in the gauche+ conformation, residues 5 and 39 being in the trans conformation, and residues 3, 7, 30, and 52 being in the gauche− conformation. These side-chain conformations found at each designed position in the crystal and NMR structures are also found in most ROM templates, independently of stability group. However, additional side-chain conformations not present in the crystal and NMR structures are also found in ROM templates. For example, both ROMXTAL and ROMNMR templates prepared with stabilizing sequences have two possible side-chain conformations at designed position 7, with side chains of 18 templates occupying the gauche− conformation present on the crystal and NMR structures and side chains of six templates occupying an alternate trans conformation. The gauche− conformation is found on ROM templates containing either the WT Leu or mutant Val and Ile residues at position 7 whereas the trans conformation arises from the Phe mutation. This example illustrates how amino acid identity at each designed position can lead to significant side-chain conformational changes. Interestingly, side chains of ROMNMR templates have greater conformational variability than those of ROMXTAL templates. For example, residues at designed position 5 in ROMNMR templates prepared from destabilizing and unfolded sequences can adopt an additional conformation (gauche−) than equivalent residues in their ROMXTAL counterparts. In addition, residues at designed positions 30 and 52 found in ROMNMR templates prepared from nonnative sequences can also adopt the trans conformation, which is not found at these positions in ROMXTAL templates. In the case of ROMXTAL templates, only those prepared from stabilizing sequences contain an additional side-chain conformation that is not present in the corresponding ROMNMR templates (Fig. 3, trans conformation at position 54). The fact that ROMNMR templates can accommodate a greater number of side-chain conformations than ROMXTAL templates may explain why they are less sensitive to rotamer bias, because their core cavity can tolerate a greater number of different side-chain conformations. Conversely, ROMXTAL templates accommodate fewer side-chain conformations but are more sensitive to rotamer bias, suggesting that small changes to rotamer configurations in these templates result in substantial changes to side-chain contacts made by rotamers.
Figure 3.
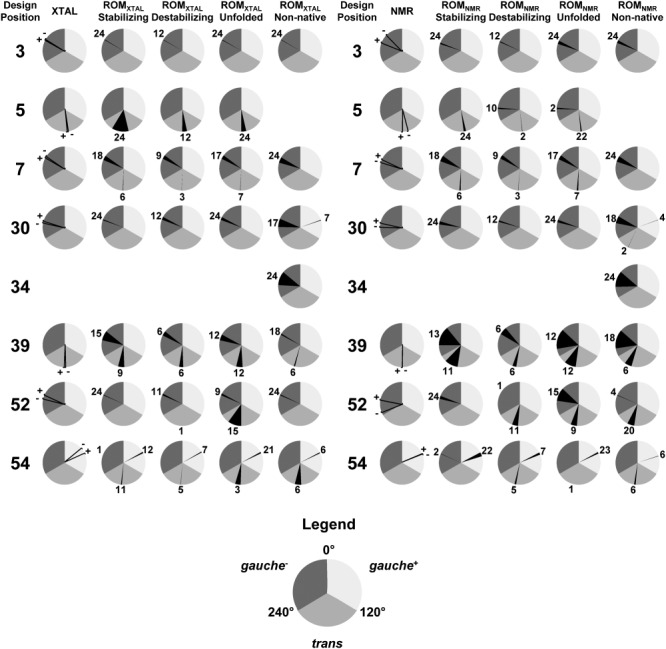
Template side-chain variability. χ1 dihedral angles for rotamers found at each design position in the crystal (XTAL) and NMR structures prior to (−) or following energy minimization (+) are shown as black lines. χ1 dihedral angles for rotamers found at each design position in ROM templates grouped by the stability of their seed sequence are shown as sections of pie charts colored in black. These sections represent the range of values that the χ1 dihedral can adopt in ROM templates. Dihedral values are binned into one of three general conformations: gauche+ (light gray), trans (medium gray), and gauche− (dark gray). The number of ROM templates sharing the same general rotamer conformation at each design position is indicated next to each section.
To investigate the nature of side-chain contacts made by rotamers in ROM templates, we computed the van der Waals interaction energy between residues at designed positions and all other residues for each ROM template. The van der Waals energies were then averaged by stability group and by residue identity within each stability group, as van der Waals energies are highly dependent on the type and number of side-chain atoms. As shown in Figure 4, the contact map for ROMXTAL templates demonstrates a clear dependence between average interaction energies and residue identity across templates from each stability group. For example, the interactions that Leu at designed position 7 makes with residues at positions 12–16 vary depending on the stability group of its corresponding ROMXTAL template. Yet, leucine at designed position 7 has a similar χ1 dihedral angle and gauche− conformation in all ROMXTAL templates (Fig. 3), confirming that small changes in structure can result in substantial differences in side-chain contacts. Thus, it is likely that the rotamer bias observed when performing SSD with ROM templates (Table I and Fig. 2) results from differences in side-chain contacts. Although the distribution of side-chain contacts is similar for both ROMXTAL and ROMNMR (Supporting Information Fig. S4) templates, the strengths of interactions can vary significantly. For example, phenylalanine at designed position 52 interacts most strongly with Y45 in ROMXTAL templates from all stability groups, but the same substitution interacts more strongly with W43 for ROMNMR templates prepared from destabilizing and unfolded sequences (Supporting Information Fig. S4). This result demonstrates that while SSD with ROM templates results in rotamer bias, the side-chain contacts that give rise to this bias are different. Because it is difficult to predict a priori which side-chain contacts are required to improve stability prediction accuracy by SSD, use of ROM templates prepared from stabilizing sequences in SSD represents a simple way to achieve this result via rotamer bias.
Figure 4.
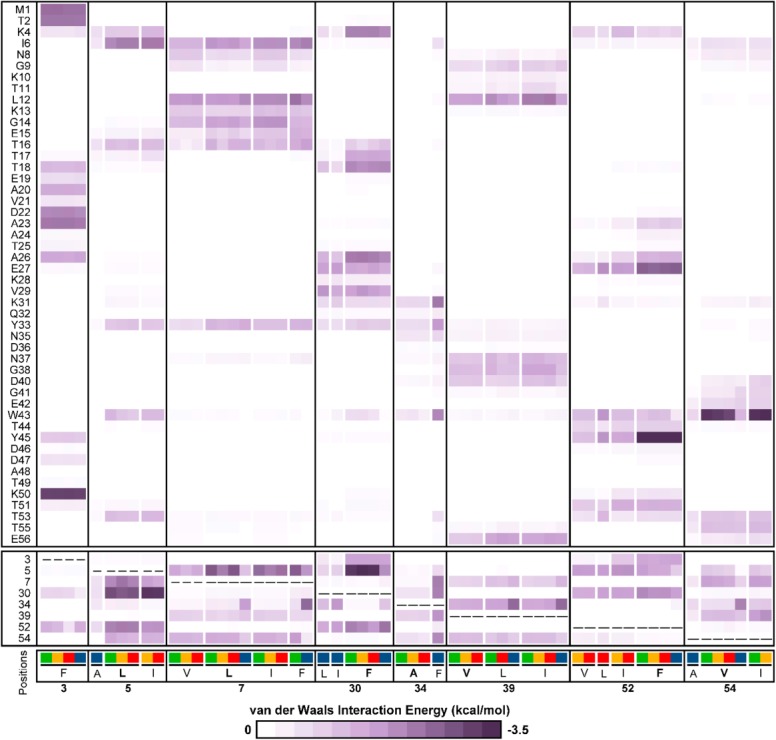
Contact map for ROMXTAL templates. Van der Waals interaction energies between residues at designed positions and all other residues in ROMXTAL templates are averaged by stability group and by residue identity within each stability group. Residues found at each designed position in ROMXTAL templates prepared from stabilizing, destabilizing, unfolded, and nonnative sequences are colored green, yellow, red, and blue, respectively, with the WT residue indicated in bold. Designed position residues are boxed separately from residues whose identity does not vary between templates. Interaction energies are colored according to their strength ranging from 0 kcal/mol (white, no interaction) to −3.5 kcal/mol (dark purple, strong favorable interaction).
Our results described above suggest that the rotamer bias conferred through template preparation with the ROM procedure likely arises from variations in side-chain contacts. To determine whether variations in side-chain contacts result from alterations to the core cavity shape in each ROM template, we prepared two additional sets of templates using modified ROM procedures in which only side-chain (scROM) or backbone (bbROM) atoms were relaxed by energy minimization, with all other atoms remaining fixed. If side-chain contacts made by residues at designed positions cause the observed rotamer bias, it is expected that ROM templates prepared with their side-chain atoms fixed during minimization (i.e., bbROM templates) will not be able to confer a bias to SSD sequence enrichment because their core cavities will be identical. As shown in Supporting Information Figure S5 and Table S2, SSD with bbROM templates did not result in significant biases in sequence enrichment profiles, regardless of the sequence used during template preparation. In contrast, SSD calculations using scROMXTAL and scROMNMR templates prepared with destabilizing, unfolded, and nonnative sequences were able to skew enrichment profiles to favor sequences from their respective stability group. These results conclusively demonstrate that it is the shape of the core cavity present in ROM templates that gives rise to biased SSD predictions, presumably through alterations to side-chain contacts.
Force-field biases partially reproduce rotamer bias caused by ROM templates
The results described earlier demonstrate that rotamer bias arises from differences in side-chain contacts present in the input template, which skew predictions during SSD. We, therefore, examined whether the rotamer bias effect could be reproduced by applying an energy bias favoring specific amino acid sequences or rotamer configurations as part of the scoring function (see Materials and Methods). Because there is no means of knowing in advance which bias weight to apply, we tested a range of weights (Supporting Information Figs. S6–S9). Inspection of enrichment profiles allowed us to determine optimal bias weights of 10 kcal/mol favoring rotamer configuration and 100 kcal/mol favoring amino acid sequence. It is important to note that the application of biases disfavoring either rotamer configuration or amino acid sequence were unable to alter enrichment profiles, and that the application of the strongest bias weight favoring amino acid sequence or rotamer configuration (−1000 kcal/mol) yielded enrichment profiles containing fewer than 24 sequences. To determine whether the effect that these biases had on SSD enrichment profiles was significant, we calculated the average and standard deviation of the number of sequences from each stability group that were found in the top 24 for all templates prepared from sequences of the same group. Supporting Information Table S3 shows that the application of potential energy biases to SSD calculations can result in the selective enrichment of sequences for some but not all stability groups, unlike what was observed by SSD with ROMXTAL templates. Interestingly, amino acid bias does not lead to an enrichment of stabilizing sequences when using the MINXTAL or MINNMR structures, whereas rotamer configuration bias does so only for templates derived from the MINNMR structure. Furthermore, although application of an amino acid bias can improve binning success rates relative to unbiased calculations (Supporting Information Table S4), only a minority of calculations biased toward stabilizing sequences on either the MINXTAL (Sequences 3, 13, and 23) or MINNMR structures (Sequences 1, 4, 8, 12, 13, 17, and 21) resulted in improved success rates relative to SSD using corresponding ROMXTAL and ROMNMR templates (Table I). A similar result is obtained by applying a rotamer configuration bias. These results demonstrate that the application of potential energy biases in the scoring function is not as efficient as the rotamer bias caused by the use of ROM templates in improving the accuracy of protein stability predictions by SSD.
Use of ROM templates performs better than other methods for biasing SSD predictions
Throughout this work, we have demonstrated that SSD calculations can be biased through a variety of methods, including amino acid sequence or rotamer configuration weights added to the scoring function as well as structural alterations to the template resulting from preparation procedures such as, ROM, bbROM, and scROM. To identify which of these biasing methods is the most useful for skewing SSD predictions, we investigated how they would alter the position of the seed sequence (i.e., the input template sequence) in the ranked list of sequences predicted by SSD. The distributions shown in Figure 5 depict the frequency at which seed sequences occupy each position in the ranked list of 85 Gβ1 sequences obtained following biased SSD calculations. As expected, SSD using ROMXTAL and ROMNMR templates results in a narrow distribution of seed sequences occupying the top five positions in their respective rank ordered lists. Broader distributions are obtained for SSD calculations using scROM templates, however, the majority of seed sequences still occupy the top five positions. In contrast, SSD calculations using bbROM templates could not improve the rank order for most seed sequences, nor could they favorably score a large number of the 85 Gβ1 seed sequences (24 and 52% for bbROMXTAL and bbROMNMR, respectively). Finally, SSD using amino acid sequence or rotamer configuration biases also improved the position of seed sequences in the ranked list of scored sequences, giving narrow distributions with most seed sequences ranked in the top five positions. However, contrary to the results obtained using ROM and scROM templates, a large number of seed sequences (21–48%) could not be scored favorably on the MINXTAL and MINNMR templates even when using potential energy biases, suggesting that they are not suitable templates for these sequences. These results demonstrate that SSD with ROM templates performs better than other methods to bias calculations toward specific sequences.
Figure 5.

Seed sequence ranking in biased SSD calculations. Distributions depict the frequency at which seed sequences were ranked at each position in the ranked list of sequences obtained following biased SSD calculations. Seed sequences (listed in Supporting Information Fig. S1) are the sequences present in each input template used in SSD. The fraction of the pie chart in black corresponds to the percentage of the 85 Gβ1 seed sequences that could not be scored favorably by biased SSD calculations. For the amino acid sequence and rotamer configuration biases, weights of −100 and −10 kcal/mol were applied to the SSD scores, respectively.
Discussion
The ROM procedure described here can be used to generate templates for SSD that lead to improved stability prediction accuracy. As well, this procedure can be used to generate templates that bias predictions toward undesirable sequences such as those that are unfolded or adopt a nonnative fold, even in the absence of atomistic models for unfolded and nonnative states of Gβ1. This bias is likely the consequence of side-chain contacts present in ROM templates that skew predictions toward sequences of similar folding behavior. Because of this bias in SSD predictions, it may be possible to use ROM templates prepared from unfolded or nonnative sequences as undesired competing states in negative design. In this approach, sequences that are scored more favorably on ROM templates prepared from unfolded or nonnative sequences than on ROM templates prepared from stabilizing sequences would be eliminated from the ranked list of scored sequences, potentially leading to improved prediction accuracy by reducing the number of false positives. Another potential application of the ROM procedure would be as part of an iterative process combining rounds of CPD with experimental validation. In the first step of this iterative process, SSD with a MINXTAL or WT ROMXTAL template would be used to generate a list of mutant sequences ranked by their predicted stability. Then, the stability of these predicted sequences would be assessed experimentally to identify stable mutants. Finally, stable mutant sequences would be used to prepare new ROMXTAL templates that would serve as input backbones for subsequent rounds of SSD until no new sequences are predicted. In this way, the ROM procedure may be applied even in the absence of previously known stable mutant sequences. Alternatively, this process may be initiated using prior stability information for mutant sequences obtained from databases such as ProTherm.23
In addition to the applications stated above, ROM templates could also serve as structural models for backbone drift modeling. In backbone drift modeling,19 a set of templates consisting of available crystal structures for a protein of interest is used to score mutant sequences to identify their most favorable score from each of the templates. Use of this score to represent each designed sequence results in substantial improvements to stability prediction accuracy.19 Backbone drift modeling thus makes the assumption that the correct rotamer configuration and score of any given sequence is that obtained from the backbone template on which that sequence is scored most favorably. To verify whether we could successfully perform backbone drift modeling with ROM templates, we identified the ROM template prepared from stabilizing sequences that results in the most favorable score for each Gβ1 mutant sequence, and used those scores in sequence binning analysis. Backbone drift modeling with ROMXTAL and ROMNMR templates prepared from stabilizing sequences results in improved binning success rates (Table IV) compared to SSD using the MINXTAL or MINNMR structures, respectively (Table I). We also performed backbone drift modeling with all Gβ1 depositions available in the Protein Data Bank, and this also resulted in improved success rates compared to SSD using MINXTAL and MINNMR input templates. However, backbone drift modeling using the ROMXTAL templates resulted in the highest success rate (92%) due to the lowest number of false negatives and the highest number of true positives. The improved success rate of backbone drift modeling with ROMXTAL templates compared to backbone drift modeling with PDB structures demonstrates that structural models prepared in silico are as relevant for the scoring of mutant sequences as structures derived from experimental data. Thus, in the absence of crystal or NMR structures for mutant sequences, the ROM procedure may be used to generate high-quality input templates for CPD.
Table IV.
Sequence Binning Results Obtained by Backbone Drift Modeling
| Success rate (%) | True positive | False negative | False positive | True negative | Cutoff (kcal/mol) | |
|---|---|---|---|---|---|---|
| ROMXTALa | 92 | 20 | 4 | 3 | 57 | −74.8 |
| ROMNMRa | 81 | 12 | 12 | 4 | 56 | −76.5 |
| PDBb | 86 | 12 | 12 | 0 | 60 | −78.4 |
ROM templates were prepared using stabilizing sequences.
Set includes 17 Gβ1 depositions available in the Protein Data Bank: 1EM7, 1IGD, 1PGA,1PGB, 2GB1, 2IGD, 2IGH, 2J52, 2J53, 2K0P, 2LGI, 2RMM(chain-A), 2RMM(chain-B), 2RPV, 3GB1, 3MP9(chain-A), 3MP9(chain-B).
ROM templates can also be used to access larger areas of sequence space during SSD. To illustrate this, we compiled all top 100 sequences predicted by SSD using ROMXTAL templates from the same stability group and applied backbone drift modeling to find the best score for each unique sequence contained within these lists. All sequences were then reranked using the backbone drift modeling score and a new top 100 was compiled for each stability group. For the ROMXTAL and MINXTAL templates prepared from the WT sequence, no backbone drift modeling was applied to the top 100 sequences predicted by SSD. Analysis of the top 100 sequences (Fig. 6) shows that SSD with the MINXTAL and WT ROMXTAL templates results in the highest number of shared sequences (62 out of 100), an unsurprising result given that both templates were prepared from identical seed sequences. However, overlap of sequences predicted by backbone drift modeling using ROMXTAL templates of different stability groups is lower, with a maximum of 54 shared sequences. This result shows that at least 46 different sequences can be found in the top 100 depending on the ROM templates used, demonstrating that incorporation of sequence information by the ROM procedure skews the predicted sequence space away from that of other templates. Most impressively, backbone drift modeling across ROMXTAL templates prepared from stabilizing sequences results in a top 100 containing all 24 stabilizing sequences, ten more than were predicted with the MINXTAL template, and only 30 sequences that are shared with the MINXTAL top 100. It may be possible that several of the remaining 70 sequences have a stabilizing effect on Gβ1, but further experiments are needed to confirm this hypothesis. In addition, sequence motifs prepared from the top 100 sequences (Supporting Information Fig. S10) show that ROM templates can be used to predict mutations that are not included in the 85 Gβ1 seed sequences (Supporting Information Fig. S1) from which they are derived. All of these results illustrate how SSD with ROM templates increases the diversity of predicted sequences, thereby allowing evaluation of novel combinations of mutations.
Figure 6.
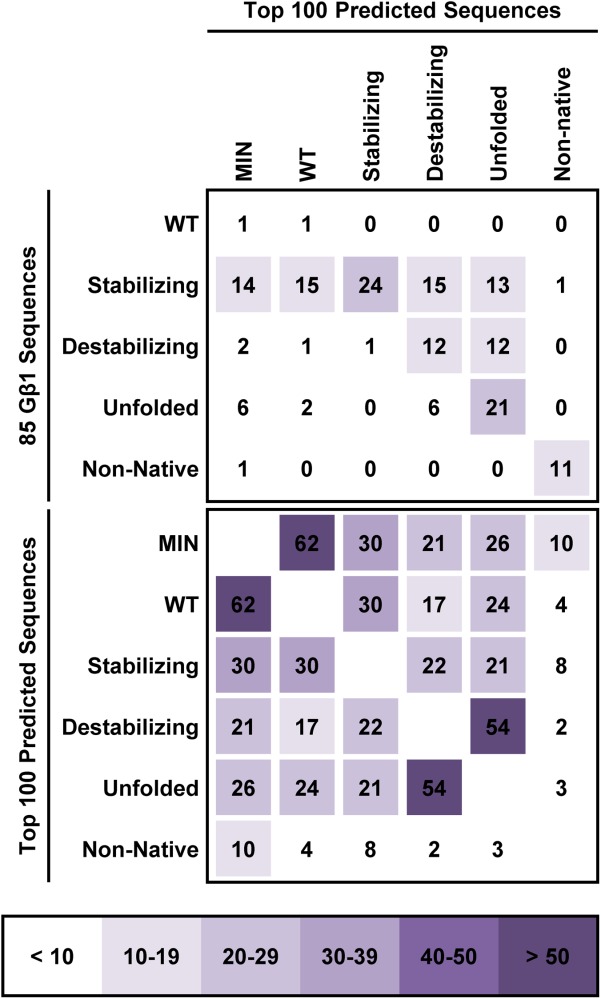
Sequence space overlap for backbone drift modeling using ROMXTAL templates. The top 100 sequences predicted by backbone drift modeling (see text for details) using ROMXTAL templates from a same stability group were compared to those predicted for other stability groups, and the number of shared sequences is indicated. Comparisons are also included for the MINXTAL (MIN) and WT ROMXTAL templates. The top 100 sequences were obtained by designing core residues of Gβ1 (positions 3, 5, 7, 20, 26, 30, 34, 39, 52, and 54) using hydrophobic amino acids (A, V, L, I, and F) as well as the WT Y amino acid at position 3. The number of shared sequences in the top 100 that are part of the 85 Gβ1 seed sequences listed in Supporting Information Figure S1 is also reported. Overlap in sequence space is colored according to the number of shared sequences.
The results obtained by backbone drift modeling illustrate the importance of using alternate structures to better score mutant sequences and increase the diversity of predicted sequences. Because amino acid mutations can alter the protein backbone as well as the side-chain conformation of neighboring residues, the scoring by SSD of each mutant sequence on a template that is a more accurate model of its actual structure than the WT structure is preferable. However, as structures for all possible mutants of a protein of interest are not available, sets of templates prepared in silico, such as ROM templates, may provide more suitable structural models for scoring mutant sequences. Methods incorporating backbone flexibility during calculation have also resulted in improved CPD predictions6,11,12,24 through the identification of more suitable backbones for the scoring of mutant sequences. Thus, we propose that many failed CPD predictions may result from scoring of sequences on incorrect templates for that sequence rather than by deficiencies in the energy function, in agreement with observations made by Gainza et al.13
Conclusion
This study demonstrates the existence of a bias in SSD that arises from variations in side-chain contacts made by rotamers in the input template used. This rotamer bias causes calculations to score more favorably sequences of similar stability to the sequence used to generate the input template. Because of this, rotamer bias can be exploited to improve the accuracy of protein stability predictions through the use of ROM templates prepared from stable mutant sequences, leading to increased true positives and fewer false negatives. Although other methods such as, flexible backbone design,25–27 multistate design with native backbone ensembles,2,6 continuous rotamer optimization,13 and on-the-fly energy minimization12 have been developed to improve the accuracy of predictions made by CPD, SSD with ROM templates prepared from stabilizing sequences represents a useful alternative that is easier to implement and less computationally expensive. Indeed, implementation of the ROM procedure requires only standard single-state CPD protocols and energy minimization. Although prior knowledge of stable mutant sequences is useful to prepare ROM templates that enable the improvement of stability prediction accuracy, application of the ROM procedure to the WT sequence can also lead to improved predictions by SSD. In the future, it will be interesting to see if ROM templates can be used as input templates in SSD for the prediction of protein sequences exhibiting desired properties other than improved stability, such as, specific ligand binding or enhanced catalytic activity.
Materials and Methods
Template preparation
The crystal (PDB ID: 1PGA)20 and NMR-averaged (PDB ID: 2GB1)21 structures of Gβ1 were retrieved from the Protein Data Bank. Water molecules were removed and hydrogen atoms were added to the protein using the Protonate3D28 protocol available in the Molecular Operating Environment (MOE) software package.29 Energy minimized crystal (MINXTAL) and NMR (MINNMR) templates were prepared by conjugate gradient minimization to a final gradient of 1 kcal/mol Å using the AMBER99 force field30 with the reaction-field model implemented in MOE.29 ROM templates were prepared by optimization of side-chain rotamers for WT and mutant Gβ1 sequences using SSD as described later, followed by energy minimization as specified for the MINXTAL and MINNMR structures.
Single-state design
SSD was performed using the fast and accurate side-chain topology and energy refinement algorithm31 as implemented in PHOENIX.2,32,33 Side-chain rotamers of core residues (positions 3, 5, 7, 20, 26, 30, 34, 39, 43, 52, and 54) were optimized on each fixed backbone template using the amino acid identities specified in Supporting Information Figure S1. The backbone dependent Dunbrack rotamer library with expansions of ±1 standard deviation around χ1 and χ2 dihedral angles34 was used to model side-chain conformations. A four-term potential energy model consisting of a van der Waals term from the Dreiding II force field with atomic radii scaled by 0.9,35 a direction sensitive hydrogen-bond term with well depth at 8.0 kcal/mol,8 an electrostatic energy term modeled using Coulomb's law with a distance dependent dielectric of 40, and a surface area-based solvation penalty term,36,37 was used to score and rank sequences. Calculations involving the application of a potential energy bias during SSD included an additional term to the scoring function. In the case of amino acid bias, each Gβ1 sequence was specified as a reference and sequence scores were adjusted according to their identity to the reference sequence. A range of amino acid bias weights were applied (±1000, ±10, ±4.2, ±2.8, or ±1.4 kcal/mol), and these were divided across the eight designed positions that vary in identity between Gβ1 sequences (positions 3, 5, 7, 30, 34, 39, 52, and 54). In the case of configuration bias, sequence scores were adjusted according to the rotamer configuration and identity present at each designed position on a reference structure. No bias was applied to the alanine at position 34 because it has no rotamer. Because atomistic structures for each of the 84 mutant Gβ1 sequences are not available, reference structures for configuration bias were generated by optimizing rotamers for each sequence on MINXTAL or MINNMR templates using SSD, as described above. A range of configuration bias weights were applied (±1000, ±10, ±4.2, ±2.8, and ±1.4 kcal/mol) to each designed position independently. The configuration bias is applied to design position rotamers that share both identity and configuration with the rotamer at the same position in the reference structure.
Side-chain contact analysis
Side-chain contact maps for ROMXTAL and ROMNMR templates were constructed by computing the van der Waals interaction energy between side chains at designed positions and all other side chains for each template. Interactions energies were calculated using a Lennard-Jones 12-6 potential energy curve with AMBER99 parameters.30 Interaction energies are reported as the average value for side chains belonging to ROM templates of the same stability group bearing the same substitution at each designed position.
Glossary
- BLOSUM
blocks substitution matrix
- CPD
computational protein design
- Gβ1
streptococcal protein G domain β1
- MIN
energy minimized
- ROM
rotamer optimization followed by energy minimization
- SSD
single-state design.
Supporting Information
Additional Supporting Information may be found in the online version of this article.
Supplementary Information
References
- 1.Korkegian A, Black ME, Baker D, Stoddard BL. Computational thermostabilization of an enzyme. Science. 2005;308:857–860. doi: 10.1126/science.1107387. [DOI] [PMC free article] [PubMed] [Google Scholar]
- 2.Allen BD, Nisthal A, Mayo SL. Experimental library screening demonstrates the successful application of computational protein design to large structural ensembles. Proc Natl Acad Sci USA. 2010;107:19838–19843. doi: 10.1073/pnas.1012985107. [DOI] [PMC free article] [PubMed] [Google Scholar]
- 3.Borgo B, Havranek JJ. Motif-directed redesign of enzyme specificity. Protein Sci. 2014;23:312–320. doi: 10.1002/pro.2417. [DOI] [PMC free article] [PubMed] [Google Scholar]
- 4.Siegel JB, Zanghellini A, Lovick HM, Kiss G, Lambert AR, St Clair JL, Gallaher JL, Hilvert D, Gelb MH, Stoddard BL, Houk KN, Michael FE, Baker D. Computational design of an enzyme catalyst for a stereoselective bimolecular Diels-Alder reaction. Science. 2010;329:309–313. doi: 10.1126/science.1190239. [DOI] [PMC free article] [PubMed] [Google Scholar]
- 5.Boas FE, Harbury PB. Potential energy functions for protein design. Curr Opin Struct Biol. 2007;17:199–204. doi: 10.1016/j.sbi.2007.03.006. [DOI] [PubMed] [Google Scholar]
- 6.Davey JA, Chica RA. Improving the accuracy of protein stability predictions with multistate design using a variety of backbone ensembles. Vol. 82. Proteins: Struct Funct Bioinf; 2014. pp. 771–784. [DOI] [PubMed] [Google Scholar]
- 7.Choi EJ, Guntas G, Kuhlman B. Future challenges of computational protein design. In: Park SJ, Cochran JR, editors. Protein engineering and design. Boca-Raton: Talor and Francis Group; 2010. pp. 367–370. [Google Scholar]
- 8.Dahiyat BI, Mayo SL. Probing the role of packing specificity in protein design. Proc Natl Acad Sci USA. 1997;94:10172–10177. doi: 10.1073/pnas.94.19.10172. [DOI] [PMC free article] [PubMed] [Google Scholar]
- 9.Grigoryan G, Ochoa A, Keating AE. Computing van der Waals energies in the context of the rotamer approximation. Vol. 68. Proteins: Struct Funct Bioinf; 2007. pp. 863–878. [DOI] [PubMed] [Google Scholar]
- 10.Kellogg EH, Leaver-Fay A, Baker D. Role of conformational sampling in computing mutation-induced changes in protein structure and stability. Vol. 79. Proteins: Struct Funct Bioinf; 2011. pp. 830–838. [DOI] [PMC free article] [PubMed] [Google Scholar]
- 11.Borgo B, Havranek JJ. Automated selection of stabilizing mutations in designed and natural proteins. Proc Natl Acad Sci USA. 2012;109:1494–1499. doi: 10.1073/pnas.1115172109. [DOI] [PMC free article] [PubMed] [Google Scholar]
- 12.Wang C, Schueler-Furman O, Baker D. Improved side-chain modeling for protein-protein docking. Protein Sci. 2005;14:1328–1339. doi: 10.1110/ps.041222905. [DOI] [PMC free article] [PubMed] [Google Scholar]
- 13.Gainza P, Roberts KE, Donald BR. Protein design using continuous rotamers. PLoS Comput Biol. 2012;8:e1002335. doi: 10.1371/journal.pcbi.1002335. [DOI] [PMC free article] [PubMed] [Google Scholar]
- 14.Murphy GS, Mills JL, Miley MJ, Machius M, Szyperski T, Kuhlman B. Increasing sequence diversity with flexible backbone protein design: the complete redesign of a protein hydrophobic core. Structure. 2012;20:1086–1096. doi: 10.1016/j.str.2012.03.026. [DOI] [PMC free article] [PubMed] [Google Scholar]
- 15.Ollikainen N, Smith CA, Fraser JS, Kortemme T. Flexible backbone sampling methods to model and design protein alternative conformations. Methods Enzymol. 2013;523:61–85. doi: 10.1016/B978-0-12-394292-0.00004-7. [DOI] [PMC free article] [PubMed] [Google Scholar]
- 16.Smith CA, Kortemme T. Predicting the tolerate sequences for proteins and protein interfaces using rosettabackbub flexible backbone design. PLoS One. 2011;6:e20451. doi: 10.1371/journal.pone.0020451. [DOI] [PMC free article] [PubMed] [Google Scholar]
- 17.Davey JA, Chica RA. Multistate approaches in computational protein design. Protein Sci. 2012;21:1241–1252. doi: 10.1002/pro.2128. [DOI] [PMC free article] [PubMed] [Google Scholar]
- 18.Schneider M, Fu X, Keating AE. X-ray vs. NMR structures as templates for computational protein design. Vol. 77. Proteins: Struct Funct Bioinf; 2009. pp. 97–110. [DOI] [PMC free article] [PubMed] [Google Scholar]
- 19.Howell SC, Inampudi KK, Bean DP, Wilson CJ. Understanding thermal adaptation of enzymes through the multistate rational design and stability prediction of 100 adenylate kinases. Structure. 2014;22:218–229. doi: 10.1016/j.str.2013.10.019. [DOI] [PubMed] [Google Scholar]
- 20.Gallagher T, Alexander P, Bryan P, Gilliland GL. Two crystal structures of the B1 immunoglobulin-binding domain of streptococcal protein G and comparison with NMR. Biochemistry. 1994;33:4721–4729. [PubMed] [Google Scholar]
- 21.Gronenborn AM, Filpula DR, Essig NZ, Achari A, Whitlow M, Wingfield PT, Clore GM. A novel, highly stable fold of the immunoglobulin binding domain of streptococcal protein G. Science. 1991;253:657–661. doi: 10.1126/science.1871600. [DOI] [PubMed] [Google Scholar]
- 22.Henikoff S, Henikoff JG. Amino acid substitution matrices from protein blocks. Proc Natl Acad Sci USA. 1992;89:10915–10919. doi: 10.1073/pnas.89.22.10915. [DOI] [PMC free article] [PubMed] [Google Scholar]
- 23.Kumar MD, Bava KA, Gromiha MM, Parabakaran P, Kitajima K, Uedaira H, Sarai A. ProTherm and ProNIT: thermodynamic databases for proteins and protein-nucleic acid interactions. Nucleic Acids Res. 2006;34:D204–D206. doi: 10.1093/nar/gkj103. [DOI] [PMC free article] [PubMed] [Google Scholar]
- 24.Kapp GT, Liu S, Stein A, Wong DT, Reményi A, Yeh BJ, Fraser JS, Taunton J, Lim WA, Kortemme T. Control of protein signaling using a computationally designed GTPase/GEF orthogonal pair. Proc Natl Acad Sci USA. 2012;109:5277–5282. doi: 10.1073/pnas.1114487109. [DOI] [PMC free article] [PubMed] [Google Scholar]
- 25.Babor M, Mandell DJ, Kortemme T. Assessment of flexible backbone protein design methods for sequence library prediction in the therapeutic antibody Herceptin-HER2 interface. Protein Sci. 2011;20:1082–1089. doi: 10.1002/pro.632. [DOI] [PMC free article] [PubMed] [Google Scholar]
- 26.Smith CA, Kortemme T. Backrub-like backbone simulation recapitulates natural protein conformational variability and improves mutant side-chain prediction. J Mol Biol. 2008;380:742–756. doi: 10.1016/j.jmb.2008.05.023. [DOI] [PMC free article] [PubMed] [Google Scholar]
- 27.Smith CA, Kortemme T. Structure-based prediction of the peptide sequence space recognized by natural and synthetic PDZ domains. J Mol Biol. 2010;402:460–474. doi: 10.1016/j.jmb.2010.07.032. [DOI] [PubMed] [Google Scholar]
- 28.Labute P. Protonate3D: assignment of ionization states and hydrogen coordinates to macromolecular structures. Vol. 75. Proteins: Struct Funct Bioinf; 2009. pp. 187–205. [DOI] [PMC free article] [PubMed] [Google Scholar]
- 29.Chemical Computing Group Inc. Molecular Operating Environment (MOE), Version 13. Montreal: Chemical Computing Group Inc; 2011. [Google Scholar]
- 30.Wang JM, Cieplack P, Kollman PA. How well does a restrained electrostatic potential (RESP) model perform in calculating conformational energies of organic and biological molecules? J Comput Chem. 2000;21:1049–1074. [Google Scholar]
- 31.Allen BD, Mayo SL. Dramatic performance enhancements for the FASTER optimization algorithm. J Comput Chem. 2006;27:1071–1075. doi: 10.1002/jcc.20420. [DOI] [PubMed] [Google Scholar]
- 32.Chica RA, Moore MM, Allen BD, Mayo SL. Generation of longer emission wavelength red fluorescent proteins using computationally designed libraries. Proc Natl Acad Sci USA. 2010;107:20257–20262. doi: 10.1073/pnas.1013910107. [DOI] [PMC free article] [PubMed] [Google Scholar]
- 33.Privett HK, Kiss G, Lee TM, Blomberg R, Chica RA, Thomas LM, Hilvert D, Houk KN, Mayo SL. Iterative approach to computational enzyme design. Proc Natl Acad Sci USA. 2012;109:3790–3795. doi: 10.1073/pnas.1118082108. [DOI] [PMC free article] [PubMed] [Google Scholar]
- 34.Dunbrack RL, Cohen FE. Bayesian statistical analysis pf protein side-chain rotamer preferences. Protein Sci. 1997;6:1661–1681. doi: 10.1002/pro.5560060807. [DOI] [PMC free article] [PubMed] [Google Scholar]
- 35.Mayo SL, Olafson BD, Goddard WA. Dreiding—a generic force-field for molecular simulations. J Phys Chem. 1990;94:8897–8909. [Google Scholar]
- 36.Lazaridis T, Karplus M. Effect energy function for proteins in solution. Vol. 35. Proteins: Struct Funct Bioinf; 1999. pp. 133–152. [DOI] [PubMed] [Google Scholar]
- 37.Street AG, Mayo SL. Pairwise calculation of protein solvent-accessible surface areas. Fold Des. 1998;3:253–258. doi: 10.1016/S1359-0278(98)00036-4. [DOI] [PubMed] [Google Scholar]
Associated Data
This section collects any data citations, data availability statements, or supplementary materials included in this article.
Supplementary Materials
Supplementary Information