

Abstract
Branched chain fatty acids (BCFA) are bioactive food components that constitute about 2% of fatty acids in cow’s milk fat. Little systematic information on the BCFA content of other foods is available to estimate dietary intakes. We report BCFA distribution and content of fresh and processed foods representing the major foods of Americans and estimate BCFA intake. BCFA are primarily components of dairy and ruminant foods, and were absent from chicken, pork, and salmon. Dairy and beef delivered most of the 500 mg per day mean intake; in comparison, intake of the widely studied long chain polyunsaturates eicosapentaenoic acid (EPA) and docosahexaenoic acid (DHA) is estimated to average 100 mg per day. Common adjustments in diet can double BCFA daily intake. The fermented foods sauerkraut and miso had appreciable fractions of BCFA but overall are low fat foods providing very small amounts in the diet, and other fermented foods did not contain BCFA as might have been expected from microbial exposure. These data support the quantitative importance of BCFA delivered primarily from dairy and beef and highlight the need for research into their health effects.
Introduction
Branched chain fatty acids (BCFA) are primarily saturated fatty acids (FA) with a methyl branch or more on the carbon chain. BCFA are categorized as mono-, di-, or multi-methyl BCFA. In monomethyl BCFA, the predominant branching is near the terminal end of the carbon chain. FA terminating with an isopropyl or isobutyl group are referred to as iso-or anteiso- BCFA, respectively (Figure 1). BCFA modulate the biophysical properties of membranes in a manner similar to that of cis double bonds: both interfere with the ability of saturated FA to pack tightly to form rigid, high melting point extended structures, and thus reduce the phase transition temperature of membrane phospholipids 1.
Figure 1.
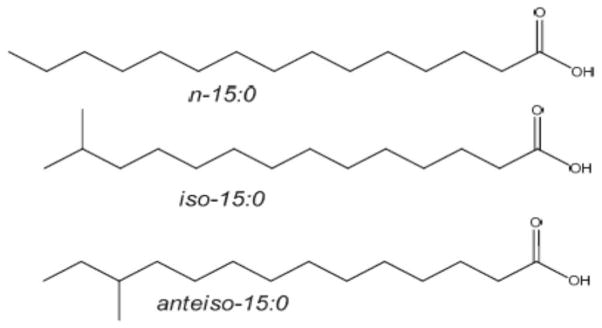
Structures and naming of representative BCFA. n- (normal) FA have no branching. iso-BCFA have a methyl branch on the penultimate carbon, and anteiso-BCFA have a methyl branch on the antepenultimate carbon.
BCFA are major components of bacterial membranes across many genera and species. They are particularly prominent in Bacilli, constituting 95% of the FA in many species of Bacilli and Lactobacilli1. In some Bifidobacterium strains a single BCFA can be as high as 24%wt 2. In bacteria that exhibit a large range of BCFA concentrations, they may influence phenotype in potentially important ways. For instance, when present in the environment they are readily taken up by the pathogen Pseudomonas aeruginosa and dramatically reduce motility and virulence3.
BCFA are rare in internal human tissues, but they are present in high concentrations in skin and in vernix caseosa, the unique waxy white substance coating the skin of term newborns, where their concentrations are about 29%wt 4, including BCFA with branches in positions other than the iso and anteiso positions, and also including dimethyl BCFA.
We reported previously 4 that BCFA are constituents of the healthy term newborn infant’s gut and that the human alimentary canal selectively metabolizes BCFA, suggesting that BCFA play specific role in the gut. Consistent with this hypothesis, our recent neonatal rat study showed that substitution of 20%wt of fat as BCFA altered the gastrointestinal (GI) microbial ecology toward organisms that use BCFA and reduced the incidence of necrotizing enterocolitis5. Others showed BCFA to induce apoptosis in human breast cancer cells, and to inhibit tumor growth in cultured cells and in a mouse model 6;7. These data all point to previously neglected nutritional properties of BCFA that may be important for development and maintenance of microbiota, enterocyte health, skin, and possibly other functions.
Information on BCFA intake in the human diet is scant. We recently reported the profile and concentrations of BCFA in a representative sampling of retail milk in the United States. Using these measurements with reports of others for beef BCFA, we estimated BCFA intake from cheese and beef products in the American diet to be about 400 mg/day. However, these calculations were based on retail milk and did not take into account changes in BCFA profiles or increase or loss in total BCFA, due to, for instance, fermentation or processing 8. Here we present BCFA analysis in foods prominently featured in the American diet, and from our measurements estimate the nutritional contribution of BCFA from these various foods in the American diet using USDA Economic Research Service intake data.
Experimental Procedures
Sampling
Food samples were purchased from local supermarkets in Ithaca, New York, USA. Because previous reports of BCFA content focus on dairy and meats, we chose a cross section from these groups and additionally added fermented foods. Particular foods were chosen based on consideration of the prevalence of consumption within respective food groups according to USDA Economic Research Service, Loss-Adjusted Food Availability data. 9
The following foods from the dairy food group were analyzed: Whole milk cheese (Bovine-milk: cheddar, low-moisture mozzarella, provolone, Swiss, cottage, ricotta, cream; two samples of ovine (sheep) milk-derived cheese (blue, romano); one sample of goat-derived), plain and Greek yogurt, and ice cream. We also analyzed dairy-based foods from the added fat food group such as sour cream, light cream and butter. However, these foods were merged with the dairy food group to simplify the analysis.
Foods were chosen for the prevalence of consumption in the dairy and protein food groups according to the USDA Economic Research Service, Loss-Adjusted Food Availability data 9. From the protein food group we analyzed ground beef, ground turkey, ham, bacon, pork sausages, chicken thigh, chicken breast, and eggs and almonds. In addition to commercial ground beef, ground beef from a private small farm in northern Pennsylvania, in which beef cattle are exclusively pastured, was also included in the analysis. The most consumed cuts of beef and pork were chosen for analysis 10; 11. Almonds, canned tuna and fresh salmon were also analyzed as part of the protein food group.
Fermented food products such as sauerkraut and miso (soy), tofu, kimchi, and tempeh were included in the analysis because the addition of bacterial/fungal during the fermentation process of these products may influence the presence of BCFA. Chocolate bars were also chosen to be included in the analysis as a fat and dairy containing snack. Samples with high content of moisture such as yogurt were placed in a centrifugal evaporator (Savant SpeedVac, Thermo Fisher), for at least 24 hours before analysis. Samples were stored in −80°C until processed.
Fatty Acid Analysis
Samples (100–150mg) from each food extracted and methylated according to a modified one-step hydrolysis, extraction and methylation procedure as described previously 12; 13. Heneicosanoic acid (21:0) was used as internal standard (Sigma Chemical Co. Chemical, St. Louis, MO). Fatty acid methyl ester (FAME) were identified and analyzed quantitatively as discussed in detail previously 8. Briefly, BPX-70 capillary column (25m × 0.22mm × 0.25μm; SGE, Austin, TX) with H2 carrier gas was installed in a HP 5890 gas chromatograph (GC) with flame ionization detector (FID). An equal weight FAME mixture (68A, Nu-Chek Prep Inc, Elysian, MN) was used to calculate response factors and six BCFA were used as authentic reference standards, iso-14:0, anteiso-15:0, iso-16:0, anteiso-17:0, iso-18:0 and iso-20:0 (Larodan Fine Chemicals AB, Malmo, Sweden). FA levels were expressed as weight % for all FA.
FAME identities were determined by electron ionization (EI) mass spectrometry (MS), chemical ionization, and electron ionization tandem mass spectrometry (EI-MS/MS) as described previously 14 using a Varian Star 3400 GC coupled to a Varian Saturn 2000 ion trap MS, with identities verified by GC retention times. For our protocols with GC-FID analysis we estimate the limit of quantification is about 0.15 ng FAME for a 1 μL injection. Here we prepared approximately 6 μg FAME mixture per 1 μL injection. These concentrations lead to limit of quantification for individual FAME of about 0.003%w/w of total FAME.
Results and Discussion
BCFA content in food samples from a U.S market
American per capita consumption of foods contained in the dairy and protein food groups, respectively, is 216g and 208g per day 9. Here, we analyzed food from both of those groups representing 160g of the 216g (74%) of daily per capita dairy consumption, and 193g of the 208g (92%) of daily per capita protein consumption. Our analysis of the dairy-based added fat food category accounted for 10 of 14g (sour cream, cream cheese, and light cream). We present results for these dairy-based added fat foods together with the dairy food group.
Table 1 provides detailed information on BCFA distribution in dairy (Table 1a), protein (Table 1b), and in fermented food products (Table 1c). BCFA were detected in dairy and beef products. Small amounts of BCFA were also detected in canned tuna and in the fermented foods miso and sauerkraut. BCFA were below detection limits in the following foods: Ground turkey, ham, bacon, pork sausages, chicken thighs, chicken breasts, eggs, almonds, tofu, tempeh, fresh salmon.
Table 1a.
Total and individual BCFA concentrations in various foods within the dairy category
| Sheep Cheese |
Goat Cheese |
Blue Cheese (sheep) |
Ice Cream |
Milk | Swiss Cheese |
Yogurt | Provolone Cheese |
American Cheese |
Ricotta Cheese |
Butter | Cottage Cheese |
Greek Yogurt |
Cheddar Cheese |
Sour Cream |
Cream Cheese |
Mozzarella Cheese |
Light cream |
|
|---|---|---|---|---|---|---|---|---|---|---|---|---|---|---|---|---|---|---|
| BCFA, %wt | ||||||||||||||||||
| TOTAL BCFA | 2.73 | 2.21 | 2.11 | 2.08 | 2.05 | 2.05 | 2.01 | 1.92 | 1.91 | 1.90 | 1.84 | 1.83 | 1.75 | 1.70 | 1.52 | 1.51 | 1.41 | 1.37 |
| iso-14:0 | 0.22 | 0.07 | 0.18 | 0.14 | 0.13 | 0.15 | 0.12 | 0.14 | 0.13 | 0.13 | 0.17 | 0.12 | 0.13 | 0.11 | 0.05 | <0.003 | 0.12 | <0.003 |
| iso-15:0 | 0.42 | 0.02 | 0.24 | 0.33 | 0.13 | 0.17 | 0.15 | 0.17 | 0.19 | 0.13 | 0.01 | 0.13 | 0.14 | 0.18 | 0.11 | 0.13 | 0.14 | <0.003 |
| anteiso-15:0 | 0.88 | 0.38 | 0.54 | 0.42 | 0.56 | 0.57 | 0.62 | 0.55 | 0.64 | 0.56 | 0.63 | 0.57 | 0.63 | 0.56 | 0.46 | 0.57 | 0.57 | 0.49 |
| iso-16:0 | 0.37 | 1.18 | 0.38 | 0.46 | 0.31 | 0.31 | 0.29 | 0.29 | 0.38 | 0.30 | 0.34 | 0.27 | 0.30 | 0.33 | 0.24 | <0.003 | 0.15 | 0.24 |
| iso-17:0 | 0.15 | 0.05 | 0.26 | 0.17 | 0.26 | 0.26 | 0.25 | 0.30 | 0.20 | 0.24 | 0.31 | 0.18 | 0.16 | 0.18 | 0.30 | 0.21 | 0.14 | 0.27 |
| anteiso-17:0 | 0.61 | 0.51 | 0.51 | 0.57 | 0.61 | 0.58 | 0.59 | 0.58 | 0.37 | 0.54 | 0.38 | 0.56 | 0.56 | 0.33 | 0.36 | 0.60 | 0.29 | 0.37 |
| iso-18:0 | 0.09 | <0.003 | <0.003 | <0.003 | 0.04 | <0.003 | 0.04 | <0.003 | <0.003 | <0.003 | <0.003 | <0.003 | <0.003 | <0.003 | <0.003 | <0.003 | <0.003 | <0.003 |
| Sum BCFA≤16 C | 1.89 | 1.65 | 1.34 | 1.35 | 1.13 | 1.20 | 1.17 | 1.15 | 0.70 | 1.12 | 1.15 | 1.09 | 1.03 | 1.18 | 0.86 | 0.70 | 0.97 | 0.73 |
| Sum BCFA>16C | 0.84 | 0.56 | 0.77 | 0.74 | 0.91 | 0.85 | 0.84 | 0.89 | 0.57 | 0.78 | 0.69 | 0.74 | 0.72 | 0.52 | 0.66 | 0.81 | 0.43 | 0.64 |
| Sum iso-BCFA | 1.24 | 1.32 | 1.06 | 1.10 | 0.87 | 0.89 | 0.85 | 0.90 | 0.90 | 0.80 | 0.83 | 0.70 | 0.71 | 0.80 | 0.70 | 0.34 | 0.54 | 0.51 |
| Sum anteiso-BCFA | 1.49 | 0.89 | 1.05 | 0.98 | 1.17 | 1.16 | 1.20 | 1.13 | 1.01 | 1.11 | 1.01 | 1.13 | 1.04 | 0.90 | 0.82 | 1.17 | 0.86 | 0.87 |
Table 1b.
Total and individual BCFA concentrations in beef and tuna. Other foods in the protein group tested were ground turkey, chicken breasts, chicken thighs, pork sausages, ham, bacon, fresh salmon, eggs, almonds; all had less than 0.003%wt BCFA.
| Pastured Beef | Commercial beef | Tuna | |
|---|---|---|---|
| BCFA. %wt | |||
| TOTAL BCFA | 1.89 | 1.60 | 0.14 |
| iso-14:0 | <0.003 | <0.003 | <0.003 |
| iso-15:0 | 0.31 | <0.003 | <0.003 |
| anteiso-15:0 | 0.24 | 0.21 | <0.003 |
| iso-16:0 | 0.25 | 0.30 | <0.003 |
| iso-17:0 | 0.41 | 0.52 | 0.14 |
| anteiso-17:0 | 0.51 | 0.57 | <0.003 |
| iso-18:0 | 0.18 | <0.003 | <0.003 |
| Sum BCFA≤16 C | 0.79 | 0.51 | 0.00 |
| Sum BCFA>16C | 0.92 | 1.09 | 0.14 |
| Sum iso-BCFA | 0.96 | 0.82 | 0.14 |
| Sum anteiso-BCFA | 0.74 | 0.78 | 0.00 |
Table 1c.
Total and individual BCFA concentrations in sauerkraut and miso. Other fermented foods tested were tofu, tempeh, and kimchi; all had less than 0.003%, wt BCFA.
| Sauerkraut | Miso | |
|---|---|---|
| BCFA. %wt | ||
| TOTAL BCFA | 1.02 | 0.54 |
| iso-14:0 | <0.003 | <0.003 |
| iso-15:0 | <0.003 | 0.08 |
| anteiso-15:0 | <0.003 | <0.003 |
| iso-16:0 | 0.23 | <0.003 |
| 2-methyl-16:0 | 0.14 | 0.46 |
| iso-17:0 | <0.003 | <0.003 |
| anteiso-17:0 | 0.35 | <0.003 |
| iso-18:0 | 0.31 | <0.003 |
| Sum BCFA≤16 C | 0.23 | 0.08 |
| Sum BCFA>16C | 0.80 | 0.46 |
| Sum iso-BCFA | 0.54 | 0.08 |
| Sum anteiso-BCFA | 0.35 | 0.00 |
The total BCFA concentrations of BCFA in the various dairy products in our study ranged between 1.37%wt for light cream cheese and 2.73%wt for sheep cheese (Table 1a). Sheep and goat milk have long been known for their higher BCFA concentrations, especially when fed a barley-rich diet 15. The relatively higher levels of BCFA in sheep and goat cheeses show that BCFA concentration in dairy products is influenced by which ruminant species milk is used. In addition, differences in cheese composition can be affected by many factors, such as the breed of cow, feeding practice, and the microbial activity in milk and cheese, especially during ripening 16. Lower concentrations of BCFA in the original milk used in the production of these cow’s milk-based products is the most likely explanation for differences in BCFA among these dairy products, particularly for low-moisture mozzarella, where the BCFA concentrations are lower compared to provolone (1.4%wt vs 1.9%wt), despite sharing a similar production process.
Figure 2 shows BCFA distribution in retail cow’s milk 8, and in the dairy products as a group which derive the bulk of their BCFA from cow’s milk. Similar to fluid milk 8, BCFA in dairy products included BCFA from both iso- and anteiso-type and contained BCFA with chain length from 14 to 17 carbons, with very few iso-18:0. In addition, the odd chain, anteiso-BCFA comprise at least half of the total BCFA in the cow’s milk-based dairy products. Our BCFA profile is in line with BCFA distribution published previously for European dairy products 17; 18.
Figure 2.

Description of individual BCFA, total BCFA, and chain length distribution of BCFA (mean ± SD) in fluid milk versus dairy products. Fluid milk data was obtained from our previous publication 8
Because introduction of bacteria is an integral part of the production of most dairy products and because bacteria can be a source of BCFA -- in addition to the inherent presence of BCFA in fluid milk -- we speculated that the total BCFA content and distribution may be different between fluid milk and dairy products, with a tendency/trend to be higher in the dairy products. Surprisingly, the collective mean levels of total BCFA, anteiso-17:0, sum of BCFA longer than 16 carbons, and the sum of anteiso-BCFA in cow’s milk-based dairy products were significantly lower than the mean BCFA levels of these aggregated parameters in retail milk. These differences are driven by the higher levels of anteiso-17:0 in retail milk compared to the collective mean of cow’s milk-based dairy product. The cows’ diet can strongly affect the levels of FA and BCFA in milk 16, and lower levels of BCFA in the milk-based dairy products observed in our study implies that bacterial BCFA may not have the same prominent effect on BCFA levels in dairy products as diet and production processes. Furthermore, it is possible that the milk BCFA used for some of the dairy products contained somewhat lower BCFA levels than average retail milk, masking possible contributions of bacterial BCFA to the final product. Alternatively, a lack of BCFA in the bacterial cultures introduced in the production of dairy foods could explain why BCFA concentrations in cow’s milk-based dairy products did not increase compared to fluid milk. A literature search for the FA composition in known dairy cultures, such as Streptococcus thermophilus and Lactobacillus bulgaricus, did not yield reports on BCFA concentrations in these strains 2; 19; 20; 21 with the exception of one report on the presence of 0.7%wt anteiso-15:0 in Lactobacillus bulgaricus. 2. However, the bacterial culture in making cheese, for example, is important for the texture and flavor of different cheeses 22, and thus it is reasonable to assume that different dairy product have different mixtures of bacterial cultures. These cultures can have both BCFA-containing bacteria strains along with non-BCFA-containing bacteria strains, and the proportions between them may affect the bacterial contribution of BCFA to the different dairy products.
In addition to dairy products, we also analyzed the most highly consumed foods from the protein food group according to the USDA Economic Research Service, Loss-Adjusted Food Availability data.9 Table 1b shows the BCFA concentrations in foods from the protein group. Commercial and pastured ground beef had total BCFA concentrations of 1.60%wt, and 1.89%wt; In a recent survey of retail beef in Canada 23 BCFA concentrations ranged between 1.25–1.82%wt depending on the season and the cut, consistent with our results. Similar to cow’s milk, BCFA concentrations in beef can be affected by the cattle’s diet, by the breed 24; 25, and by the cut of meat within a given breed 23. Finally, we note that production practice such as organic vs conventional dairy products, and wild vs farmed seafood, may all have an influence on BCFA.
BCFA concentrations were below detection limits in poultry and pork products, as would be expected if the primary origin of BCFA in meats is from rumen bacteria. These observations are in line with a previous report on FA concentrations in lard, chicken fat, mutton tallow, and beef tallow, using a GC×GC-Time of Flight mass spectrometer 26. A wide variety of BCFA were detected in beef and mutton tallow but not in chicken fat, and a small amount of anteiso-17:0 was reported in lard.
Previous reports indicate the presence of small amounts of BCFA in fish 18. Because the current 2010 Dietary Guidelines for Americans recommend consumption of two servings of 4oz each of seafood per week, we investigated the presence of BCFA in canned tuna and salmon, which, among Americans, are the second- and third-most consumed types of seafood (after shrimp), according to National Oceanic and Atmospheric Administration statistics 27. In addition, these fish are considered to be cold-water fish.
Because BCFA modulate membrane properties at low temperatures 1; 28, we speculated that BCFA may be in their membranes. Our data show BCFA levels in salmon were below detection limits, and very small amounts of iso-17:0 (0.14%wt) were detected in canned tuna. Low concentrations of BCFA in fresh tuna and in salmon were reported by others 18, and iso-BCFA in canned tuna is in agreement with the same authors’ observation that the dominant BCFA in fish are odd-numbered-carbon iso-BCFA.
Taken together, the above results indicate that BCFA are found in high concentrations in ruminant products, but not in poultry and at zero or low amounts in the fish we examined. Considering that the foods in our study were the most commonly consumed foods in the US diet, our data indicate that the main source of BCFA in the dairy and protein food groups originate from ruminant products. In addition, BCFA in cow’s milk-based dairy products were similar or lower compared to retail cow’s milk.
BCFA were also detected in fermented products such as sauerkraut and miso (Table 1c). These products undergo fermentation with various fungi and bacteria, both of which may serve as the source for BCFA in these products. Miso processing uses the fungus Aspergillus oryzae, a variety of bacterial strains such as Enterococcus and Pediococcus strains, as well as Lactobacillus and Weissella strains 29. In the current study, miso contained total BCFA concentrations of 0.54%wt. These included a small amount of iso-15:0 (0.08%wt); the rest (0.46%wt, Table 1c) was contributed by a unique BCFA with a putative assignment of 2-methyl hexadecanoic acid. This rare BCFA was also present at lower concentration in sauerkraut (0.14%wt, Table 1c). Park et al. reported the presence of Weisella in sauerkraut, which may explain the presence of this BCFA in sauerkraut and miso 30. A paper on the FA distribution in Weissela strains did not report BCFA 31.
BCFA were not detected in other fermented food products, such as kimchi or tempeh, however. Kimchi, for example, contains many different bacterial genera 32, and thus it is likely that BCFA present in some strains were diluted to below detection limits by overwhelming amounts of bacteria with normal FA. In addition, various processing methods may also influence bacterial ecology in kimchi 32 and the detection of BCFA in other fermented food products. We did not attempt here to do an exhaustive sampling of fermented foods.
Small amount of BCFA (0.15%wt) were detected in milk chocolate. The two BCFA detected in chocolate were both with 17 carbons, iso-17:0 (0.07%wt), and anteiso-17:0 (0.08%wt) (data not shown). The ratio between iso-17:0 and anteiso-17:0 in chocolate (1:1) is different from their ratio in milk (1:2 or more). This and the absence of anteiso-15:0, a predominant BCFA in milk, implies that the milk ingredient in chocolate is not solely responsible for the presence of BCFA in chocolate, and there may be another source for these two BCFA in chocolate.
BCFA intake of Americans compared to other bioactive fatty acids
The contribution of BCFA to the nutrition of Americans was estimated based on measured and estimated intake of the dairy and protein food products in our study. The intake information was estimated using the USDA loss-adjusted food bioavailability data system 9. The contribution of BCFA from various dairy products and protein food groups analyzed in the present study and for which per capita consumption data are greater than 1 g/d are shown in Table 2. The contribution of the selected foods in Table 2 to the BCFA consumption by Americans reaches about 492 mg per capita per day. Americans consume about 317 mg BCFA from dairy products, and about 170mg from beef. Chocolate contributes about 6 mg BCFA per day. BCFA are 0.6%wt and 1.9%wt from the total daily intake of 76.8g fat and the 25.5g saturated fat, respectively, for Americans two years and older.
Table 2.
Estimated intake per capita of BCFA from dairy and protein food group in the US.
| Food | Food consumed (g/d)# | Fat, %# | Fat consumed (g/d) | BCFA (%) | BCFA consumed (mg/d) |
|---|---|---|---|---|---|
| Beef (cooked) | 53.9 | 18 | 9.7 | 1.8 | 169.8 |
| Cheddar cheese | 13.7 | 33 | 4.5 | 1.7 | 76.9 |
| Butter | 3.7 | 80 | 3 | 1.7 | 54.4 |
| Mozzarella cheese | 9.1 | 22.1 | 2 | 1.4 | 28.3 |
| Plain whole milk | 40.5 | 3.3 | 1.3 | 2 | 26.3 |
| Ice cream | 11 | 11 | 1.2 | 2.1 | 25.4 |
| 2% milk | 52.7 | 2 | 1.1 | 2 | 21.1 |
| Light cream | 7.2 | 19.3 | 1.4 | 1.4 | 19.1 |
| American cheese | 2.9 | 25.6 | 0.7 | 1.9 | 14.2 |
| Sour cream | 4.1 | 19.8 | 0.8 | 1.5 | 12.3 |
| Cream cheese | 2.3 | 34 | 0.8 | 1.5 | 11.8 |
| Yogurt | 11.7 | 3.3 | 0.4 | 1.9^ | 7.2 |
| Provolone cheese | 1.2 | 26.4 | 0.3 | 1.9 | 5.9 |
| 1% milk | 20.6 | 1 | 0.2 | 2 | 4.1 |
| Swiss cheese | 0.7 | 27.6 | 0.2 | 2 | 4.1 |
| Sheep cheese$ | 0.3 | 31 | 0.1 | 2.7 | 2.5 |
| Ricotta cheese | 0.9 | 13 | 0.1 | 1.9 | 2.2 |
| Blue cheese (sheep) | 0.1 | 28.5 | 0 | 2.1 | 0.7 |
| Cottage cheese | 0.8 | 4.3 | 0 | 1.8 | 0.6 |
| Tuna (canned) | 2.6 | 4.6^ | 0.1 | 0.1 | 0.2 |
| Chocolate^ | 12.6 | 30 | 3.8 | 0.1 | 5.7 |
| Total BCFA | 492 |
Data are from USDA loss-adjusted food bioavailability data system <http://www.ers.usda.gov/data-products/food-availability-(per-capita)-data-system.aspx> and on fat content from USDA National Nutrient Database for Standard Reference, Release 25, http://www.ars.usda.gov/Services/docs.htm?docid=8964, and USDA-ARS 2012. Nutrient Intakes from Food: Mean Amounts Consumed per Individual, by Gender and Age, What We Eat in America, NHANES 2009–2010. Available: www.ars.usda.gov/ba/bhnrc/fsrg. Both databases accessed December 2012.
Per capita consumption information obtained from the following sources:
• - Sheep cheese consumption from reference 44
Chocolate consumption in the US was taken from Seligson et al 45.
For estimation of intake, the following were calculated and used: Yogurts: mean BCFA in the two major styles (plain and Greek yogurts); Beef: mean BCFA levels in retail and small farm pasture-fed beef; Tuna: Mean fat concentrations in tuna canned in oil and tuna canned in water.
Notable examples of foods excluded from Table 1 are goat cheese, which contains relatively large amounts of fat (27%) and BCFA (2.2%wt) but has no per capita consumption information, miso (per capita consumption is not tabulated), and sauerkraut because its per capita consumption is very small (<0.4g/day) and fat contribution is negligible.
The estimated per capita intake of BCFA from the dairy and protein sources of 492 mg/d is greater than the 100 mg average daily consumption of the docosahexaenoic acid (DHA) and eicosapentaenoic acid (EPA) reported in a survey of 8604 Americans between 1999 and 2000 and by women of child-bearing age, based on NHANES III data 33; 34. The per capita estimated intake of BCFA is higher than the recommendation for DHA and EPA intake for pregnant and lactating women 34. Therefore the consumption of BCFA from dairy and protein food is almost five times the consumption of DHA and EPA in the US (Figure 3). As a reference, DHA intake of 200 mg per day, and 300 mg combined DHA+EPA, is recommended for pregnant and lactating women to support infant development by the Food and Agriculture Organization and World Health Organization 35.
Figure 3.

Daily BCFA intake (mg/d) versus intake of bioactive FA DHA and EPA, all calculated from USDA intake data. See text for details.
For children ages 2–11 years, the mean intake of beef is 43.5 g/d.36 Children who consume 28 g (1 oz) of cow’s milk-based cheese with an average of 25% fat, and 43.5 g/d of cooked beef with an average of 18% fat, both with average of 1.8%wt BCFA, consume about 267 mg BCFA per day. Addition of 1 cup of whole milk (156 mg BCFA) increases their daily BCFA intake to 423 mg. For comparison, the mean intake of DHA and arachidonic acid (ARA) in Canadian children, ages 4–7 years, was recently estimated to be 37 mg and 57mg per day 37; both combined are almost about one fifth of the daily BCFA consumption from milk, cheese and beef.
Taken together, the calculations shown above imply that BCFA are being consumed in substantial amounts by most non-vegans, during different life stages, and their consumption exceeds the consumption of bioactive FA.
Our data indicate that BCFA intake can exceed the estimated per capita consumption of 492 mg/d by at least two-fold with common intakes of popular foods. For example, daily consumption of 150 g (5.3 oz) of cooked ground beef (18% fat, with 1.8%wt BCFA on average), two cups (473 ml) of whole milk (3.25%fat, 2%wt BCFA), and 57 g (2 oz) of cow’s milk-based cheese (25% fat, 1.8%wt BCFA on average) contains about 1050 mg BCFA. If the cows’ milk cheese was replaced with sheep cheese (31% fat and 2.7%wt BCFA), then the meal BCFA would exceed 1700 mg BCFA, or three fold the average intake.
The 2010 Dietary Guidelines for Americans 38 recommend that Americans consume low-fat ruminant products in order to lower consumption of saturated fat and to reduce risk for metabolic diseases. Our results indicate that a higher intake of BCFA is due to the consumption of animal fat and more specifically foods of ruminant origin, with the leading foods in the American diet being dairy and beef. A recent meta-analysis of prospective cohort studies failed to find a significant relation between dietary saturated fat intake and cardiovascular disease (CVD) 39. Others showed 40 that increased consumption of high-fat dairy products did not significantly increase the odds ratio for obesity, abnormal glucose homeostasis, dyslipidemia, elevated blood pressure, or insulin resistance. In fact, the odds ratios for these disorders were lower with increasing intake of both reduced-fat and high-fat dairy products, and inverse associations were observed for both reduced-fat and high-fat dairy products. Another study reported a non-significant trend toward lower risk for first myocardial infarction (MI) with consumption of high-fat dairy compared to low-fat dairy 41. Another meta-analysis found no association between animal fat intake and colorectal cancer 42. Others showed 43 that intake of saturated fat from an animal source was not significantly associated with risk of colorectal cancer in women; in that study, consumption of red meat was negatively associated with risk of colorectal cancer. These studies highlight evolving science on saturated fat intake and disease risks, indicating that the effect of saturated fat or animal fat consumption on metabolic diseases and cancer is complex.
BCFA are normal constituents in the gut from very early age, and they are present in the gut throughout the human life cycle. Previous studies show that BCFA are not inert components of the GI tract and are metabolized by the enterocytes. BCFA have beneficial role against inflammation in the premature intestine, alter the microbiota, and increase expression of anti-inflammatory cytokines in an animal model. These studies show that BCFA may have a beneficial effect on proper gut functions, thus, their intake in the population becomes relevant. The present study is the first to investigate a wide range of products consumed by the US population. Our data shows that the consumption of BCFA per capita per day is substantial, and is above the consumption of bioactive n-3 FA such as EPA and DHA. The prominence of BCFA in the US food supply and their bioactivity strongly suggest that BCFA health effects should be studied.
Acknowledgments
This work was supported by NIH grants T32 HD007331 and R21 HD064604.
References
- 1.Kaneda T. Iso- and anteiso-fatty acids in bacteria: biosynthesis, function, and taxonomic significance. Microbiol Rev. 1991;55:288–302. doi: 10.1128/mr.55.2.288-302.1991. [DOI] [PMC free article] [PubMed] [Google Scholar]
- 2.Veerkamp JH. Fatty acid composition of Bifidobacterium and Lactobacillus strains. J Bacteriol. 1971;108:861–867. doi: 10.1128/jb.108.2.861-867.1971. [DOI] [PMC free article] [PubMed] [Google Scholar]
- 3.Inoue T, Shingaki R, Fukui K. Inhibition of swarming motility of Pseudomonas aeruginosa by branched-chain fatty acids. FEMS Microbiol Lett. 2008;281:81–86. doi: 10.1111/j.1574-6968.2008.01089.x. [DOI] [PubMed] [Google Scholar]
- 4.Ran-Ressler RR, Devapatla S, Lawrence P, et al. Branched chain fatty acids are constituents of the normal healthy newborn gastrointestinal tract. Pediatr Res. 2008;64:605–609. doi: 10.1203/PDR.0b013e318184d2e6. [DOI] [PMC free article] [PubMed] [Google Scholar]
- 5.Ran-Ressler RR, Khailova L, Arganbright KM, et al. Branched chain Fatty acids reduce the incidence of necrotizing enterocolitis and alter gastrointestinal microbial ecology in a neonatal rat model. PLoS One. 2011;6:e29032. doi: 10.1371/journal.pone.0029032. [DOI] [PMC free article] [PubMed] [Google Scholar]
- 6.Yang Z, Liu S, Chen X, et al. Induction of apoptotic cell death and in vivo growth inhibition of human cancer cells by a saturated branched-chain fatty acid, 13-methyltetradecanoic acid. Cancer Res. 2000;60:505–509. [PubMed] [Google Scholar]
- 7.Wongtangtintharn S, Oku H, Iwasaki H, et al. Effect of branched-chain fatty acids on fatty acid biosynthesis of human breast cancer cells. J Nutr Sci Vitaminol (Tokyo) 2004;50:137–143. doi: 10.3177/jnsv.50.137. [DOI] [PubMed] [Google Scholar]
- 8.Ran-Ressler RR, Sim D, O’Donnell-Megaro AM, et al. Branched chain fatty acid content of United States retail cow’s milk and implications for dietary intake. Lipids. 2011;46:569–576. doi: 10.1007/s11745-011-3530-8. [DOI] [PMC free article] [PubMed] [Google Scholar]
- 9.USDA. [accessed January, 2013 2013];Loss-Adjusted Food. 2012 Availability data http://www.ers.usda.gov/data-products/food-availability-(per-capita)-data-system.aspx#26705.
- 10.Davis CG, Lin BH. Factors Affecting US Beef Consumption. Washington, DC: USDA; 2005. [Google Scholar]
- 11.Davis CG, Lin BH. Factors Affecting US Pork Consumption. Washington, DC: USDA; 2005. [Google Scholar]
- 12.Garces R, Mancha M. One-step lipid extraction and fatty acid methyl esters preparation from fresh plant tissues. Anal Biochem. 1993;211:139–143. doi: 10.1006/abio.1993.1244. [DOI] [PubMed] [Google Scholar]
- 13.Zhou Y, Nijland M, Miller M, et al. The influence of maternal early to mid-gestation nutrient restriction on long chain polyunsaturated fatty acids in fetal sheep. Lipids. 2008;43:525–531. doi: 10.1007/s11745-008-3186-1. [DOI] [PubMed] [Google Scholar]
- 14.Ran-Ressler RR, Lawrence P, Brenna JT. Structural characterization of saturated branched chain fatty acid methyl esters by collisional dissociation of molecular ions generated by electron ionization. J Lipid Res. 2012;53:195–203. doi: 10.1194/jlr.D020651. [DOI] [PMC free article] [PubMed] [Google Scholar]
- 15.Duncan WR, Garton GA. Differences in the proportions of branched-chain fatty acids in subcutaneous triacylglycerols of barley-fed ruminants. Br J Nutr. 1978;40:29–33. doi: 10.1079/bjn19780092. [DOI] [PubMed] [Google Scholar]
- 16.Bonanno A, Tornambe G, Bellina V, et al. Effect of farming system and cheesemaking technology on the physicochemical characteristics, fatty acid profile, and sensory properties of Caciocavallo Palermitano cheese. J Dairy Sci. 2013;96:710–724. doi: 10.3168/jds.2012-5973. [DOI] [PubMed] [Google Scholar]
- 17.Thurnhofer S, Lehnert K, Vetter W. Exclusive quantification of methyl-branched fatty acids and minor 18:1-isomers in foodstuff by GC/MS in the SIM mode using 10,11-dichloroundecanoic acid and fatty acid ethyl esters as internal standards. Eur Food Res Technol. 2008;226:975–983. [Google Scholar]
- 18.Hauff S, Vetter W. Quantification of branched chain fatty acids in polar and neutral lipids of cheese and fish samples. J Agric Food Chem. 2010;58:707–712. doi: 10.1021/jf9034805. [DOI] [PubMed] [Google Scholar]
- 19.Smittle RB, Gilliland SE, Speck ML, et al. Relationship of cellular fatty acid composition to survival of Lactobacillus bulgaricus in liquid nitrogen. Appl Microbiol. 1974;27:738–743. doi: 10.1128/am.27.4.738-743.1974. [DOI] [PMC free article] [PubMed] [Google Scholar]
- 20.Beal C, Fonseca F, Corrieu G. Resistance to freezing and frozen storage of Streptococcus thermophilus is related to membrane fatty acid composition. J Dairy Sci. 2001;84:2347–2356. doi: 10.3168/jds.S0022-0302(01)74683-8. [DOI] [PubMed] [Google Scholar]
- 21.Tymczyszyn EE, Gomez-Zavaglia A, Disalvo EA. Influence of the growth at high osmolality on the lipid composition, water permeability and osmotic response of Lactobacillus bulgaricus. Arch Biochem Biophys. 2005;443:66–73. doi: 10.1016/j.abb.2005.09.004. [DOI] [PubMed] [Google Scholar]
- 22.Randazzo CL, De Luca S, Todaro A, et al. Preliminary characterization of wild lactic acid bacteria and their abilities to produce flavour compounds in ripened model cheese system. J Appl Microbiol. 2007;103:427–435. doi: 10.1111/j.1365-2672.2006.03261.x. [DOI] [PubMed] [Google Scholar]
- 23.Aldai N, Dugan MER, Rolland DC, et al. Survey of the fatty acid composition of Canadian beef: Backfat and longissimus lumborum muscle. Canadian Journal of Animal Science. 2009;89:315–329. [Google Scholar]
- 24.Kraft J, Kramer JK, Schoene F, et al. Extensive analysis of long-chain polyunsaturated fatty acids, CLA, trans-18:1 isomers, and plasmalogenic lipids in different retail beef types. J Agric Food Chem. 2008;56:4775–4782. doi: 10.1021/jf8001813. [DOI] [PubMed] [Google Scholar]
- 25.Costa AS, Lopes PA, Estevao M, et al. Contrasting cellularity and fatty acid composition in fat depots from Alentejana and Barrosa bovine breeds fed high and low forage diets. Int J Biol Sci. 2012;8:214–227. doi: 10.7150/ijbs.8.214. [DOI] [PMC free article] [PubMed] [Google Scholar]
- 26.Chin ST, Man YBC, Tan CP, et al. Rapid Profiling of Animal-Derived Fatty Acids Using Fast GC x GC Coupled to Time-of-Flight Mass Spectrometry. Journal of the American Oil Chemists Society. 2009;86:949–958. [Google Scholar]
- 27.NOAA. [accessed March 2013];NOAA Fisheries. 2013 http://www.nmfs.noaa.gov/aquaculture/faqs/faq_seafood_health.html#6how.
- 28.Annous BA, Becker LA, Bayles DO, et al. Critical role of anteiso-C15:0 fatty acid in the growth of Listeria monocytogenes at low temperatures. Appl Environ Microbiol. 1997;63:3887–3894. doi: 10.1128/aem.63.10.3887-3894.1997. [DOI] [PMC free article] [PubMed] [Google Scholar]
- 29.Onda T, Yanagida F, Tsuji M, et al. Time series analysis of aerobic bacterial flora during Miso fermentation. Lett Appl Microbiol. 2003;37:162–168. doi: 10.1046/j.1472-765x.2003.01371.x. [DOI] [PubMed] [Google Scholar]
- 30.Park EJ, Kim KH, Abell GC, et al. Metagenomic analysis of the viral communities in fermented foods. Appl Environ Microbiol. 2011;77:1284–1291. doi: 10.1128/AEM.01859-10. [DOI] [PMC free article] [PubMed] [Google Scholar]
- 31.Samelis J, Rementzis J, Tsakalidou E, et al. Usefulness of rapid GC analysis of cellular fatty acids for distinguishing Weissella viridescens, Weissella paramesenteroides, Weissella hellenica and some non-identifiable, arginine-negative Weissella strains of meat origin. Syst Appl Microbiol. 1998;21:260–265. doi: 10.1016/S0723-2020(98)80031-3. [DOI] [PubMed] [Google Scholar]
- 32.Park EJ, Chun J, Cha CJ, et al. Bacterial community analysis during fermentation of ten representative kinds of kimchi with barcoded pyrosequencing. Food Microbiol. 2012;30:197–204. doi: 10.1016/j.fm.2011.10.011. [DOI] [PubMed] [Google Scholar]
- 33.Ervin RB, Wright JD, Wang CY, et al. Dietary intake of fats and fatty acids for the United States population: 1999–2000. Adv Data. 2004:1–6. [PubMed] [Google Scholar]
- 34.Brenna JT, Lapillonne A. Background paper on fat and fatty acid requirements during pregnancy and lactation. Ann Nutr Metab. 2009;55:97–122. doi: 10.1159/000228998. [DOI] [PubMed] [Google Scholar]
- 35.Anonymous. Fats and fatty acids in human nutrition. Report of an expert consultation. FAO Food and Nutrition Paper 91. Food and Agriculture Organization of the United Nations; 2010. [PubMed] [Google Scholar]
- 36.Daniel CR, Cross AJ, Koebnick C, et al. Trends in meat consumption in the USA. Public Health Nutr. 2011;14:575–583. doi: 10.1017/S1368980010002077. [DOI] [PMC free article] [PubMed] [Google Scholar]
- 37.Lien VW, Clandinin MT. Dietary assessment of arachidonic acid and docosahexaenoic acid intake in 4–7 year-old children. J Am Coll Nutr. 2009;28:7–15. doi: 10.1080/07315724.2009.10719755. [DOI] [PubMed] [Google Scholar]
- 38.USDA. Dietary Guidelines for Americans. USDA; 2010. [Google Scholar]
- 39.Siri-Tarino PW, Sun Q, Hu FB, et al. Meta-analysis of prospective cohort studies evaluating the association of saturated fat with cardiovascular disease. Am J Clin Nutr. 2010;91:535–546. doi: 10.3945/ajcn.2009.27725. [DOI] [PMC free article] [PubMed] [Google Scholar]
- 40.Pereira MA, Jacobs DR, Jr, Van Horn L, et al. Dairy consumption, obesity, and the insulin resistance syndrome in young adults: the CARDIA Study. JAMA. 2002;287:2081–2089. doi: 10.1001/jama.287.16.2081. [DOI] [PubMed] [Google Scholar]
- 41.Lockheart MS, Steffen LM, Rebnord HM, et al. Dietary patterns, food groups and myocardial infarction: a case-control study. Br J Nutr. 2007;98:380–387. doi: 10.1017/S0007114507701654. [DOI] [PubMed] [Google Scholar]
- 42.Alexander DD, Cushing CA, Lowe KA, et al. Meta-analysis of animal fat or animal protein intake and colorectal cancer. Am J Clin Nutr. 2009;89:1402–1409. doi: 10.3945/ajcn.2008.26838. [DOI] [PubMed] [Google Scholar]
- 43.Lin J, Zhang SM, Cook NR, et al. Dietary fat and fatty acids and risk of colorectal cancer in women. Am J Epidemiol. 2004;160:1011–1022. doi: 10.1093/aje/kwh319. [DOI] [PubMed] [Google Scholar]
- 44.National_Research_Council. Changes in the Sheep Industry in the United States: Making the Transition from Tradition” Authors: Committee on the Economic Committee on the Economic Development and Current Status of the Sheep Industry in the United States, National Research Council. Chapter 6. Washington, DC: National Research Council; 2008. [Google Scholar]
- 45.Seligson FH, Krummel DA, Apgar JL. Patterns of chocolate consumption. Am J Clin Nutr. 1994;60:1060S–1064S. doi: 10.1093/ajcn/60.6.1060S. [DOI] [PubMed] [Google Scholar]