

Abstract
Objective
Diabetes is an increasing health problem among Native Hawaiians. Diabetes is a risk factor for cardiovascular disease (CVD), the leading cause of death among Native Hawaiians. In this article, the prevalence of diabetes is reported and associations with CVD risk factors are examined.
Design and Methods
Cross-section of 862 Native Hawaiians, ages 19–88. Physical exam included anthropometric measures, blood pressure, glucose and lipid measures, and personal interview.
Results
Age-adjusted prevalences of diabetes (25.1% in men vs. 22.6% in women) and impaired fasting glucose (IFG) (47.8% vs. 39.3%) increased with age and were higher in men. Fasting glucose was higher in diabetic men than women (209 mg/dL vs. 179, p = .0117). BMI, waist circumference, systolic blood pressure, triglycerides, and low-density lipoprotein cholesterol were higher in diabetic participants (all p < .01), and high-density lipoprotein cholesterol was lower (p < .005).
Conclusions
Diabetes prevalence in Native Hawaiians is high. The high proportion with IFG and the increase in CVD risk factors with diabetes suggest that community-based programs are needed to focus on diabetes and diabetes-related CVD.
Introduction
Polynesian Peoples have experienced a rapid rise in diabetes prevalence over the last 40 years.1–8 The National Center for Health Statistics reports no data on diabetes in Native Hawaiians, the indigenous people of the Hawaiian Islands. Data from the Hawai’i Behavioral Risk Factor Surveillance System (BRFSS)9 and US state mortality data, however, suggest that diabetes occurs at high rates in Native Hawaiians.10,11 Diabetes is a major determinant of cardiovascular disease (CVD), the leading cause of death in Native Hawaiians.12,13 The overall age- and gender-specific mortality rates due to heart disease are 66% greater among Native Hawaiians than among Caucasians in Hawai’i.14 The Hawai’i Department of Health reported in 2005 that 71% of all deaths were attributable to heart disease. The CVD death rate per 100,000 was 205.3 statewide and 313.9 among Native Hawaiians/part Native Hawaiians.15 Individual populations may differ in their CVD risk factor profiles because of individual genetic and socioeconomic characteristics.16 Thus, systematic data on diabetes prevalence and CVD risk factors in Native Hawaiians with diabetes are needed to tailor community and institutional prevention and treatment programs.
The Cardiovascular Risk Clinics (CRCs) were initiated by the Native Hawaiian community to screen for CVD risk factors, including diabetes, among Native Hawaiians on the island of Moloka‘i. A large proportion of the adult population participated in these clinics, thus providing systematic cross-sectional data on the cardiovascular risk status of Native Hawaiians. In this article, data are presented on standardized and age-specific prevalence rates of diabetes and impaired fasting glucose (IFG) in Native Hawaiians, and CVD risk factors in Native Hawaiian men and women with and without diabetes are compared.
Methods
Study Population
The CRC is a screening program initiated in 1992 and implemented by Na Pu‘uwai, the Native Hawaiian health care system serving the island of Moloka‘i, to identify adults at risk for CVD and refer them to health care services. Native Hawaiian men and non-pregnant women ≥age 18 were recruited for participation in the CRCs. Recruitment strategies included mailings and direct contact by community health workers. CRCs were conducted in the town and also in remote communities on the island. Although recruitment was not systematically population-based, efforts were made to identify and contact all Native Hawaiian residents and accommodations made to ensure participation regardless of socio-economic status or health condition.
The cohort consisted of 1,064 men and women, ≥age 18, examined as participants of the CRC program between 1992 and 1998.17 This group represented approximately half the adult Native Hawaiian population of the island in that age range at the time. The only data available to allow comparisons between our study population and the population of Moloka‘i as a whole are from the US census. However, the population covered by the US census differs from our population in age, proportion of self-identified Native Hawaiians, and average household income. Therefore, we cannot make direct comparisons between participants and non-participants.18,19 Of our cohort, 74 who identified themselves as non-Native Hawaiian and 126 for whom diabetes status could not be determined were excluded, leaving 862 participants (345 men and 517 women, ages 19–88) for the analysis.
Examination Methods
The examination consisted of a questionnaire evaluating behavioral risk factors, including smoking, alcohol use, physical activity, and diet; measurements of height, weight, waist and hip circumference, and blood pressure (BP); a urine test for protein and glucose; and a fasting blood sample for cholesterol, triglycerides (TGs), high-density lipoprotein cholesterol (HDL-C), low-density lipoprotein cholesterol (LDL-C), A1c, and glucose. Systolic and diastolic BPs were averaged from the second and third of consecutive resting measures taken with a standard arm cuff and aneroid sphygmomanometer. Participants were considered hypertensive if they reported a previous diagnosis of hypertension, took antihypertensive medication, or had a systolic BP (SBP) ≥140 mmHg or a diastolic BP of ≥90 mmHg. BMI was calculated by the equation (weight (lb)/[height (in)]2 × 703). Total cholesterol (TC), HDL-C, TG, and glucose concentrations were determined by enzymatic methods using a Roche Hitachi 747 chemistry analyzer and consistent, standardized reagents (Boehringer Mannheim, Indianapolis, IN). LDL-C was calculated in those with TG<400 using the equation (TC-HDL-(TG/5). Diabetes duration was determined by questionnaire.
Diabetes was identified by self-report or fasting glucose (FG) ≥126 mg/dL; IFG was defined as FG 100–125 mg/dL in participants without diabetes. Use of hypoglycemic agents was not ascertained.
Statistical Methodology
Prevalence rates for diabetes and IFG were analyzed by age and gender. The direct method was used to adjust diabetes and IFG prevalence rates to age data from the 1995 US Census.20 Means for continuously distributed variables were compared in men and women and by diabetic status using t tests. A chi-square test was used to compare categorical variables. Variables that were not normally distributed were log-transformed for comparisons.
Results
Average age was 46, and 57.4% were obese with central fat distribution as indicated by waist circumferences averaging 40 inches in men and 38 inches in women (Table 1). BP and lipid values varied widely. Average age and BMI in men and women were similar, but men had slightly higher BP, lower HDL-C, and were more apt to be smokers.
Table 1.
Cardiovascular risk factors by gender, Native Hawaiians participating in Cardiovascular Risk Clinics, 1992–1998
| Characteristic | Men % or Mean (range) | Women % or Mean (range) | Total % or Mean (range) |
|---|---|---|---|
| N | 345 | 517 | 862 |
| Age (years) | 45 (19–85) | 46 (19–88) | 46 (19–88) |
| Body mass index (BMI) (kg/m2) | 32.7 (18.7–69.0) | 32.6 (18.3–88.1) | 32.6 (18.3–88.1) |
| Waist circumference (inches) | 40.3 (17–77) | 38 (20–80) | 39 (17–80) |
| Current smoker (%) | 28.6 | 25.1 | 26.5 |
| Hypertensive (%)1 | 45.8 | 38.1 | 41.2 |
| Systolic blood pressure (mmHg) | 131 (57–214) | 127 (73–220) | 129 (57–220) |
| Diastolic blood pressure (mmHg) | 85 (45–129) | 81 (33–131) | 83 (33–131) |
| LDL cholesterol (mg/dL) | 132 (39–400)* | 133 (48–400)* | 133 (39–400)* |
| HDL cholesterol (mg/dL) | 40 (19–81) | 45 (23–100) | 43 (19–100) |
| Triglycerides (mg/dL) | 205 (38–999)** | 148 (30–997) | 171 (30–999)** |
Defined as systolic/diastolic ≥140/90 mm Hg or self-report of previous diagnosis of hypertension or self-report of taking antihypertensive medication;
Upper lab limit = 400 mg/dL;
Upper lab limit = 999mg/dL.
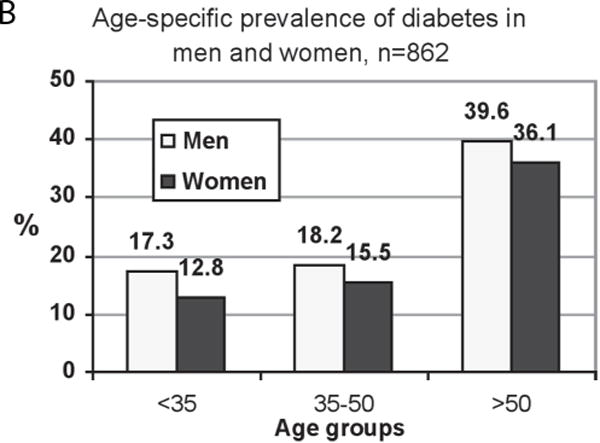
Diabetes prevalence rates were slightly but not significantly higher in men than in women (Table 2; Figure 1). Age-adjusted rates were 25.1 (men) vs. 22.6% (women). IFG prevalence (Table 2; Figure 1) was higher in men than women (p = .0053) and was higher than diabetes prevalence in both genders. Rates of diabetes and IFG (Table 2) increased with age in both genders, so that in men and women over age 50, 39.6% and 36.1% had diabetes, respectively, and an additional 58.6% and 54.5% had IFG. Of those with diabetes, many had not been diagnosed (Table 3); rates of undiagnosed diabetes were highest in the younger men. Diabetes control as indicated by fasting glucose levels was significantly higher in men (mean = 209, SD = 91) than in women (mean = 179, SD = 75) (p = .0117) but appeared not to differ by age.
Table 2.
| Men | Women | P for gender difference (Diabetes)3 | P for gender difference (IFG)4 | |||||||||
|---|---|---|---|---|---|---|---|---|---|---|---|---|
| Diabetes | IFG | Diabetes | IFG | |||||||||
| Age | N | % | Mean Duration* | N | % | N | % | Mean Duration** | N | % | ||
| < 35 | 139 | 17.3 | 1.5 | 115 | 47.0 | 204 | 12.8 | 3.3 | 178 | 27.5 | 0.2441 | 0.0007 |
| 35–50 | 110 | 18.2 | 3.3 | 90 | 37.8 | 155 | 15.5 | 5.6 | 131 | 32.1 | 0.5609 | 0.3794 |
| > 50 | 96 | 39.6 | 11.0 | 58 | 58.6 | 158 | 36.1 | 8.9 | 101 | 54.5 | 0.5754 | 0.6105 |
| Total | 345 | 23.8 | 8.1 | 263 | 46.4 | 517 | 20.7 | 7.4 | 410 | 35.6 | 0.2855 | 0.0053 |
Defined as self-reported or fasting blood glucose ≥126 mg/dL;
Defined as fasting glucose level 100–125 mg/dL exclusive of diabetes (self-reported and newly diagnosed);
Chi-square tests of difference in proportion of men and women with diabetes in each age group;
Chi-square tests of difference in proportion of men and women with IFG in each age group;
By age-group missing duration data; < 35, n = 20 (83%); 35–50, n = 8 (40%); > 50, n = 9 (24%);
By age-group missing duration data; < 35, n = 20 (80%); 35–50, n = 8 (33%); > 50, n = 22 (39%).
Figure 1.


A – Diabetes prevalence in Native Hawaiians, age-adjusted to the 1995 US Census population data
B – Age –specific diabetes prevalence in Native Hawaiians
C – Impaired fasting glucose (IFG) prevalence in Native Hawaiians, age-adjusted to the 1995 US Census population data
Table 3.
Prevalence of undiagnosed diabetes in Native Hawaiians, by age, n = 155
| Men | Women | ||||||
|---|---|---|---|---|---|---|---|
| Age-group | N | % Self-reported | % New diagnosis | N | % Self-reported | % New diagnosis | P-value1 |
| <35 | 10* | 40.0 | 60.0 | 8** | 87.5 | 12.5 | 0.0528 |
| 35–50 | 20 | 65.0 | 35.0 | 23 | 73.9 | 26.1 | 0.5256 |
| >50 | 38 | 81.6 | 18.4 | 56 | 62.5 | 37.5 | 0.0471 |
| Total | 68 | 70.6 | 29.4 | 87 | 67.8 | 37.2 | 0.7111 |
Fisher’s exact test of difference in proportion of men and women with undiagnosed diabetes in the age group < 35; chi-square tests of difference in proportion of men and women with undiagnosed diabetes in remaining categories;
N = 14 men in this age group with FG ≥126 mg/dL were missing data for self-report and excluded from analysis for this table;
N = 18 women in this age group with FG ≥126 mg/dL were missing data for self-report and excluded from analysis for this table. In each of the other age groups, one woman with diagnosed diabetes was missing self-report data for diabetes.
Diabetes was associated with greater prevalence of CVD risk factors in men and women, except for smoking (Table 4). In both genders, those with diabetes were more obese and had greater waist circumferences. In men and women with diabetes, the average SBPs were 16 and 12 mmHg higher than in those without, respectively. Diabetes was associated with significant dyslipidemia. Higher levels of LDL-C (difference of 24 mg/dL [men] and 28 mg/dL [women]) and TGs (difference of 102 mg/dL [men] and 95 mg/dL [women]) and lower levels of HDL-C (4 mg/dL [men and women]) were seen in those with diabetes. Smoking rates were higher in men than women but did not differ significantly between those with and without diabetes in either gender.
Table 4.
Risk factors for cardiovascular disease in Native Hawaiians, with and without diabetes
| Men | Women | |||||
|---|---|---|---|---|---|---|
| Characteristic | No Diabetes1 % or Mean (SD) | Diabetes1 % or Mean (SD) | P-value3 | No Diabetes1 % or Mean (SD) | Diabetes1 % or Mean (SD) | P-value3 |
| N | 263 | 82 | 410 | 107 | ||
| Age (years) | 43 (15) | 50 (14) | 0.0001 | 44.4 (15.8) | 53.1 (13.2) | <0.001 |
| Body mass index (BMI) (kg/m2) | 31.8 (7.0) | 35.4 (9.0) | 0.0036 | 31.2 (8.6) | 35.7 (8.7) | 0.0002 |
| Waist circumference (inches) | 39.4 (7.8) | 42.8 (7.7) | 0.0012 | 37.0 (7.4) | 40.8 (6.3) | <0.0001 |
| Current smoker (%) | 28.1 | 30.4 | 0.7034 | 26.0 | 23.0 | 0.4112 |
| Hypertensive2 (%) | 41.4 | 59.8 | 0.0037 | 32.4 | 59.8 | <0.0001 |
| Systolic blood pressure (mmHg) | 128 (19) | 144 (60) | 0.0400 | 125 (21) | 137 (20) | <0.0001 |
| Diastolic blood pressure (mmHg) | 85 (13) | 86 (10) | 0.2611 | 80 (12) | 83 (12) | 0.0517 |
| LDL cholesterol (mg/dL) | 127 (33) | 151 (72) | 0.0086 | 127 (38) | 155 (68) | 0.0002 |
| HDL cholesterol (mg/dL) | 41 (11) | 37 (10) | 0.0049 | 46 (11) | 42 (9) | <0.0001 |
| Triglycerides (mg/dL) | 181 (152) | 283 (219) | 0.0002 | 128 (72) | 223 (164) | <0.0001 |
Defined as self-reported or fasting blood glucose ≥126 mg/dL;
Defined as systolic/diastolic blood pressure ≥140/90 mm Hg or self-report of previous diagnosis of hypertension or self-report of taking antihypertensive medication;
Chi-square tests of difference in proportion or t-tests of difference in means.
Discussion
The results of this systematic analysis of Native Hawaiians showed that 24% of adult men and 21% of adult women had diabetes (Table 2). An additional 46% (men) and 36% (women) had IFG, and a high proportion of the diabetes was undiagnosed, especially in younger men. Both diabetes and IFG increased with age so that in the group over age 50, approximately 37% had diabetes and more than 56% had IFG. Except for smoking, diabetes was associated with higher prevalence of CVD risk factors, including increased rates of dyslipidemia and hypertension. Obesity and central obesity also were higher in those with diabetes.
Previous reports of diabetes rates among Native Hawaiians have been published, most of which are from comparisons of several ethnic groups in Hawai’i.21,22 In 1958, age-adjusted diabetes prevalence rates in Native Hawaiians and part Native Hawaiians on the island of O‘ahu were reported to be 4.9% and 2.7%, respectively, and 1974–197523 state health data reported diabetes rates of 2% and 2.2%, respectively, in Native Hawaiian men and women. These numbers were based on self-report. From 1980–1986, age-adjusted diabetes prevalence rates in Native Hawaiian men and women were reported to be 3.0% and 3.1%.2 In 1985 a report from the Moloka‘i Heart Study, a cross-sectional survey of CVD risk factors in a group of 257 residents of the island, reported diabetes prevalences of 15% (ages 40–49) and 20% (ages 50–59).3 Finally, a 1998 study21 that included 574 Native Hawaiian adults from the islands of Hawai’i (North Kohala) and Kaua‘i reported 20.4% age-adjusted diabetes prevalence rates in both genders.
Although methods varied, the overall pattern shows increasing prevalence of diabetes over the past 50 years in Native Hawaiians. The current report suggests slightly higher rates than those in the North Kohala and Kaua‘i studies, although laboratory methods may not be comparable and it is not clear what proportion of the population was sampled in the North Kohala and Kaua‘i studies. A pattern of increasing diabetes has been observed during the past 50 years in all US populations and around the world.24–27 It is likely that in Native Hawaiians, as in all populations, the increases are attributable to increasing rates of obesity and increasingly sedentary lifestyles.28–31 Only one previous study21 addressed the issue of unrecognized diabetes (44% using WHO criteria), showing a prevalence similar to that observed in the present study.
Population-based data available on other Polynesian groups who are ethnically related to Native Hawaiians show similar rates of diabetes. In 2001, Simmons et al.7 found rates of 21.1% and 25.0% in Maoris and other Polynesians, respectively. Earlier work from 1995 showed increasing rates of diabetes in several Polynesian groups.32 Diabetes rates were higher in those living in urban areas compared with traditional settings, supporting the premise that changing lifestyles play a major role in diabetes prevalence.
In our dataset, diabetes rates were somewhat higher in men than in women. Higher rates in men often are found in studies of diabetes in Asian and Polynesian populations.5–7 This finding differs from most systematic studies of whites, blacks, Hispanics, and American Indians, in which women have a higher prevalence than men.33,34 However, the greatest increases in prevalence from 1980–2005 occurred among white and black men (116% and 81%, respectively) compared to white and black women (110% and 69%, respectively). The reasons for this gender difference are not clear and warrant further investigation.
We found high rates of IFG in Native Hawaiians. IFG increased with age in both genders, although rates were higher in men. It is difficult to compare these data to previous studies because the more current American Diabetes Association criterion of FG≥100mg/dL was used in the current analysis, a cut-off level that was not used in previous studies and may not be appropriate in this population. Nevertheless, the only other data reported on glucose intolerance in Native Hawaiians are from the North Kohala/Kaua‘i population, which showed that 10.9% of men and 18.7% of women had IGT as determined by glucose tolerance test. This rate did not increase with age and was higher in women than in men. Despite the differing diagnostic criteria, the high rates of deteriorating glucose tolerance observed in both studies are of concern, because individuals with either IFG or IGT have a high probability of developing diabetes.35,36 The ability to identify these individuals and target them for intervention strategies aimed at controlling weight and increasing physical activity could slow and possibly reverse the increasing trend of diabetes seen in Native Hawaiians.
This article focuses on the prevalence of CVD risk factors in Native Hawaiians with diabetes, because individuals with diabetes are known to have higher rates of CVD. CVD is the leading cause of death in Native Hawaiians,11 and state BRFSS data report high prevalence rates for CVD risk factors in this group.37 Comparisons to population-based data in whites and blacks38 and American Indians39,40 show population-specific differences. For almost all of the risk factors, diabetes in Native Hawaiians seems to be associated with greater worsening than in other populations. For example, SBP in Native Hawaiian men and women with diabetes is 12–16 mmHg higher than in those without diabetes. Differences in white, black, and American Indian men with diabetes compared to men without diabetes average 3 mmHg, 11 mmHg, and 7 mmHg, respectively,35 although in these populations overall rates of hypertension in those without diabetes are higher than among Native Hawaiians. The biggest effect of diabetes in Native Hawaiians appears to be on dyslipidemia. Diabetes is associated with much larger differences in LDL-C in Native Hawaiians than in other groups; in whites and blacks LDL-C increases only slightly and in American Indians LDL-C decreases slightly in those with diabetes. This influence of diabetes on LDL-C in Native Hawaiians may reflect metabolic differences because receptor clearance capacity is the main determinant of LDL-C levels.41 This observation of increasing LDL-C with diabetes points to the need for attention to and control of LDL-C in Native Hawaiians with diabetes, because of the strong impact of LDL-C on atherosclerotic disease.
As in other populations, diabetes is also associated with higher TGs and lower HDL-C in Native Hawaiians. In this population, the decrease in HDL-C does not differ from other populations, but the effect on TGs appears to be greater, with Native Hawaiians with diabetes having TG concentrations almost 100 mg/dL higher than those without diabetes. Because TG-bearing lipoproteins in people with diabetes appear to be particularly atherogenic, attention to control of TG levels is needed. Smoking rates did not differ significantly in those with and without diabetes, and almost 30% of the men in this population smoked. Smoking is a strong determinant of vascular disease, especially in individuals with diabetes; thus smoking cessation campaigns also are warranted.
The present report has a number of strengths. The data were from a community-initiated program and CVD risk factor screening was conducted by a community-based organization, thus promoting wide participation. Data were collected systematically on a wide range of physiologic and behavioral risk factors. This was the largest cohort of adult Native Hawaiians studied to date, and the only database of CVD risk factors in Native Hawaiians with or without diabetes.
This report is limited by several factors. This was not a systematic population-based sample and, therefore, the data may be skewed. However, the recruitment by community outreach staff increased the likelihood that a wide range of individuals participated. Although the laboratory measures were not made by a CVD core lab, all measures were made by the same laboratory, using similar methods across the exam period and longitudinal standardization procedures. Although the sampling occurred over 6 years, standardized questionnaires and methods were used for the interview and physical exam and all personnel were centrally trained.
In summary, this is one of the largest cohorts of Native Hawaiians assessed to understand CVD risk factors in this group. We found high rates of diabetes and IFG that increased with age and were higher in men than in women. In addition, we found that diabetes in this population appears to be associated with adverse changes in cardiovascular risk factors, with diabetic individuals having increased prevalence of hypertension and elevated LDL-C and TGs. The community in Moloka‘i is implementing programs for diabetes prevention focused on weight control and physical activity, and health care providers on the island are targeting risk factor management in all patients with diabetes. These strategies should be implemented throughout Hawai’i and in all areas where Native Hawaiians are served.
Acknowledgments
This work was supported by grant number P20 MD00174 from the National Center for Minority Health and Health Disparities, National Institutes of Health (NIH). The contents of this article are solely the responsibility of the authors and do not necessarily represent the official views of NIH. The authors gratefully acknowledge the Moloka‘i community; Hua Kanawao Ka Liko’s Community Council; Na Pu‘uwai Native Hawaiian Health Care System; Queen Lili‘uokalani Children’s Center – Moloka‘i Unit; and Papa Ola Lōkahi for their commitment to CVD research that adhered to community-based participatory research principles. We thank Rachel Schaperow, MedStar Research Institute, for editing the manuscript.
Contributor Information
N. Emmett Aluli, Moloka‘i General Hospital, Kaunakakai, HI, 96748.
Kristina L. Jones, MedStar Research Institute, Hyattsville, MD, 20783.
Phillip W. Reyes, Kamehameha Schools, Honolulu, HI, 96813.
S. Kalani Brady, John A. Burns School of Medicine, Honolulu, HI, 96813.
JoAnn U. Tsark, Papa Ola Lōkahi, Honolulu, HI, 96813.
Barbara V. Howard, MedStar Research Institute, Hyattsville, MD, 20783.
References
- 1.Sloan NR. Ethnic distribution of diabetes mellitus in Hawaii. JAMA. 1963;183:419–24. doi: 10.1001/jama.1963.03700060061008. [DOI] [PubMed] [Google Scholar]
- 2.Johnson DB. Diabetes: Epidemiology and disability. In: Wegner EL, editor. The Health of Native Hawaiians. Vol. 32. Honolulu, HI: U of HI press; 1989. pp. 104–12. (Social Process in Hawaii). [Google Scholar]
- 3.Curb JD, Aluli NE, Kautz JA, Petrovitch H, Knutsen SF, Knutsen R, O’Conner HK, O’Conner WE. Cardiovascular risk factor levels in ethnic Hawaiians. Am J Public Health. 1991;81:164–67. doi: 10.2105/ajph.81.2.164. [DOI] [PMC free article] [PubMed] [Google Scholar]
- 4.Weinstein S, Sedlak-Weinstein E, Taylor R, Zimmet P. The high prevalence of impaired glucose tolerance and diabetes mellitus in an isolated Polynesian population, Manihiki, Cook Islands. N Z Med J. 1981;94:411–3. [PubMed] [Google Scholar]
- 5.Zimmet P, Canteloube D, Genelle B, LeGonidec G, Couzigou P, Peghini M, Charpin M, Bennett P, Kuberski T, Kleiber N, Taylor R. The prevalence of diabetes mellitus and impaired glucose tolerance in Melanesians and part-Polynesians in rural New Caledonia and Ouvea (Loyalty Islands) Diabetologia. 1982;23:393–8. doi: 10.1007/BF00260949. [DOI] [PubMed] [Google Scholar]
- 6.Taylor RJ, Bennett PH, LeGonidec G, Lacoste J, Combe D, Joffres M, Uili R, Charpin M, Zimmet PZ. The prevalence of diabetes mellitus in a traditional-living Polynesian population: the Wallis Island survey. Diabetes Care. 1983;6:334–40. doi: 10.2337/diacare.6.4.334. [DOI] [PubMed] [Google Scholar]
- 7.Simmons D, Thompson CF, Volklander D. Polynesians: prone to obesity and Type 2 diabetes mellitus but not hyperinsulinaemia. Diabetic Medicine. 2001;18:193–198. doi: 10.1046/j.1464-5491.2001.00435.x. [DOI] [PubMed] [Google Scholar]
- 8.The Native Hawaiian Health Research Project, RCMI Program. Diabetes Mellitus and heart disease risk factors in Hawaiians. Hawaii Med J. 1994;53:340–43. [PubMed] [Google Scholar]
- 9.Centers for Disease Control and Prevention. Available online at: http://www.state.hi.us/doh/stats/sur-veys/hhs/hhs00.htm. Retrieved [10/24/2007]
- 10.Centers for Disease Control and Prevention. National diabetes fact sheet: general information and national estimates on diabetes in the United States, 2005. Atlanta, GA: U.S. Department of Health and Human Services, Centers for Disease Control and Prevention; 2005. [Google Scholar]
- 11.Centers for Disease Control and Prevention. Available online at: http://www.cdc.gov/diabetes/statis-tics/prev/state/source.htm. Retrieved [10/24/2007]
- 12.Asian American and Pacific Islander Workshops. Summary Report on Cardiovascular Health. U.S. Department of Health and Human Services. Public Health Service. National Institutes of Health, National Heart, Lung, and Blood Institute. NIH Publication Publication No. 00-3793. 2000 Mar; [Google Scholar]
- 13.Addressing Cardiovascular Health in Asian Americans and Pacific Islanders. U.S. Department of Health and Human Services. Public Health Service. National Institutes of Health, National Heart, Lung and Blood Institute. NIH Publication No. 00-3647. 2000 Jan; [Google Scholar]
- 14.Anderson I, Crengle S, Kamaka M, Chen T, Palafox N, et al. Indigenous health in Australia, New Zealand, and the Pacific. Lancet. 2006;367:1775–85. doi: 10.1016/S0140-6736(06)68773-4. [DOI] [PubMed] [Google Scholar]
- 15.http://hawaii.gov/health/family-child-health/chronic-disease/cvd/CVD2007.pdf (Accessed May 12, 2009).
- 16.Welty TK, Lee ET, Yeh J, Cowan LD, Go O, Fabsitz RR, Le NA, Oopik AJ, Robbins DC, Howard BV. Cardiovascular disease risk factors among American Indians. The Strong Heart Study. Am J Epidemiol. 1995;142:269–87. doi: 10.1093/oxfordjournals.aje.a117633. [DOI] [PubMed] [Google Scholar]
- 17.U.S. Bureau of the Census. The Asian and Pacific Islander Population in the United States. Washington, DC: U.S. Government Printing Office; 1992. Current Population Reports, Population Characteristics. P20–P459. [Google Scholar]
- 18.http://uhfamily.hawaii.edu/Cof_Data/profiles/indicatorResults.asp?page=latest&geo=11500910865,11500900000,11500000000. (Accessed May 12, 2009).
- 19.U.S. Census Bureau. Census 2000. 2000 (May 8, 2009) [Online:] http://www.census.gov/census2000/states/hi.html, (Accessed May 12, 2009).
- 20.Source: Population Estimates Program, Population Division. U.S. Census Bureau; Washington, D.C. 20233: Resident Population Estimates of the U.S. by Age and Sex: Apr 1, 1990 to Jul 1, 1999. [Google Scholar]
- 21.Grandinetti A, Chang HK, Mau MK, Curb JD, Kinney EK, Sagum R, Arakaki RF. Prevalence of glucose intolerance among Native Hawaiians in two rural communities. Diabetes Care. 1998;21:549–54. doi: 10.2337/diacare.21.4.549. [DOI] [PubMed] [Google Scholar]
- 22.Mau MK, Grandinetti A, Arakai RF, Chang HK, Kinney EK, Curb DJ. The insulin resistant syndrome in Native Hawaiians. Diabetes Care. 1997;20:1376–80. doi: 10.2337/diacare.20.9.1376. [DOI] [PubMed] [Google Scholar]
- 23.Varney JM, Sato MM. Diabetes in Hawaii: Arthritis/rheumatism and gout in Hawaii: Some statistical analyses. Hawaii Med J. 1979;38:197–201. [PubMed] [Google Scholar]
- 24.Gregg EW, Cadwell BL, Cheng YJ, Cowie CC, Williams DE, Geiss L, Engelgau MM, Vinicor F. Trends in the prevalence and ratio of diagnosed to undiagnosed diabetes according to obesity levels in the U.S. Diabetes Care. 2004;27:2806–2812. doi: 10.2337/diacare.27.12.2806. [DOI] [PubMed] [Google Scholar]
- 25.King H, Aubert RE, Herman W. H. Global burden of diabetes, 1995–2025, prevalence, numerical estimates and projection. Diabetes Care. 1998;21:1414–31. doi: 10.2337/diacare.21.9.1414. [DOI] [PubMed] [Google Scholar]
- 26.King H, Rewers M. WHO ad hoc diabetes reporting group, global estimates for prevalence of diabetes and IGT in adults. Diabetes Care. 1993;16:157–77. doi: 10.2337/diacare.16.1.157. [DOI] [PubMed] [Google Scholar]
- 27.Siedell JC. Obesity, insulin resistance and diabetes – a worldwide epidemic. British Journal of Nutrition. 2000;83(Suppl. 1):S5–S8. doi: 10.1017/s000711450000088x. [DOI] [PubMed] [Google Scholar]
- 28.O’Dea K. Westernization and non-insulin-dependent diabetes in Australian Aborigines. Ethn Dis. 1991 Spring;1:171–87. [PubMed] [Google Scholar]
- 29.Gardner L, Stern MP, Haffner SM, Gaskill SP, Hazuda HP, Relethford JH, Eifler CW. Prevalence of diabetes in Mexican Americans. Relationship to percent of gene pool derived from Native American sources. Diabetes. 1984;33:86–92. doi: 10.2337/diab.33.1.86. [DOI] [PubMed] [Google Scholar]
- 30.Daniel M, O’Dea K, Rowley KG, McDermott R, Kelly S. Glycated hemoglobin as an indicator of social environmental stress among indigenous versus westernized populations. Prev Med. 1999;29:405–13. doi: 10.1006/pmed.1999.0559. [DOI] [PubMed] [Google Scholar]
- 31.Pan XR, Li GW, Hu YH, Wang JX, Yang WY, An ZX, Hu ZX, Lin J, Xiao JZ, Cao HB, Liu PA, Jiang XG, Jiang YY, Wang JP, Zheng H, Zhang H, Bennett PH, Howard BV. Effects of diet and exercise in preventing NIDDM in people with impaired glucose tolerance. The Da Qing IGT and Diabetes Study. Diabetes Care. 1997;20:537–44. doi: 10.2337/diacare.20.4.537. [DOI] [PubMed] [Google Scholar]
- 32.Simmons D, Clover G, Hope C. Ethnic differences in diabetic retinopathy. Diabetic Medicine. 2007;24:1093–1098. doi: 10.1111/j.1464-5491.2007.02227.x. [DOI] [PubMed] [Google Scholar]
- 33.U.S. Centers for Disease Control and Prevention. Age-Adjusted Prevalence of Diagnosed Diabetes by Race/Ethnicity and Sex, United States, 1980–2005. Page Located on the Web at http://www.cdc.gov/diabetes/statistics/prev/national/figraceethsex.htm.
- 34.Acton KJ, Burrows NR, Geiss LS, Thompson T. Diabetes Prevalence Among American Indians and Alaska Natives and the Overall Population United States, 1994—2002. U.S. Centers for Disease Control and Prevention Morbidity and Mortality Weekly Report. 2003;52:702–704. [PubMed] [Google Scholar]
- 35.Centers for Disease Control and Prevention. National Center for Health Statistics (NCHS) National Health and Nutrition Examination Survey Data. Hyattsville, MD: U.S. Department of Health and Human Services, [1999–2000]; [ http://www.cdc.gov/nchs/about/major/nhanes/nhanes99_00.htm] [Google Scholar]
- 36.Edelstein SL, Knowler WC, Bain RP, Andres R, Barrett-Connor EL, Dowse GK, Haffner SM, Pettitt DJ, Sorkin JD, Muller DC, Collins VR, Hamman RF. Predictors of progression from impaired glucose tolerance to NIDDM: an analysis of six prospective studies. Diabetes. 1997;46:701–710. doi: 10.2337/diab.46.4.701. [DOI] [PMC free article] [PubMed] [Google Scholar]
- 37.Aluli NE, Reyes PW, Tsark JU. Cardiovascular disease disparities in Native Hawaiians. Journal of the CardioMetabolic Syndrome. 2007;2:250–253. doi: 10.1111/j.1559-4564.2007.07560.x. [DOI] [PubMed] [Google Scholar]
- 38.Cowie CC, Harris MI, Silverman RE, Johnson EW, Rust KF. Effect of multiple risk factors on differences between blacks and whites in the prevalence of non-insulin-dependent diabetes mellitus in the United States. Am J Epidemiol. 1993;137:719–32. doi: 10.1093/oxfordjournals.aje.a116732. [DOI] [PubMed] [Google Scholar]
- 39.Howard BV, Lee ET, Cowan LD, Devereux RB, Galloway JM, Go OT, Howard WJ, Rhoades ER, Robbins DC, Sievers ML, Welty TK. Rising tide of cardiovascular disease in American Indians: the Strong Heart Study. Circulation. 1999;99:2389–2395. doi: 10.1161/01.cir.99.18.2389. [DOI] [PubMed] [Google Scholar]
- 40.Lee ET, Howard BV, Savage PJ, Cowan LD, Fabsitz RR, Oopik AJ, Yeh J, Go O, Robbins DC, Welty TK. Diabetes and impaired glucose tolerance in three American Indian populations aged 45–74 years. The Strong Heart Study. Diabetes Care. 1995;18:599–610. doi: 10.2337/diacare.18.5.599. [DOI] [PubMed] [Google Scholar]
- 41.Howard BV. Pathogenesis of diabetic dyslipidemia. Diabetes Reviews. 1995;3:423–432. [Google Scholar]