

Abstract
In addition to mediating sister chromatid cohesion during the cell cycle, the cohesin complex associates with CTCF and with active gene regulatory elements to form long-range interactions between its binding sites. Genome-wide chromosome conformation capture had shown that cohesin's main role in interphase genome organization is in mediating interactions within architectural chromosome compartments, rather than specifying compartments per se. However, it remains unclear how cohesin-mediated interactions contribute to the regulation of gene expression. We have found that the binding of CTCF and cohesin is highly enriched at enhancers and in particular at enhancer arrays or “super-enhancers” in mouse thymocytes. Using local and global chromosome conformation capture, we demonstrate that enhancer elements associate not just in linear sequence, but also in 3D, and that spatial enhancer clustering is facilitated by cohesin. The conditional deletion of cohesin from noncycling thymocytes preserved enhancer position, H3K27ac, H4K4me1, and enhancer transcription, but weakened interactions between enhancers. Interestingly, ∼50% of deregulated genes reside in the vicinity of enhancer elements, suggesting that cohesin regulates gene expression through spatial clustering of enhancer elements. We propose a model for cohesin-dependent gene regulation in which spatial clustering of enhancer elements acts as a unified mechanism for both enhancer-promoter “connections” and “insulation.”
Transcriptional regulation requires functional and topological interactions of gene regulatory elements, in particular, enhancers and promoters. Making appropriate connections is a challenging problem, as mammalian genomes contain tens of thousands of promoters and considerably larger numbers of enhancers (Thurman et al. 2012). One solution to the problem of matching appropriate regulatory elements is to compartmentalize the genome, thereby reducing the number of enhancers and promoters that are likely to engage with each other. The first—and most obvious—level of compartmentalization is the segmentation of the genome into individual chromosomes. Beyond this, genome-scale chromosome conformation capture approaches have shown that individual interphase chromosomes are organized into architectural compartments with an average size of 1–3 Mb (Lieberman-Aiden et al. 2009), which in turn contain topologically associated domains (TADs) sized ∼1 Mb (Dixon et al. 2012; Nora et al. 2012; Sanyal et al. 2012). Compartments and TADs are defined by interaction frequencies and are thought to reduce the probability of interactions between gene regulatory elements located in different compartments, while facilitating interactions between enhancers and promoters within the same compartment or domain (Gibcus and Dekker 2013).
The cohesin protein complex constrains chromosome topology in cycling cells (Nasmyth and Haering 2009) and contributes to long-range interactions in interphase (Hadjur et al. 2009; Mishiro et al. 2009; Nativio et al. 2009; Hou et al. 2010; Kagey et al. 2010; Seitan et al. 2011, 2013; Merkenschlager and Odom 2013). Recent Hi-C studies have shown that cohesin is important primarily for defining interactions within chromosomal compartments but not (Seitan et al. 2013), or to a limited extent (Sofueva et al. 2013; Zuin et al. 2014), for maintaining chromosome compartmentalization per se. Despite continued compartmentalization, cohesin-depleted thymocytes show a systematic skewing of gene expression that deregulates ∼1000 genes (Seitan et al. 2013). These data indicate that compartmentalization alone is insufficient for proper gene regulation and that cohesin-mediated interactions within chromosomal compartments contribute to the regulation of gene expression. Exactly what these interactions are and how they affect gene expression remains incompletely understood. Current models focus on cohesin-mediated enhancer-promoter interactions (Kagey et al. 2010; Seitan et al. 2011), transcription factor binding (Faure et al. 2012; Yan et al. 2013), and cohesin-dependent maintenance of cell-type-specific enhancers (Hnisz et al. 2013). Here we explore the role of cohesin in enhancer-enhancer interactions and the regulation of enhancer-proximal genes.
Results
The regulation of genes near enhancers requires cohesin
To explore the impact of cohesin on long-range interactions and gene expression, we used an experimental system in which floxed alleles of the gene encoding for the cohesin subunit RAD21 are deleted by the developmentally regulated activation of CD4Cre transgenes in developing thymocytes (Seitan et al. 2011, 2013). This approach preserves cohesin expression in cycling thymocytes (Seitan et al. 2011), while total and chromatin-associated RAD21 in noncycling Rad21lox/lox CD4Cre CD4+ CD8+ small double positive thymocytes (hereafter referred to as “thymocytes”) were depleted by 80%–90% both globally (as judged by Western blotting of chromatin fractions) and locally (as judged by ChIP-PCR) (Seitan et al. 2013). To ask how Rad21 deletion affected the chromatin association of other cohesin subunits, we examined total and chromatin-associated SMC1A in Rad21-deleted thymocytes. Western blotting of chromatin fractions showed that SMC1A and SMC3 were increased in the soluble (chromatin-unbound) and decreased in the chromatin-bound fraction of Rad21-deleted thymocytes (Supplemental Fig. S1).
RNA-seq analysis defined 1153 genes that were differentially expressed between control and cohesin-deficient thymocytes (FDR = 0.05) (Seitan et al. 2013). To understand how cohesin impacts on the regulation of gene expression, we applied a multinomial logistic regression model that integrates gene expression in control and Rad21-deficient small CD4+ CD8+ double positive thymocytes (“thymocytes”), genomic features such as gene length and CpG content with Hi-C and ChIP-seq data (Seitan et al. 2013). Among a range of variables tested, the genomic distance between genes and enhancers emerged as highly predictive (Fig. 1A).
Figure 1.
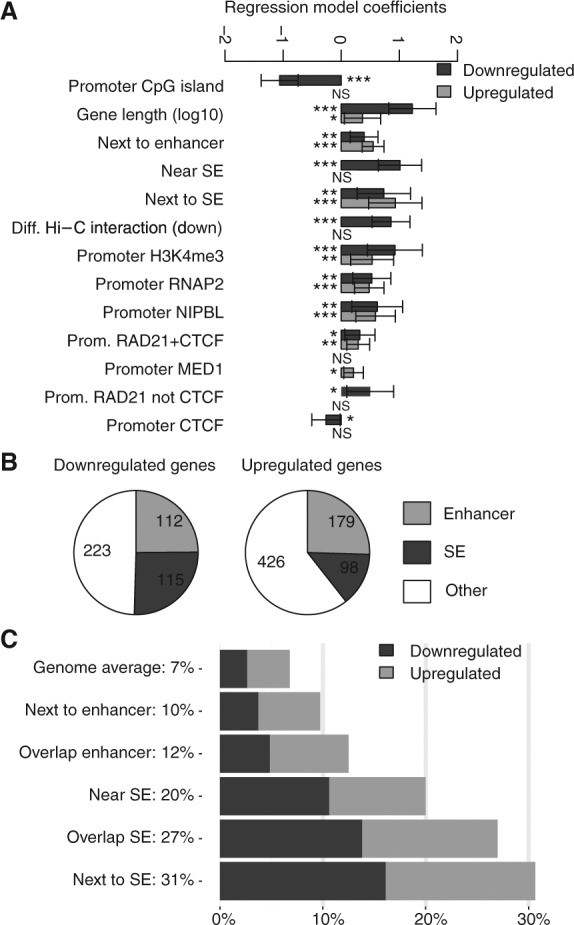
Cohesin facilitates the regulated expression of genes located near enhancer elements. (A) Enhancers and super-enhancers (Supplemental Fig. S1) emerge as major determinants of cohesin-dependent gene regulation. The “Next to enhancer” category includes genes that are nearest neighbors of conventional enhancers. The “Near SE” category includes genes that are positioned within 40 kb of an SE, including genes that overlap SEs and nearest neighbors of SEs. “Next to SE” includes only nearest neighbors of SEs. “Diff. Hi-C interaction” indicates genes in 100-kb regions that interact differentially in control and Rad21-deficient thymocytes (Seitan et al. 2013). Other categories refer to promoter binding of the listed factors (TSS ± 2.5 kb). Multivariate multinomial regression analysis was done as described in Seitan et al. (2013). The statistical significance of regression model coefficients is indicated and only significant associations are shown. (B) Proximity to enhancers accounts for ∼50% of genes deregulated in Rad21-deficient thymocytes. (Enhancer) Genes that are nearest neighbors or overlap conventional enhancers; (SE) genes ±40 kb of a super-enhancer, overlapping a super-enhancer, or that are nearest neighbors of super-enhancers. (C) Cohesin is required for the regulation of genes near enhancers and super-enhancers. (Genome average) Expressed genes (17,003 genes); (Next to enhancer) nearest neighbors of conventional enhancers (3540 genes); (Overlapping enhancer) genes that overlap conventional enhancers (198 genes); (Near SE) ±40 kb of a super-enhancer (1036 genes); (Overlapping SE) overlap a super-enhancer (493 genes); (Next to SE) nearest neighbors of super-enhancers (447 genes). Additional data are shown in Supplemental Table 1.
We used the presence of H3K27ac outside promoter regions to identify potential enhancers in thymocytes (∼4700, median width ∼2 kb). Extended arrays of enhancer elements that spread, on average, over 20 kb of linear genomic sequence were identified as complex enhancers or super-enhancers (Parker et al. 2013; Whyte et al. 2013) using a published algorithm (ROSE) (Supplemental Fig. S1; Hnisz et al. 2013). Of 1153 genes that were deregulated in cohesin-depleted thymocytes, 504 (43.7%) were positioned near conventional enhancers or super-enhancers (odds ratio = 2.70, P < 2.2 × 10⁻¹⁶, Fisher's exact test; 39.4% of 703 up-regulated genes and 50.4% of 450 down-regulated genes were associated with enhancers) (Fig. 1B). This represents a considerably greater fraction of deregulated genes than was associated with other variables we tested (Seitan et al. 2013), such as location in differentially interacting regions (13.5% of deregulated genes, odds ratio = 1.80, P = 1.15 × 10⁻⁹), gene expression levels (170 or 14.7% of deregulated genes fell into the top two or bottom two log expression intervals), or the presence of ultraconserved noncoding elements (62 or 5.4% of deregulated genes) (Seitan et al. 2013).
Compared to the frequency of deregulated gene expression genome-wide (6.78%), genes positioned next to—or overlapping—conventional enhancers were deregulated significantly more frequently: 10%, P = 2.54 × 10⁻¹⁵ and 12%, P = 0.011, respectively (Fig. 1C). One in five genes positioned within 40 kb of super-enhancers were deregulated (207 of 1035; P < 2.2 × 10⁻¹⁶) (Fig. 1C). Proximity to conventional enhancers accounted for the greatest number (349) and percentage (30.3%) of deregulated genes (Fig. 1B), but proximity to super-enhancers showed the strongest enrichment (Fig. 1C). The highest frequency of deregulation was found for genes positioned within super-enhancers (138 of 493 overlapping genes were deregulated, 27.99%; P < 2.2 × 10⁻¹⁶), and genes that are nearest neighbors of super-enhancers (30.65% or 137 of 447 genes positioned next to super-enhancers were deregulated; P < 2.2 × 10⁻¹⁶) (Fig. 1C). These data indicate that cohesin is required for the regulated expression of genes near conventional enhancers and super-enhancers in thymocytes and that ∼50% of deregulated gene expression events are accounted for by the positioning of genes relative to enhancers.
Enhancers are maintained in cohesin-deficient thymocytes
Super-enhancers are characterized by extraordinary enrichment for mediator subunits, H3K27ac, and master transcription factors (Whyte et al. 2013). Perturbation studies in ES cells suggested that super-enhancers are highly sensitive to the loss not only of cell-type-specific transcription factors such as POU5F1 and components of the general transcription machinery, specifically mediator subunits, but also of cohesin (Hnisz et al. 2013). We therefore examined H3K27ac as a mark of putative enhancer elements in control and cohesin-deficient thymocytes. The Cd8 (Fig. 2A) and Ppp1r16b (Fig. 2B) regions illustrate that H3K27ac was very similar in control and in cohesin-deficient thymocytes. Genome-wide, the identity of H3K27ac-marked enhancer elements (Shen et al. 2012) was well preserved in cohesin-depleted thymocytes (Spearman correlation = 0.8672) (Fig. 2C, left). We evaluated H3K27ac for developmental stage-specific enhancer elements, identified based on H3K4me2 ChIP-seq data at successive stages of thymocyte differentiation (Zhang et al. 2012). We compared putative enhancer elements that were already present prior to the CD4+ CD8+ double positive stage—and maintained in CD4+ CD8+ double positive thymocytes (gray, Fig. 2C, center)—with putative enhancer elements that were newly established in CD4+ CD8+ double positive thymocytes at or around the time of cohesin depletion (red, Fig. 2C, center). H3K27ac at both constitutive and newly established developmentally regulated enhancers were highly correlated between control and cohesin-deficient thymocytes (Spearman correlation = 0.8112). Analysis of super-enhancers showed little impact of cohesin depletion on H3K27ac (Spearman correlation = 0.9202). Only five of 465 thymocyte super-enhancers showed a twofold or greater difference in H3K27ac, and the median ratio between total H3K27ac signals across super-enhancers in cohesin-deficient thymocytes over wild type was 1.08 (Fig. 2C, right). ChIP-PCR experiments indicated that, in addition to H3K27ac, the H3K4me1 enhancer mark was preserved in Rad21-deficient thymocytes (Supplemental Fig. S3A). We also examined the abundance of enhancer-associated transcripts as an indicator for the activity of the transcriptional machinery at enhancers in control and Rad21-deficient thymocytes and found that the transcription of enhancers and super-enhancers was retained in Rad21-deficient thymocytes (Supplemental Fig. S3B). Hence, enhancer position, H3K27ac, H4K4me1, and enhancer transcription are maintained in cohesin-deficient thymocytes.
Figure 2.

Enhancer elements are maintained in cohesin-deficient thymocytes. The Cd8 (A) and the Ppp1r16b region (B) illustrate the maintenance of H3K27ac in cohesin-deficient thymocytes. Binding of the cohesin subunits RAD21 and SMC1A as well as CTCF is shown for reference (see below). (C) Rad21 deletion does not abolish H3K27ac marking of conventional enhancers (left), newly established developmentally regulated enhancers (red, middle), or super-enhancers (right). (D) Enhancers and super-enhancers were stratified according to the ratio of H3K27ac in Rad21-deficient thymocytes over wild type. The frequency of deregulated genes is shown for the top, middle, and lower third of enhancers (left) and super-enhancers (right).
To address whether changes in the expression of enhancer-associated genes are a consequence of minor changes in H3K27ac levels, we stratified enhancers and super-enhancers according to the ratio of H3K27ac in cohesin-deficient thymocytes over wild type (top, middle, and lower third) and compared the frequency of deregulated genes associated with each group. Genes associated with enhancers and super-enhancers with minimal changes in H3K27ac (middle third) were deregulated at similar frequencies as genes associated with enhancers or super-enhancers in the top or bottom third (Fig. 2D).
CTCF and cohesin demarcate and punctuate enhancer landscapes
As genes near enhancers were preferentially deregulated in cohesin-deficient thymocytes, we examined the association of cohesin and CTCF with enhancers. Enrichment of cohesin (Hnisz et al. 2013; Whyte et al. 2013)—but not CTCF (Hnisz et al. 2013)—was previously reported at super-enhancers in ES cells. We found that CTCF binding was enriched at conventional enhancers (2.48-fold over adjacent regions) (Fig. 3A) and at thymocyte super-enhancers (1.63-fold over adjacent regions) (Fig. 3B). The strongest enrichment of CTCF binding was at the boundaries of super-enhancers. The majority (64.5%) of thymocyte super-enhancers had CTCF peaks on at least one of their boundaries (299 of 465; 76 at both ends, 223 at one end) (Fig. 3C). In addition, CTCF binding sites punctuated the interior of super-enhancers in thymocytes. As expected, based on the association of cohesin with CTCF (Parelho et al. 2008; Wendt et al. 2008) and with active regulatory elements (Kagey et al. 2010; Schmidt et al. 2010; Faure et al. 2012; Whyte et al. 2013; Yan et al. 2013), the cohesin subunits RAD21 and SMC1A were also highly enriched at super-enhancers (Fig. 3B). RAD21 and in particular SMC1A associated not only with discrete CTCF binding sites, but in addition spread across super-enhancers (Fig. 3B).
Figure 3.
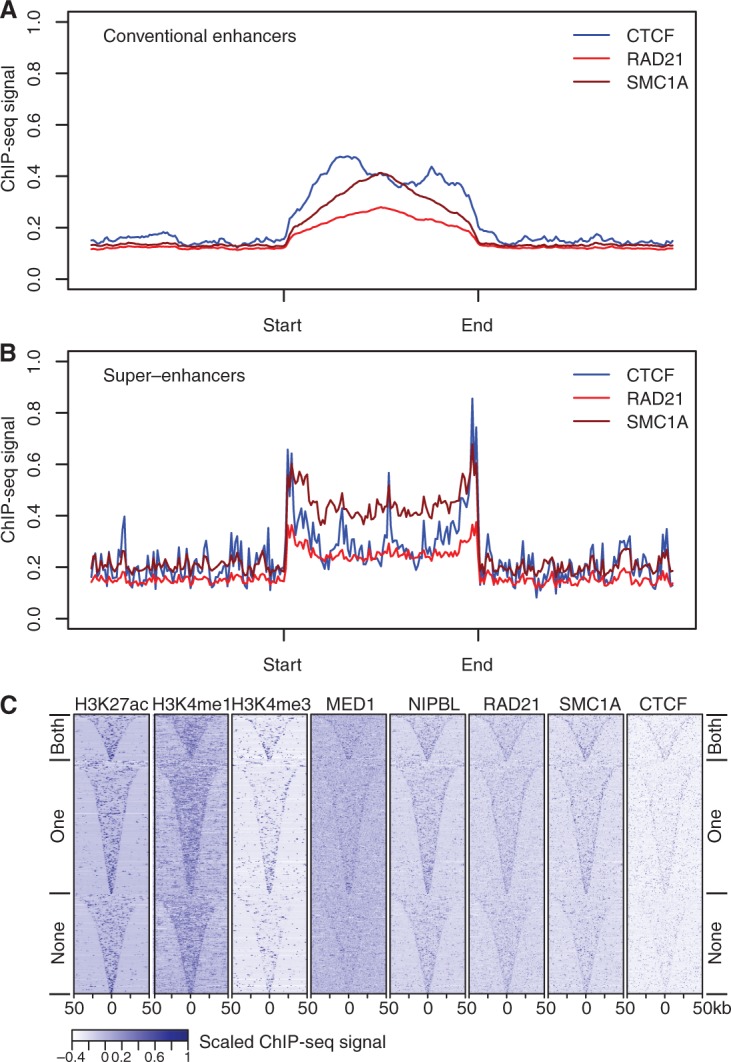
Enhancer elements are enriched for CTCF and cohesin binding. (A) CTCF, RAD21, and SMC1A ChIP-seq signal enrichment in thymocytes at conventional enhancers. Enhancers were defined based on H2K27ac ChIP-seq data (Methods) and enhancer length was normalized in order to align the start and end of the enhancer. (B) CTCF, RAD21, and SMC1A ChIP-seq signal enrichment in thymocytes at super-enhancers. Super-enhancers were defined based on H2K27ac ChIP-seq data (Methods), enhancer length was normalized in order to align the start and end of the super-enhancers, and flanking regions of equal size to the super-enhancer are shown for reference. “Start” and “end” are based on the genomic coordinates. (C) Classification of super-enhancers on the basis of CTCF binding at both boundaries, one boundary, or neither boundary. Heatmaps of ChIP-seq signal enrichment in 100-kb windows around super-enhancer centers, grouped according to CTCF binding at the super-enhancer boundaries. Histone modifications, the cohesin loading factor NIPBL, and the cohesin subunits RAD21 and SMC1A are shown for reference.
Cohesin mediates the spatial clustering of enhancer elements
Given that enhancers and super-enhancers associate with CTCF and cohesin, and that cohesin is known to form interactions between its binding sites (Hadjur et al. 2009; Mishiro et al. 2009; Nativio et al. 2009; Hou et al. 2010; Kagey et al. 2010; Seitan et al. 2011, 2013), we asked whether cohesin has a role in the spatial arrangement of enhancer elements. For this analysis, we focused on the Cd3 super-enhancers, which illustrate the typical features described above: The H3K27ac-marked regions are flanked by CTCF binding sites and enriched for cohesin binding relative to the surrounding regions, and H3K27ac was maintained in Rad21-deficient thymocytes (Fig. 4A). Targeted 3C analysis revealed that interactions between the Cd3 super-enhancers were significantly weakened in cohesin-deficient thymocytes (interactions B, C, D in Fig. 4A; interaction A is a proximity ligation control used to demonstrate comparable efficiency of 3C experiments). Likewise, interactions between the Cd3 super-enhancers and enhancer elements positioned outside the Cd3 super-enhancers were significantly weakened in cohesin-deficient thymocytes (interactions F, G, H, I, J in Fig. 4B; interaction E demonstrates the level of background interactions between the Cd3 super-enhancer and a downstream genomic fragment without H3K27ac or CTCF binding). Taken together, these data show that the Cd3 super-enhancers congregate with each other in three-dimensional nuclear space and closely interact with enhancer elements outside the Cd3 super-enhancer region. Importantly, this spatial proximity of enhancer elements is mediated at least in part by cohesin, as cohesin depletion results in the partial dispersal of enhancer elements.
Figure 4.

Cohesin mediates the spatial clustering of enhancer elements. (A) The mouse Cd3 super-enhancer is flanked and punctuated by CTCF and cohesin binding (refer to Fig. 2A,B for additional examples of the relationship between super-enhancers, CTCF, and cohesin). Restriction fragments used for 3C analysis are indicated by gray bars. “A” is a proximity ligation control that demonstrates comparable efficiency of 3C experiments. Enhancer-enhancer interactions B, C, and D across the Cd3 super-enhancer were significantly reduced in Rad21-deficient (red) compared to control (black) thymocytes. n = 3, mean ± SD, (*) P < 0.05. (B) Long-range interactions between the Cd3 super-enhancer and enhancer elements outside the Cd3 locus. “E” is a control used to demonstrate background interactions with a downstream genomic fragment lacking H3K27ac marks and CTCF binding. The position of the Cd3 super-enhancer is marked by dashed lines. Interactions F, G, H, I, and J link the Cd3 super-enhancer with downstream enhancer elements outside the Cd3 region and were significantly reduced in Rad21-deficient (red) compared to control (black) thymocytes. n = 3, mean ± SD, (*) P < 0.05. (C) Structured interaction matrix analysis (SIMA) of long-range interactions between chromatin features based on Hi-C data for control (gray) and Rad21-deficient (red) thymocytes. Interactions between constituent elements of super-enhancers (left) were analyzed by SIMA within super-enhancer regions sized 100 kb and larger. Interactions between other chromatin features were analyzed by SIMA within open chromatin compartments. Note that chromatin features show increased self-interactions, while interactions of random regions (Seitan et al. 2013) conformed to the level of interactions predicted by a background model based on genomic distance and sequencing depth (dashed red line). “Interaction strength” refers to the strength of interactions between 10-kb regions within super-enhancers (SEs) or 10-kb regions within chromosomal compartments (Enh, RAD21 sites, TSS, and random regions after normalization to the background model). P-values shown are from a Wilcoxon signed-rank test. (D) Reduced enhancer-enhancer interactions in Rad21-deficient thymocytes based on SIMA analysis of Hi-C data are compared for all open chromosomal compartments and separately for compartments with or without super-enhancers. P-values shown are from a Wilcoxon signed-rank test.
Structured interaction matrix analysis (SIMA) (Lin et al. 2012) of Hi-C data indicated that chromatin features including enhancers, RAD21 binding sites, and promoters interacted more strongly with each other than expected based on a background model, whereas interactions between randomly chosen chromatin regions located within active chromatin compartments showed no enrichment over the background model (Fig. 4C). With an enrichment of 3.5-fold over the background model, interactions within individual super-enhancers were particularly strong. This indicates that the constituent elements of super-enhancers are closer to each other in three-dimensional nuclear space than expected based on their distance in the linear genomic sequence. Hence, the constituent elements of super-enhancers are not only arrayed in linear sequence but also congregate to cluster spatially. Importantly, spatial clustering within super-enhancers was significantly weakened in cohesin-deficient thymocytes (P = 1.4 × 10⁻⁴) (Fig. 4C), and the extent of this reduction was comparable to that between RAD21 binding sites (P < 10−32, Fig. 4C). Interactions between conventional enhancers were also reduced by cohesin depletion (P < 10−21, Fig. 4C), while interactions between promoters (TSSs) appeared slightly increased, as reported previously (Seitan et al. 2013). SIMA analysis of Hi-C data further showed that enhancer-enhancer interactions were reduced in open chromatin compartments (P < 10−21) (Fig. 4D). This was the case for compartments that contain super-enhancers (P < 10−11) (Fig. 4D) as well as for compartments that contain only conventional enhancers (P < 10−12) (Fig. 4D).
These data indicate that conventional enhancers, and in particular the constituent elements of super-enhancers, engage in spatial interactions with each other and with nearby enhancer elements and that these interactions are significantly weakened—but not abolished—in cohesin-deficient thymocytes. The degree of weakening is highly significant statistically as well as biologically, as evidenced by the enrichment of deregulated genes in the proximity of enhancer elements described in Figure 1.
Cell-type specificity of CTCF association and spatial clustering of super-enhancers
Super-enhancers are highly cell type-specific (Whyte et al. 2013), but the majority of CTCF binding sites are constitutive (Wang et al. 2012). Previous studies found significant enrichment of motifs for cell-type-specific transcription factors, but not CTCF, at super-enhancers in ES cells and in B cells (Hnisz et al. 2013; Whyte et al. 2013). Comparison of CTCF ChIP-seq signal in thymocytes at super-enhancers that are active in thymocytes with super-enhancers that are specific for nonlymphoid cell types (macrophages, C2C12 myoblasts, and ES cells) and inactive in thymocytes showed that binding of CTCF (Fig. 5A, top) and the cohesin subunits RAD21 (Fig. 5A, middle) and SMC1A (Fig. 5A, bottom) was enriched at thymocyte-specific super-enhancers, but not at macrophage-, myoblast-, or ES cell-specific super-enhancers. Importantly, and consistent with cell-type-specific CTCF binding and cohesin recruitment, SIMA analysis of Hi-C interactions showed stronger interactions within thymocyte-specific super-enhancers than within super-enhancers that are active in other cell types (Fig. 5B). Cohesin depletion preferentially affected spatial interactions within thymocyte-specific super-enhancers (Fig. 5B).
Figure 5.

Cell-type specificity of CTCF association and spatial clustering of super-enhancers. (A) CTCF (top), RAD21 (middle), and SMC1A (bottom) ChIP-seq signal in thymocytes at super-enhancers that are active in thymocytes (black), macrophages (purple), myoblasts (blue), or ES cells (green). (B) Preferential interactions within cell-type-specific super-enhancers. SIMA analysis of thymocyte Hi-C data was used to compare interactions within super-enhancers active in thymocytes or other cell types. (Left) Hi-C interactions in control (gray) and Rad21-deficient thymocytes (red) within thymocyte super-enhancers sized 50 kb or more (n = 105). (Right) Hi-C interactions in WT (light gray) and Rad21-deficient thymocytes (orange) within super-enhancers of 50 kb or more that are active in pro-B cells, macrophages, or ES cells (n = 20) (Whyte et al. 2013). P-values shown are from a Wilcoxon signed-rank test. (C) Model for the impact of cohesin-dependent enhancer-enhancer interactions on gene expression. Spatial clustering between enhancer elements can affect promoter activity positively and negatively. The promoters P1 and P3 are both distal to a super-enhancer. P1 is isolated as a result of the spatial clustering between the enhancer elements within the SE, while P3 is connected to the super-enhancer by enhancer-enhancer contacts (left). Removal of cohesin (right) decreases the spatial constraint on enhancer elements so that P1 is contacted more readily by enhancer elements, while P3 dissociates from the super-enhancer.
Discussion
Our data show that a major function of cohesin is to regulate the expression of genes near enhancers. Chromosome conformation capture approaches indicate that enhancers and super-enhancers are clustered in three-dimensional nuclear space and, importantly, that this spatial clustering of enhancer elements is mediated at least in part by cohesin. In light of recent reports that chromosome conformation capture and FISH approaches do not always agree (Williamson et al. 2014), it will be important to confirm these results by independent methods. Cohesin binds to enhancers via its interaction with CTCF (Parelho et al. 2008; Wendt et al. 2008) and the cohesin loading factor NIPBL, which is enriched at gene regulatory elements (Kagey et al. 2010). Cohesin depletion results in the partial dispersal of super-enhancers and in the preferential deregulation of genes near enhancers and super-enhancers, suggesting the spatial clustering of enhancer elements as a candidate mechanism for the regulation of enhancer-proximal genes by cohesin.
In ES cells, depletion of mediator or POU5F1 results in the down-regulation of genes associated with super-enhancers (Whyte et al. 2013). Similarly, knockdown of cohesin in cycling ES cells compromised super-enhancer function (Hnisz et al. 2013). In thymocytes, cohesin does not appear to be required to maintain the marking of enhancers with H3K27ac, H3K4me1, or active transcription of enhancer elements. We find that genes associated with super-enhancers in thymocytes are equally likely to be up-regulated or down-regulated in Rad21-deleted thymocytes. Taken together, these data suggest that in noncycling thymocytes, cohesin acts primarily to define the spatial relationship between enhancers. The impact of cohesin depletion on super-enhancers’ function in rapidly cycling ES cells may be a cell-type-specific effect or could be secondary to the loss of essential cohesin functions in the cell cycle (Lin et al. 2005; Maimets et al. 2008).
ChIP-seq data indicate CTCF binding and cohesin recruitment to thymocyte super-enhancers, and Hi-C data show increased spatial interactions specifically of thymocyte-specific, but not ES cell-specific super-enhancers in thymocytes. Binding of CTCF to the edges of super-enhancers in thymocytes provides an interesting contrast to ES cells, where super-enhancers are not directly flanked by CTCF (Hnisz et al. 2013; Dowen et al. 2014). These data point to cell-type-specific differences in CTCF binding to super-enhancers, while cohesin is enriched at super-enhancers in ES cells as well as in thymocytes (Hnisz et al. 2013; Dowen et al. 2014; this study).
We imagine that co-evolution of regulatory elements, CTCF binding sites, and cohesin recruitment mechanisms has allowed for the optimal integration of cohesin-based interactions to meet the requirements of specific genomic regions in specific cell types. Our data suggest a model where the spatial clustering of enhancer elements by cohesin can either isolate or connect gene promoters to enhancers (Fig. 5C). Cohesin depletion can up- or down-regulate gene expression, but the direction of change is nonrandom: Expression of the most actively transcribed genes is preferentially reduced, suggesting that the dispersal of enhancer interactions has a negative impact on the expression of these genes. In contrast, poorly transcribed genes appear to benefit from the dispersal of clustered enhancers, as their expression is preferentially enhanced. Spatial clustering therefore provides a unifying mechanism to explain how CTCF and cohesin can simultaneously facilitate “appropriate” enhancer-promoter interactions (Kagey et al. 2010; Seitan et al. 2011) and block “inappropriate” enhancer-promoter interactions, a function previously described as “insulation” (Wallace and Felsenfeld 2007).
Methods
Experimental methods
The conditional Rad21 allele crossed to CD4Cre has been previously described (Seitan et al. 2011). Methods for RT- and genomic PCR, chromosome conformation capture, and ChIP-seq have been previously described (Seitan et al. 2011). ChIP was performed using antibodies to SMC1A (Bethyl Laboratories, A300-055A), H3K27ac (Active Motif, 39133), H3K4me1 (Abcam, ab8895), and Histone H3 (Abcam, ab1791). Single-read sequencing libraries were prepared from 10 ng of ChIP DNA and sequenced according to the manufacturer's protocols (Illumina Genome Analyzer II). Reads of 38 bases were aligned to the Mus musculus mm9 genome assembly using ELAND (Illumina), and WIG files generated with FindPeaks (http://vancouvershortr.sourceforge.net) (Fejes et al. 2008) were visualized with the UCSC Genome Browser (http://www.genome.ucsc.edu/).
For 3C, cells were fixed in 10% FCS, 1% formaldehyde for 10 min at room temperature, and fixation was stopped with glycine (0.125M). A total of 107 cells per sample were lysed in 10 mM Tris, pH 8, 10 mM NaCl, 5 mM MgCl2, 0.2% NP-40 for 30 min on ice. The nuclei were pelleted and resuspended in 0.5mL 1.2× digestion buffer (NEB2, New England BioLabs), and permeabilized with SDS (0.5% final concentration) for 1 h at 37°C, shaking at 800 rpm, and 3.3% Triton X-100 was added for an additional 1 h at 37°C. Two thousand units HindIII (New England BioLabs) were added before incubation overnight at (37°C, 800 rpm) and inactivated with SDS (1.5%, 65°C, 30 min). The reaction was diluted in 6.2 mL 1.1× T4 ligase buffer (New England BioLabs) and incubated at 37°C for 1 h after addition of 1% Triton X-100. Eight hundred units T4 DNA ligase (New England BioLabs) were added for 4 h at 16°C, and crosslinking was reversed by 300 μg proteinase K (65°C, 16 h). Three hundred micrograms RNase A were added for 1 h at 37°C. DNA was isolated by phenol/chloroform extraction and ethanol precipitation, quantified using Quant-iT PicoGreen (Invitrogen), and 200 ng DNA were used per TaqMan PCR reaction (QuantiFast, Qiagen). Data were normalized to the crosslinking frequency between the anchor and the neighboring HindIII fragment. Chromatin fractionation was carried out as described in Seitan et al. (2006), and immunoblots were performed using antibodies to SMC3 (Abcam, ab9263) and SMC1A (Bethyl Laboratories, A300-055A). Primers used in 3C experiments are listed in Supplemental Table 2. Primers used in ChIP-PCR experiments are listed in Supplemental Table 3.
Data
Hi-C, RNA-seq, and ChIP-seq data sets used in this study are listed in Supplemental Table 4.
ChIP-seq read mapping and peak calling
Read alignment for H3K27ac, SMC1A, RAD21, MED1, NIPBL, CTCF, H3K4me3, and H3K4me1 was carried out using Bowtie version 0.12.8 (Langmead et al. 2010), discarding multimapping reads and allowing no more than two mismatches (“–m 1 –v 2”). Peak calling was carried out for H3K27ac and CTCF using MACS version 1.4.2 with default settings (Zhang et al. 2008).
RNA-seq data analysis
Raw reads for each condition and replicate were independently aligned to mouse transcript sequences (cDNA sequences from Ensembl version 66, NCBI37/mm9) using Bowtie version 0.12.8 with default parameters as described in Seitan et al. (2013). Gene expression estimates and normalized count equivalents were obtained using MMSEQ version 0.11.2 (http://github.com/eturro/mmseq) (Turro et al. 2011), and we used the Bioconductor R package DESeq version 1.6.1 (http://bioconductor.org/packages/release/bioc/html/DESeq.html) (Anders and Huber 2010) to determine significantly differentially expressed genes in control versus cohesin-deficient thymocytes at FDR = 0.05 as described in Seitan et al. (2013). Expressed genes were defined as those having log(expression_level + 1) ≥ 1 in control cells; otherwise, genes were considered silent (Seitan et al. 2013).
Hi-C data analysis
Iterative error correction was performed as described in Imakaev et al. (2012). The HOMER Hi-C software analysis pipeline (http://homer.salk.edu/homer/interactions/index.html) was used to determine significant interactions and differential interactions and to perform structured interaction matrix analysis (Lin et al. 2012). Paired-end reads were trimmed to remove sequence following the canonical HindIII ligation junction sequence (1-bp mismatch allowed to account for potential star activity). Trimmed reads were aligned independently to the mouse reference genome assembly (NCBI37/mm9) using Bowtie 2 (Langmead and Salzberg 2012) in local mode with a maximum of one mismatch in the seed alignment (“--local -N 1”). Paired-end reads were merged and filtered to remove duplicate read pairs (“-tbp 1”), paired-end reads likely representing continuous genomic fragments or re-ligation events (“-removePEbg”), self-ligations (“-removeSelfLigation”), and reads originating from regions with unusually high tag density (“-removeSpikes 10000 5”). Additionally, only read-pairs where both ends mapped near restriction sites were retained (“-both”). To determine genomic features associated with chromatin interactions, we used SIMA, which pools Hi-C information associated with a given set of genomic regions within a specified set of domains (Lin et al. 2012). We used default resolution (“-res 2500”) and optimal Hi-C interaction search space parameters (“-superRes 10000”) to consider all reads within a 10-kb window around the center of each feature. Within-compartment associations were assessed independently in control and cohesin-deficient thymocytes for RAD21 peaks, canonical TSSs (excluding pseudogenes; Ensembl version 66), conventional enhancers (Shen et al. 2012), and random regions, as previously described (Seitan et al. 2013). Within-super-enhancer interactions were assessed for all super-enhancers of more than 100 kb or 50 kb in length. “Peaks” within these regions were defined by taking the summits of constituent H3K27ac peaks, extending to 1 kb, and taking the intersection of these regions between all samples. Super-enhancers that are not active in thymocytes contain no or very few H3K27ac peaks, and we chose random peaks within them such that the number of peaks in each region was similar to the number of peaks in thymocyte super-enhancers of comparable size. All interactions were normalized using HOMER with a background model that takes sequencing depth and genomic distance between interacting regions into account. The size and direction of change in interaction ratios in cohesin-depleted thymocytes was compared using a paired statistical test (Wilcoxon signed-rank test) to provide a measure for the cohesin dependence of long-range interactions between specific features.
Identification of super-enhancers
Super-enhancers were defined using ROSE (https://bitbucket.org/young_computation/rose) (Whyte et al. 2013) with a transcription start site exclusion zone size of 4 kb (“-t 2000”) and the default stitching size of 12.5 kb. H3K27ac peaks were used as input constituent enhancers, and input-subtracted H3K27ac ChIP-seq signal was used for ranking the stitched regions. We defined a consensus set of super-enhancers by taking the intersection of regions between two biological replicates for each cell type and then taking the union of these regions between control and cohesin-deficient cells. The remaining regions from ROSE output were filtered to remove regions within 2.5 kb of a transcription start site, and a consensus set of conventional enhancers was defined in the same way as for super-enhancers.
Assignment of enhancers to genes
“Nearest neighbor” genes are defined by assigning enhancers or super-enhancers to the expressed transcript whose TSS is the nearest to the center of the enhancer. “Overlapping genes” are those where any part of the gene body overlaps an enhancer or super-enhancer. Genes with a TSS within 40 kb of a super-enhancer are also considered.
Grouping super-enhancers by CTCF binding
We defined a super-enhancer boundary as being bound by CTCF if there was a CTCF peak within 2 kb of the edge of the super-enhancer as defined above. The R package genomation (Akalin et al. 2014) was used to generate the heatmap in Figure 3C.
Multinomial logistic regression model
We used a multinomial logistic regression model to predict gene expression changes in cohesin-deficient thymocytes as previously described (Seitan et al. 2013). In addition to the previously used features, we included the variables gene position “Next to enhancer” (genes that are nearest neighbors of conventional enhancers), “Near enhancer cluster” (genes positioned within 40 kb of an enhancer cluster), and “Next to enhancer cluster” (genes that are nearest neighbors of super-enhancers).
Data access
ChIP-seq data from this study have been submitted to the NCBI Gene Expression Omnibus (GEO; http://www.ncbi.nlm.nih.gov/geo/) under accession number GSE61428. The code used to produce the manuscript figures from the processed data is available as Supplemental File 1.
Supplementary Material
Acknowledgments
We thank Drs. L. Game and M. Jones for high-throughput sequencing and Dr. J. Elliott for cell sorting. This work was supported by the Wellcome Trust and the Medical Research Council, UK.
Author contributions: E.I.-S., V.S., A.J.F., P.F., J.D., A.G.F., B.L., and M.M. devised the study; V.S., E.I.-S., and M.M. performed experiments; E.I.-S., A.J.F., T.C., and B.L. analyzed and managed data; and E.-I.S., V.S., B.L., A.G.F., and M.M. wrote the paper.
Footnotes
[Supplemental material is available for this article.]
Article published online before print. Article, supplemental material, and publication date are at http://www.genome.org/cgi/doi/10.1101/gr.184986.114.
References
- Akalin A, Franke V, Vlahoviček K, Mason CE, Schübeler D. 2014. genomation: a toolkit to summarize, annotate and visualize genomic intervals. Bioinformatics 10.1093/bioinformatics/btu775. [DOI] [PubMed] [Google Scholar]
- Anders S, Huber W. 2010. Differential expression analysis for sequence count data. Genome Biol 11:R106. [DOI] [PMC free article] [PubMed] [Google Scholar]
- Dixon JR, Selvaraj S, Yue F, Kim A, Li Y, Shen Y, Hu M, Liu JS, Ren B. 2012. Topological domains in mammalian genomes identified by analysis of chromatin interactions. Nature 485:376–380. [DOI] [PMC free article] [PubMed] [Google Scholar]
- Dowen JM, Fan ZP, Hnisz D, Ren G, Abraham BJ, Zhang LN, Weintraub AS, Schuijers J, Lee TI, Zhao K, et al. 2014. Control of cell identity genes occurs in insulated neighborhoods in mammalian chromosomes. Cell 159:374–387. [DOI] [PMC free article] [PubMed] [Google Scholar]
- Faure AJ, Schmidt D, Watt S, Schwalie PC, Wilson MD, Xu H, Ramsay RG, Odom DT, Flicek P. 2012. Cohesin regulates tissue-specific expression by stabilizing highly occupied cis-regulatory modules. Genome Res 22:2163–2175. [DOI] [PMC free article] [PubMed] [Google Scholar]
- Fejes AP, Robertson G, Bilenky M, Varhol R, Bainbridge M, Jones SJ. 2008. FindPeaks 3.1: a tool for identifying areas of enrichment from massively parallel short-read sequencing technology. Bioinformatics 24:1729–1730. [DOI] [PMC free article] [PubMed] [Google Scholar]
- Gibcus JH, Dekker J. 2013. The hierarchy of the 3D genome. Mol Cell 49:773–782. [DOI] [PMC free article] [PubMed] [Google Scholar]
- Hadjur S, Williams LM, Ryan NK, Cobb BS, Sexton T, Fraser P, Fisher AG, Merkenschlager M. 2009. Cohesins form chromosomal cis-interactions at the developmentally regulated IFNG locus. Nature 460:410–413. [DOI] [PMC free article] [PubMed] [Google Scholar]
- Hnisz D, Abraham BJ, Lee TI, Lau A, Saint-André V, Sigova AA, Hoke HA, Young RA. 2013. Super-enhancers in the control of cell identity and disease. Cell 155:934–947. [DOI] [PMC free article] [PubMed] [Google Scholar]
- Hou C, Dale R, Dean A. 2010. Cell type specificity of chromatin organization mediated by CTCF and cohesin. Proc Natl Acad Sci 107:3651–3656. [DOI] [PMC free article] [PubMed] [Google Scholar]
- Imakaev M, Fudenberg G, McCord RP, Naumova N, Goloborodko A, Lajoie BR, Dekker J, Mirny LA. 2012. Iterative correction of Hi-C data reveals hallmarks of chromosome organization. Nat Methods 9:999–1003. [DOI] [PMC free article] [PubMed] [Google Scholar]
- Kagey MH, Newman JJ, Bilodeau S, Zhan Y, Orlando DA, van Berkum NL, Ebmeier CC, Goossens J, Rahl PB, Levine SS, et al. 2010. Mediator and cohesin connect gene expression and chromatin architecture. Nature 467:430–435. [DOI] [PMC free article] [PubMed] [Google Scholar]
- Langmead B, Salzberg S. 2012. Fast gapped-read alignment with Bowtie 2. Nat Methods 9:357–359. [DOI] [PMC free article] [PubMed] [Google Scholar]
- Langmead B, Trapnell C, Pop M, Salzberg SL. 2010. Ultrafast and memory-efficient alignment of short DNA sequences to the human genome. Genome Biol 10:R25. [DOI] [PMC free article] [PubMed] [Google Scholar]
- Lieberman-Aiden E, van Berkum NL, Williams L, Imakaev M, Ragoczy T, Telling A, Amit I, Lajoie BR, Sabo PJ, Dorschner MO, et al. 2009. Comprehensive mapping of long-range interactions reveals folding principles of the human genome. Science 326:289–293. [DOI] [PMC free article] [PubMed] [Google Scholar]
- Lin T, Chao C, Saito S, Mazur SJ, Murphy ME, Appella E, Xu Y. 2005. p53 induces differentiation of mouse embryonic stem cells by suppressing Nanog expression. Nat Cell Biol 7:165–171. [DOI] [PubMed] [Google Scholar]
- Lin YC, Benner C, Mansson R, Heinz S, Miyazaki K, Miyazaki M, Chandra V, Bossen C, Glass CK, Murre C. 2012. Global changes in the nuclear positioning of genes and intra- and interdomain genomic interactions that orchestrate B cell fate. Nat Immunol 13:1196–1204. [DOI] [PMC free article] [PubMed] [Google Scholar]
- Maimets T, Neganova I, Armstrong L, Lako M. 2008. Activation of p53 by nutlin leads to rapid differentiation of human embryonic stem cells. Oncogene 27:5277–5287. [DOI] [PubMed] [Google Scholar]
- Merkenschlager M, Odom DT. 2013. CTCF and cohesin: linking gene regulatory elements with their targets. Cell 152:1285–1297. [DOI] [PubMed] [Google Scholar]
- Mishiro T, Ishihara K, Hino S, Tsutsumi S, Aburatani H, Shirahige K, Kinoshita Y, Nakao M. 2009. Architectural roles of multiple chromatin insulators at the human apolipoprotein gene cluster. EMBO J 28:1234–1245. [DOI] [PMC free article] [PubMed] [Google Scholar]
- Nasmyth K, Haering CH. 2009. Cohesin: its roles and mechanisms. Annu Rev Genet 43:525–558. [DOI] [PubMed] [Google Scholar]
- Nativio R, Wendt KS, Ito Y, Huddleston JE, Uribe-Lewis S, Woodfine K, Krueger C, Reik W, Peters JM, Murrell A. 2009. Cohesin is required for higher-order chromatin conformation at the imprinted IGF2-H19 locus. PLoS Genet 5:e1000739. [DOI] [PMC free article] [PubMed] [Google Scholar]
- Nora EP, Lajoie BR, Schulz EG, Giorgetti L, Okamoto I, Servant N, Piolot T, van Berkum NL, Meisig J, Sedat J, et al. 2012. Spatial partitioning of the regulatory landscape of the X-inactivation centre. Nature 485:381–385. [DOI] [PMC free article] [PubMed] [Google Scholar]
- Parelho V, Hadjur S, Spivakov M, Leleu M, Sauer S, Gregson HC, Jarmuz A, Canzonetta C, Webster Z, Nesterova T, et al. 2008. Cohesins functionally associate with CTCF on mammalian chromosome arms. Cell 132:422–433. [DOI] [PubMed] [Google Scholar]
- Parker SC, Stitzel ML, Taylor DL, Orozco JM, Erdos MR, Akiyama JA, van Bueren KL, Chines PS, Narisu N; NISC Comparative Sequencing Program, et al. 2013. Chromatin stretch enhancer states drive cell-specific gene regulation and harbor human disease risk variants. Proc Natl Acad Sci 110:17921–17926. [DOI] [PMC free article] [PubMed] [Google Scholar]
- Sanyal A, Lajoie BR, Jain G, Dekker J. 2012. The long-range interaction landscape of gene promoters. Nature 489:109–113. [DOI] [PMC free article] [PubMed] [Google Scholar]
- Schmidt D, Schwalie PC, Ross-Innes CS, Hurtado A, Brown GD, Carroll JS, Flicek P, Odom DT. 2010. A CTCF-independent role for cohesin in tissue-specific transcription. Genome Res 20:578–588. [DOI] [PMC free article] [PubMed] [Google Scholar]
- Seitan VC, Banks P, Laval S, Majid NA, Dorsett D, Rana A, Smith J, Bateman A, Krpic S, Hostert A, et al. 2006. Metazoan Scc4 homologs link sister chromatid cohesion to cell and axon migration guidance. PLoS Biol 4:e242. [DOI] [PMC free article] [PubMed] [Google Scholar]
- Seitan VC, Hao B, Tachibana-Konwalski K, Lavagnolli T, Mira-Bontenbal H, Brown KE, Teng G, Carroll T, Terry A, Horan K, et al. 2011. A role for cohesin in T-cell-receptor rearrangement and thymocyte differentiation. Nature 476:467–471. [DOI] [PMC free article] [PubMed] [Google Scholar]
- Seitan VC, Faure AJ, Zhan Y, McCord RP, Lajoie BR, Ing-Simmons E, Lenhard B, Giorgetti L, Heard E, Fisher AG, et al. 2013. Cohesin-based chromatin interactions enable regulated gene expression within preexisting architectural compartments. Genome Res 23:2066–2077. [DOI] [PMC free article] [PubMed] [Google Scholar]
- Shen Y, Yue F, McCleary DF, Ye Z, Edsall L, Kuan S, Wagner U, Dixon J, Lee L, Lobanenkov VV, et al. 2012. A map of the cis-regulatory sequences in the mouse genome. Nature 488:116–120. [DOI] [PMC free article] [PubMed] [Google Scholar]
- Sofueva S, Yaffe E, Chan WC, Georgopoulou D, Vietri Rudan M, Mira-Bontenbal H, Pollard SM, Schroth GP, Tanay A, Hadjur S. 2013. Cohesin-mediated interactions organize chromosomal domain architecture. EMBO J 32:3119–3129. [DOI] [PMC free article] [PubMed] [Google Scholar]
- Thurman RE, Rynes E, Humbert R, Vierstra J, Maurano MT, Haugen E, Sheffield NC, Stergachis AB, Wang H, Vernot B, et al. 2012. The accessible chromatin landscape of the human genome. Nature 489:75–82. [DOI] [PMC free article] [PubMed] [Google Scholar]
- Turro E, Su SY, Gonçalves Â, Coin LJ, Richardson S, Lewin A. 2011. Haplotype and isoform specific expression estimation using multi-mapping RNA-seq reads. Genome Biol 12:R13. [DOI] [PMC free article] [PubMed] [Google Scholar]
- Wallace JA, Felsenfeld G. 2007. We gather together: insulators and genome organization. Curr Opin Genet Dev 17:400–407. [DOI] [PMC free article] [PubMed] [Google Scholar]
- Wang H, Maurano MT, Qu H, Varley KE, Gertz J, Pauli F, Lee K, Canfield T, Weaver M, Sandstrom R, et al. 2012. Widespread plasticity in CTCF occupancy linked to DNA methylation. Genome Res 22:1680–1688. [DOI] [PMC free article] [PubMed] [Google Scholar]
- Wendt KS, Yoshida K, Itoh T, Bando M, Koch B, Schirghuber E, Tsutsumi S, Nagae G, Ishihara K, Mishiro T, et al. 2008. Cohesin mediates transcriptional insulation by CCCTC-binding factor. Nature 451:796–801. [DOI] [PubMed] [Google Scholar]
- Whyte WA, Orlando DA, Hnisz D, Abraham BJ, Lin CY, Kagey MH, Rahl PB, Lee TI, Young RA. 2013. Master transcription factors and mediator establish super-enhancers at key cell identity genes. Cell 153:307–319. [DOI] [PMC free article] [PubMed] [Google Scholar]
- Williamson I, Berlivet S, Eskeland R, Boyle S, Illingworth RS, Paquette D, Dostie J, Bickmore WA. 2014. Spatial genome organization: contrasting views from chromosome conformation capture and fluorescence in situ hybridization. Genes Dev 28:2778–2791. [DOI] [PMC free article] [PubMed] [Google Scholar]
- Yan J, Enge M, Whitington T, Dave K, Liu J, Sur I, Schmierer B, Jolma A, Kivioja T, Taipale M, et al. 2013. Transcription factor binding in human cells occurs in dense clusters formed around cohesin anchor sites. Cell 154:801–813. [DOI] [PubMed] [Google Scholar]
- Zhang Y, Liu T, Meyer CA, Eeckhoute J, Johnson DS, Bernstein BE, Nussbaum C, Myers RM, Brown M, Li W, et al. 2008. Model-based analysis of ChIP-Seq (MACS). Genome Biol 9:R137. [DOI] [PMC free article] [PubMed] [Google Scholar]
- Zhang JA, Mortazavi A, Williams BA, Wold BJ, Rothenberg EV. 2012. Dynamic transformations of genome-wide epigenetic marking and transcriptional control establish T cell identity. Cell 149:467–482. [DOI] [PMC free article] [PubMed] [Google Scholar]
- Zuin J, Dixon JR, van der Reijden MI, Ye Z, Kolovos P, Brouwer RW, van de Corput MP, van de Werken HJ, Knoch TA, van IJcken WF, et al. 2014. Cohesin and CTCF differentially affect chromatin architecture and gene expression in human cells. Proc Natl Acad Sci 111:996–1001. [DOI] [PMC free article] [PubMed] [Google Scholar]
Associated Data
This section collects any data citations, data availability statements, or supplementary materials included in this article.