

Abstract
Transcription factors (TFs) are key regulators of cell fate. The estimated 755 genes that encode DNA binding domain-containing proteins comprise ∼5% of all Drosophila genes. However, the majority has remained uncharacterized so far due to the lack of proper genetic tools. We generated 594 site-directed transgenic Drosophila lines that contain integrations of individual UAS-TF constructs to facilitate spatiotemporally controlled misexpression in vivo. All transgenes were expressed in the developing wing, and two-thirds induced specific phenotypic defects. In vivo knockdown of the same genes yielded a phenotype for 50%, with both methods indicating a great potential for misexpression to characterize novel functions in wing growth, patterning, and development. Thus, our UAS-TF library provides an important addition to the genetic toolbox of Drosophila research, enabling the identification of several novel wing development-related TFs. In parallel, we established the chromatin landscape of wing imaginal discs by ChIP-seq analyses of five chromatin marks and RNA Pol II. Subsequent clustering revealed six distinct chromatin states, with two clusters showing enrichment for both active and repressive marks. TFs that carry such “bivalent” chromatin are highly enriched for causing misexpression phenotypes in the wing, and analysis of existing expression data shows that these TFs tend to be differentially expressed across the wing disc. Thus, bivalently marked chromatin can be used as a marker for spatially regulated TFs that are functionally relevant in a developing tissue.
Transcriptional regulation plays a pivotal role during the development of all living organisms. The ability of a cell to grow, differentiate, or respond to environmental cues requires the coordinated and regulated expression of hundreds of genes, which is mostly controlled by sequence-specific transcription factors (TFs) that act as activators or repressors (e.g., Davidson 2006; Deplancke 2009). Despite their importance for the development and life of organisms, the biological function of the majority of eukaryotic TFs remain poorly characterized. Since the human genome encodes approximately ∼1500 TFs and features abundant inherent functional redundancy (Tupler et al. 2001), it is desirable to study TFs in a model system that is genetically more tractable. The fruit fly Drosophila melanogaster provides powerful tools to study developmental gene regulatory networks: (1) The Drosophila genome is fully sequenced, annotated with high quality and genetically much more accessible than many mammalian genomes, which is important for mapping regulatory elements and inferring their activities (The modENCODE Consortium et al. 2010; Nègre et al. 2011; Arnold et al. 2013); (2) the Drosophila wing constitutes a complex organ system that allows precise spatiotemporal genetic manipulation with the possibility to isolate large quantities of organ-specific biological material; and (3) 755 genes have been identified in Drosophila that contain a DNA binding domain (Adryan and Teichmann 2006; Hens et al. 2011). This lower complexity makes it possible to comprehensively study all TFs in parallel in vivo, as illustrated by the detailed study of their developmental expression patterns using in situ hybridization (Hammonds et al. 2013). (4) Open-reading frames (ORFs) have been cloned for the large majority of TF genes (Hens et al. 2011).
Studying gene function often relies on loss-of-function approaches. However, ∼75% of all Drosophila genes appear to be phenotypically silent upon loss of function (Miklos and Rubin 1996). As such, mis- or overexpression provides a powerful alternative to study gene function in such cases. In addition, UAS-driven transgenes facilitate precise spatiotemporal control of gene expression (Brand and Perrimon 1993). Moreover, the expressed transgene is exactly defined by the integrated DNA sequence. Thus, phenotypic effects are caused by the transgene alone and not by unspecific side effects. Finally, the introduction of a small protein tag (3 × HA) provides the opportunity for biochemical applications while not having to rely on antibodies against the endogenous protein, making the transgenic animals an in vivo resource for studying all TFs.
Here, we report the generation and initial characterization of transgenic flies for the vast majority of Drosophila TFs. We also established the chromatin landscape of the developing wing disc by genome-wide profiling of five different chromatin marks as well as RNA Pol II. The latter analyses revealed genes with simultaneous combinations of activating and repressing marks, also termed “bivalently” marked genes (Bernstein et al. 2006). Interestingly, we found that such genes were highly enriched for TFs with differential expression across the wing disc that also caused severe phenotypes in the wing upon misexpression. Our work therefore provides new insights into the biological relevance of chromatin bivalency in a developing organ.
Results
Library generation and phenotypic analysis
We generated a site-directed library of 594 UAS-TF lines by using the phiC31 integrase system and the landing site 86Fb on the third chromosome (for detailed information on the landing site, see Bischof et al. 2007). All transgenes are fused to a 3 × HA-tag to facilitate biochemical applications. Importantly, anti-HA staining revealed correct subcellular localization of misexpressed TFs in the nucleus, and experimental analyses on a select number of TFs showed the expected molecular behavior (Supplemental Fig. S1A–C), underscoring the quality of this TF resource.
We started to characterize the obtained transgenic lines by expressing all transgenes in the developing wing using MS1096-Gal4 and recorded the induced phenotypes in the adult wing (for a complete list of all available transgenic lines and the corresponding phenotypes, see Supplemental Table S1). MS1096-Gal4 is ubiquitously expressed throughout the L3 larval stage within the wing pouch (Supplemental Fig. S1D–F), with stronger expression in the dorsal compartment (Capdevila and Guerrero 1994; Lunde et al. 1998). We found that almost two thirds of all TFs (65.2%) are capable of inducing highly reproducible visible phenotypes in the wing upon expression by the MS1096-Gal4 driver. These phenotypes include strong reduction of wing size (class ++: 76/594; 12.8%) or almost complete absence of the adult wing (class +++: 112/594; 18.9%). We also observed lethality for a large number of induced TFs (131/594; 22.1%) (Fig. 1). This lethality most likely stems from additional weak MS1096-Gal4 activity in the wing hinge region (Supplemental Fig. S1D–F; Neumann and Cohen 1996) and during embryonic development (Marquez et al. 2001). However, when TFs of the lethal class were retested at a lower temperature (18°C instead of 25°C), almost all crosses produced viable offspring that showed a strong phenotype (class +++) (Supplemental Table S1). Since the lower temperature results in lower expression levels, this indicates that the phenotypic outcome of TF misexpression is dose dependent. The fact that phenotypes were generally stronger in male offspring compared to their female siblings supports this hypothesis, because the MS1096-Gal4 driver is located on the X chromosome, thus causing experimental males to be hemizygous while females are heterozygous for the driver transgene (Supplemental Table S1).
Figure 1.

Phenotypic analysis of the TF library by MS1096-Gal4–driven expression in the developing wing. Phenotypes upon misexpression by MS1096-Gal4 (black bars) are compared to RNAi knockdown (gray bars) and two other misexpressed gene sets: cell cycle regulators (white bars) and miRNAs (green bars). Phenotypic strength was recorded from no effect, weak growth, or patterning defects (+) to severe size or patterning defects (++), almost complete absence of wings (+++) to lethality (lethal); bars show the distribution of observed phenotypes for each data set. Representative examples for the phenotypes (+ to +++) are shown. Arrowheads point to patterning defects.
We further compared the abundance of phenotypes to a UAS-ORF library that mostly encodes non-TF proteins that were previously implicated in cell cycle control (Björklund et al. 2006; Schertel et al. 2013). After removing 34 TFs from the UAS-ORF data set to eliminate bias caused by this overlap, we found that induced TF expression results in significantly more and relatively stronger phenotypes in the wing compared to the set of UAS-ORF transgenes (P = 6.3 × 10⁻¹⁰, Fisher's exact test) (Fig. 1; Table 1). Another class of genes that regulates gene expression involves microRNAs (miRNAs). These noncoding RNAs typically cause only modest gene expression changes of their targets (Selbach et al. 2008) and are thought to either fine-tune gene expression levels or aid in ensuring expression robustness (Posadas and Carthew 2014). In contrast, TFs can often act in a “switch-like” manner. Consistent with this general view, we found a significantly larger proportion of TFs that induce clearly visible phenotypes than do miRNAs (P = 1.1 × 10⁻¹⁰, Fisher's exact test) (Table 1). Next, we extracted all 511 genes that are annotated under the term “wing disc development” in FlyBase, among which 72 were tested in our study. We found a significantly greater proportion of phenotypes among these 72 TFs compared to the remaining 522 in our library (P = 0.02, Fisher's exact test), further underscoring our hypothesis that we can identify important wing disc factors via misexpression. Finally, we explored whether the probability of inducing a misexpression phenotype is inversely related to the endogenous expression level of the respective TF. The underlying reasoning is that additional expression from a transgene may cause a more benign effect when the focal gene is already highly expressed compared to a low expression state. To test this hypothesis, we employed RNA Pol II ChIP-seq data that were generated as part of our aim to characterize the chromatin landscape of the imaginal wing disc (see below). TFs were grouped into five bins based on RNA pol II occupancy, with each bin containing 20% of all TFs. We found that significantly more and stronger phenotypes are caused by TFs whose endogenous transcription in wing disc is low compared to TFs whose endogenous transcription is already high, reflecting an important disruption of the endogenous wing gene regulatory network by the ectopically expressed TF (Fig. 2A) (e.g., P = 1.5 × 10⁻⁵ for a greater proportion of severe [++; +++, lethal] phenotypes in the lowest 20% compared to the highest 20%, Fisher's exact test). The same analysis based on RNAi phenotypes revealed the opposite trend, although less significant (P = 0.037, Fisher's exact test): Genes that are endogenously more highly expressed are slightly more prone to cause phenotypic effects upon knockdown than are more lowly expressed genes (Supplemental Fig. S2A).
Table 1.
Proportion of wing phenotypes induced by different gene libraries
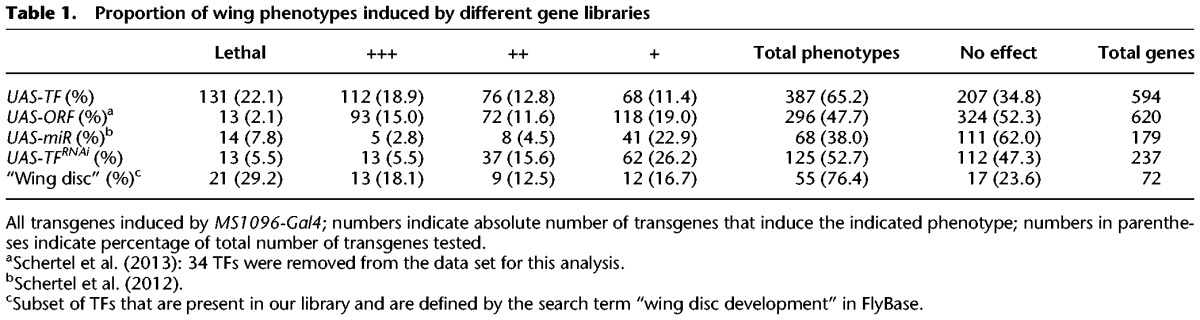
Figure 2.
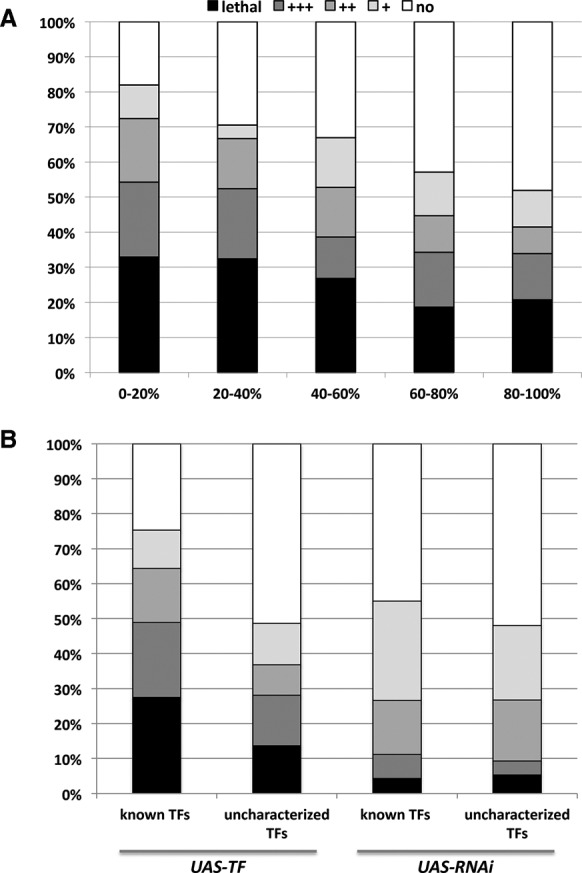
Characteristics of phenotype-inducing TFs. (A) The misexpression phenotype distributions of TFs belonging to specific RNA Pol II occupancy bins (from the lowest to the highest 20% RNA Pol II occupancy) are compared. RNA Pol II DNA occupancy was used here as a proxy for the extent of TF expression. Grayscaling of the bars applies also to panel B. (B) Effects of overexpression are compared to those of RNAi-mediated knockdown. UAS-TF and UAS-RNAi were grouped into known genes with annotated names and uncharacterized genes that are only annotated by a CG number.
In summary, our analysis strongly suggests that our TF transgenes were successfully induced in wing disc and produced functional proteins. Furthermore, a high proportion of the transgenic TFs can induce specific phenotypes upon misexpression, providing a valuable resource to study the molecular function of TFs.
Comparison of mis- or overexpression and RNAi phenotypes
Next, we compared TF misexpression to TF knockdown by in vivo RNAi (Dietzl et al. 2007). We randomly chose RNAi lines from the VDRC in vivo collection. We preferred the site-directed KK lines that were predicted to cause no off-target effects. We found that about half (52.7%) of the TFs that we knocked down by UAS-RNAi lines (n = 237) caused a phenotypic effect in the wing (Table 1), closely resembling the ratios found in other studies (Molnar et al. 2012).
Upon comparing misexpression and knockdown phenotypes, we first focused on TFs that have only a CG number assigned to them and have thus so far been poorly characterized. The fact that no specific role has been defined in previous studies for these TFs could indicate that they target only a small set of genes or that they only act in very specific conditions. However, we found a large number of phenotypes caused by misexpression of these uncharacterized TFs (Fig. 2B). Although the proportion (91/195, 46.7%) is much lower than the corresponding proportion of TFs that have an assigned name (296/399, 74.2%), it nevertheless suggests that many TFs remain to be characterized that are functionally relevant during wing development (Fig. 2B). The same analysis performed on RNAi-mediated knockdown phenotypes showed little difference between the proportion of different phenotypes for characterized and uncharacterized TFs.
We subsequently compared the qualitative effects that were caused by individual TFs upon misexpression or RNAi, respectively. We found a relatively weak correlation between phenotypes caused by elevated and reduced TF levels. Roughly half (90/179, 50.3%) of all TFs that caused phenotypes upon misexpression also caused phenotypes upon knockdown. Surprisingly, this proportion is also reached for the class that did not induce phenotypes upon misexpression (Supplemental Fig. S2B,C). Here, 16 out of 30 (53.3%) did induce a phenotype when knocked down. However, there is only little correlation between the RNAi and misexpression phenotypes, indicating that misexpression can provide additional information that would be missed by RNAi knockdown alone. Of the 91 “novel” TFs that caused misexpression phenotypes, 57 were also tested by RNAi. Of these, 29 caused a wing phenotype upon knockdown, suggesting that those genes are important during wing development (Supplemental Table S1). In addition, we identified four uncharacterized TFs (CG10431, CG10565, CG10654, and CG11398) that caused a phenotype upon knockdown but not by misexpression.
In summary, we found 97 phenotypes for previously uncharacterized TFs either by RNAi, misexpression, or both. In general terms, however, misexpression phenotypes were more abundant, supporting our hypothesis that misexpression is a powerful method to study specific gene functions that might not be accessible to loss-of-function approaches.
The chromatin landscape of the wing disc and its relationship to misexpression phenotypes
Chromatin profiling has proven to be a valuable strategy to infer novel regulatory principles (The modENCODE Consortium et al. 2010), making it a complementary strategy to TF misexpression and knockdown approaches. To determine the chromatin landscape in the wing disc, we used ChIP-seq to map enrichment of histone modifications in imaginal wing discs at 120 h of development. In addition, we performed RNA Pol II ChIP-seq as a proxy for transcriptional activity, which we aimed to relate to the chromatin state. We noted however a good correlation between published wing gene expression data (McKay and Lieb 2013) and RNA Pol II gene promoter and gene body DNA occupancy (Fig. 3A; Supplemental Fig. S3A). To cover multiple active chromatin states, we used two antibodies that simultaneously recognize more than one histone modification: (1) an antibody against H3K4me2 and H3K4me3 that we named H3K4me2-3 and (2) one that recognizes H3K79-mono, -double, and -triple methylation, referred to as H3K79me1-2-3. All other antibodies specifically recognize individual histone modifications (H3K27ac, H3K4me1, and H3K27me3). A correlation heat map of the resulting histone modification enrichment profiles validated our data sets since, as expected, activating marks grouped closely together (Supplemental Fig. S3B).
Figure 3.

The chromatin landscape of wing discs at the third instar larval stage. (A) Clustering of all detected genes according to the distribution of five histone marks and RNA Pol II as measured by ChIP-seq. Activating marks are indicated in green, repressive marks in red. The locations of the transcription start sites (TSSs) and the transcription end sites (TESs) are indicated by lines within each histone modification column. Previously published wing disc RNA-seq data (McKay and Lieb 2013) are also presented to directly link histone modification, RNA Pol II enrichment, and gene expression. (B) Representative examples for genes in clusters 4a, 4b, 5a, and 5b are shown (“a” reflects genes with low H3K27me3 enrichment, while genes in “b” reflect high enrichment of this mark). Gene loci are indicated at the bottom of the panels and the cluster number is listed at the top of the panels. The same molecular marks as in A are displayed. The scale for all tracks represents the tag depth per base pair, except for the RNA-seq data, for which the log2 of (FPKM + 1) is plotted.
Subsequent clustering of the resulting chromatin profiles along gene bodies as well as the proximal regions 2000 bp upstream and downstream from the respective genes using seqMINER (Ye et al. 2011) revealed six distinct groups with quantitatively comparable enrichment for certain histone modifications and RNA Pol II on genes within each group (Fig. 3A). Clusters 1–3 contain genes with strong to moderate RNA Pol II DNA occupancy, as well as enrichment for histone modifications that are characteristic of active transcription (H3K4me2-3, H3K27ac, H3K79me1-2-3, and the enhancer mark H3K4me1) (Supplemental Fig. S4). We thereby note that even though H3K4me1 has the appearance in Figure 3A of covering the entire gene body, we found it specifically enriched in introns and 5′ upstream gene regions, as expected (Supplemental Fig. S5A,B). A Gene Ontology (GO) enrichment analysis further revealed that clusters 1–3 tend to contain constitutively active genes involved in rather generic molecular processes annotated under very general GO terms (for a complete list of all GO enrichments for each cluster, see Supplemental Table S3).
Cluster 4 contains transcriptionally active genes given the high RNA Pol II DNA occupancy and enrichment for the H3K79me1-2-3 and H3K4me2-3 marks, even though these genes display relatively low H3K27ac levels. Surprisingly, we found that a subset of 241 genes in cluster 4 (Supplemental Table S2) is also enriched for the repressive mark H3K27me3 (subsequently named cluster 4b; Methods). This suggests that these genes are repressed in parts of the wing disc and expressed in others. Alternatively, it could reflect a bivalent chromatin state, which has been observed at developmentally relevant genes in mammalian cells (Bernstein et al. 2006) but which has, to our knowledge, not been previously described in Drosophila. Interestingly, when only cluster 4b genes were taken into account, the strongest GO term enrichment was found for “organ development” or even more specifically “imaginal disc development,” indicating that the bivalent chromatin state of these genes may be reflective of their regulatory potential during wing development (Table 2). Cluster 5 contains genes with relatively low RNA Pol II occupancy, except around their transcription start sites (TSSs). This could mean that the activity of these genes is heterogeneous across the wing disc, with them being transcribed in only a small subsection of the wing disc. Alternatively, it may indicate that many of these cluster 5 genes are in a transcriptionally poised state (Fig. 3B; Muse et al. 2007; Zeitlinger et al. 2007). This is consistent with the generally low levels of the H3K79me1,2,3 transcriptional activity-associated mark on these genes. Moreover, genes within this cluster tend to be associated with gene-proximal or intronic elements that are only enriched for H3K27me3 and H3K4me1 (Fig. 3B). This is similar to the enrichment profile observed for group 4b genes, except that genes in cluster 5 appear not to be transcribed. This particular combination of H3K4me1 and H2K27me3 marks has first been observed in human embryonic stem cells (hESCs), where it was revealed to annotate “poised” enhancers that mediate state-specific or cell type–specific expression of developmental genes (Bajpai et al. 2010; Shlyueva et al. 2014). Consequently, such poised enhancers were found to be associated with lowly transcribed genes, consistent with the relatively low transcriptional activity of genes belonging to cluster 5. For consistency, we also grouped the 194 genes that exhibited such H3K27me3 enrichment in a subcluster (5b as opposed to genes without H3K27me3 enrichment, which were grouped in subcluster 5a). Interestingly, cluster 5b is enriched for genes that are involved in transcriptional regulation such as TFs (Tables 2 and 3), as reflected by the GO enrichment for “regulation of RNA biosynthetic process.” Finally, cluster 6 contains around 7000 genes without enrichment for any of the probed histone modification marks, consistent with the fact that these genes also exhibited very low or undetectable RNA Pol II activity. For some genes in cluster 6, we observed an enrichment of RNA Pol II at the 3′ end, but further investigation showed that this RNA Pol II signal corresponds to actively transcribed adjacent genes.
Table 2.
Detailed information of chromatin cluster content
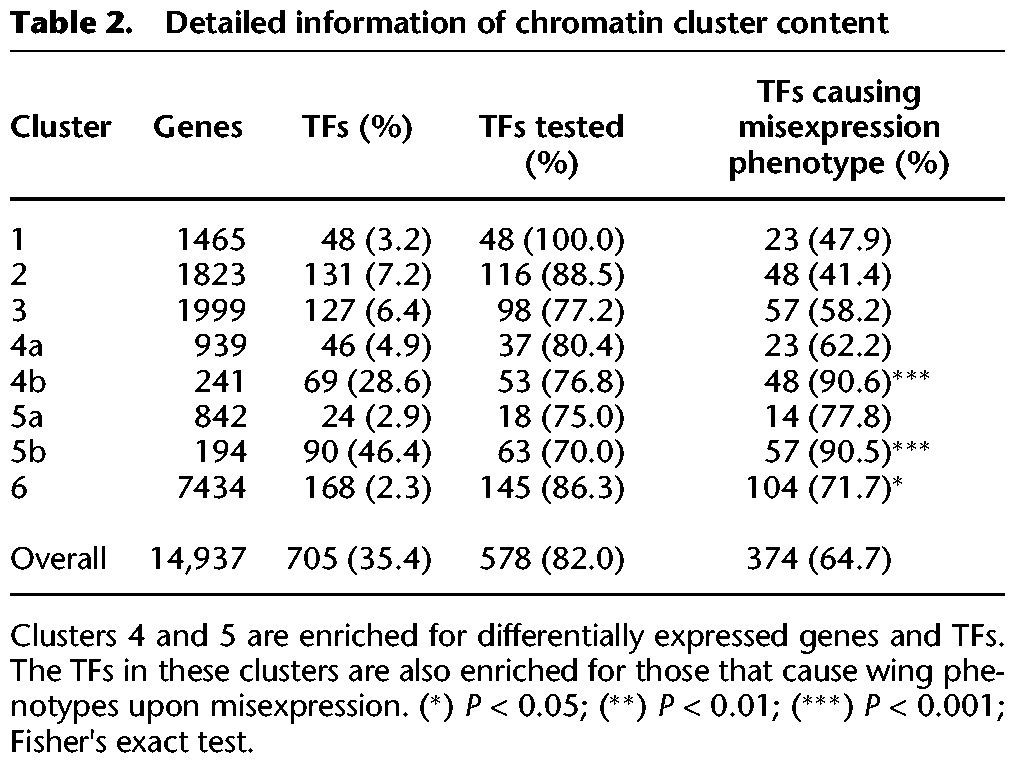
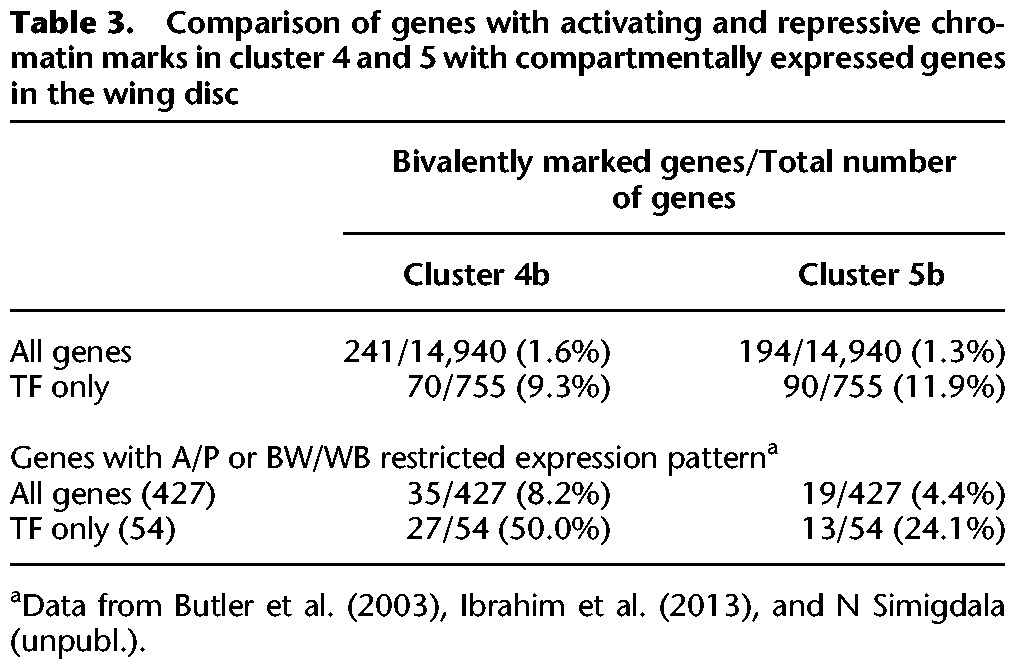
Table 3.
Comparison of genes with activating and repressive chromatin marks in cluster 4 and 5 with compartmentally expressed genes in the wing disc
To validate our clustering results, we applied the same analytical approach on published H3K4me1, H3K4me1, H3K27ac, H3K27me3, and RNA Pol II data sets from S2 cells and observed in general a good, qualitative agreement with our wing disc data in terms of cluster type and gene composition (Supplemental Fig. S6A,B; Kharchenko et al. 2011). In addition, we determined the overlap with previously defined chromatin states (Filion et al. 2010) by calculating the percentage of genes in each cluster covered by each of the “chromatin colors.” The resulting data (for an extended discussion, see Supplemental Fig. S6C) are in line with expectations, further validating our clustering approach. For example, clusters 4 and 5 contain the highest number of “blue” (Polycomb)-labeled genes with a further distinction between the subclusters with or without “H3K27me3” in that a greater proportion of blue was observed in the “with” subclusters, consistent with the involvement of Polycomb in establishing this repressive mark (Cao et al. 2002; Czermin et al. 2002).
Next, we asked if a particular chromatin state is enriched for functionally relevant TFs as measured by the capability to induce phenotypes upon (mis)expression. Clusters 1, 2, and 3, which represent constitutively and highly transcribed (“housekeeping”) genes, are depleted for such TFs. Furthermore, the few TFs that are contained within these clusters do not induce strong phenotypes upon misexpression in the wing. In contrast, we observed a strong relationship between phenotypic strength and the bivalent nature of the chromatin state surrounding the TF-coding genes in that both clusters 4b and 5b are significantly enriched for TFs that induced strong wing phenotypes or even lethality (Table 2). These data suggest that genes associated with bivalently labeled genomic elements tend to be functionally relevant for wing development (Fig. 4).
Figure 4.
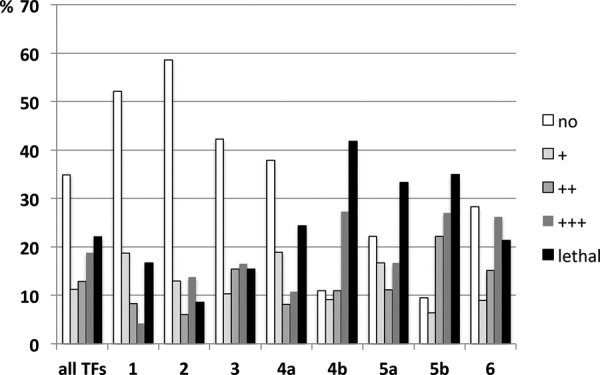
Distribution of phenotypes induced by TFs in the different clusters. The chart illustrates the distribution of phenotypes caused by misexpression of all TFs and from each cluster (c1–c6, x-axis) by MS1096-Gal4 in the wing.
Finally, we compared our wing disc–specific chromatin mark ChIP-seq data to similar data published by the modENCODE Consortium using entire larvae (Oregon strain) and also at the third instar stage (Nègre et al. 2011). We specifically observed clear histone modification enrichment differences in several chromosomal regions containing bivalently marked genes (e.g., ara and caup) (Supplemental Fig. S7A) that are expressed in the wing disc or in regions containing genes that are repressed in the wing (e.g., Ubx-abd-A cluster) (Supplemental Fig. S7B). For example, compared to the modENCODE Consortium data, we found a greater enrichment of activating marks for bivalent, but actively transcribed, genes in cluster 4b (Supplemental Fig. S7A,C,D). In contrast, we found that these activating marks are virtually absent from regions containing repressed wing genes, whereas this is not the case in the modENCODE Consortium data (Supplemental Fig. S7B), implying signal contribution from other imaginal disc types. These observations reemphasize the functional importance of bivalently marked genes, given that they appear to be transcriptionally controlled in an intricate wing disc–specific manner.
Cell autonomy of bivalent marks
The observation of bivalently marked chromatin may stem from two intriguing scenarios. These bivalent marks (activating and repressing) could be present cell-autonomously, i.e., within individual cells on individual genes. Alternatively, the different marks could be derived from separate cell populations within the disc. In this scenario, a specific gene would be expressed in a cluster of wing disc cells and therefore display activating marks, while it is repressed in other cells of the disc and would display repressive marks in these cells. Since the ChIPed material was isolated from entire discs, the resulting pattern would show activating and repressing marks as an average over the entire cell population. Given that H3K27me3 enrichment and transcriptional elongation (as evidenced by the enrichment of RNA Pol II in gene bodies of cluster 4) are considered incompatible (Schmitges et al. 2011; Voigt et al. 2013), the presence of heterogeneous cell populations within the disc appears the most likely scenario. To validate this hypothesis, we used three microarray expression data sets that were collected from wing disc samples. The first data set contains genes that showed at least a twofold enrichment in either the body wall or the hinge and wing blade region (BW/WB) of the disc (Butler et al. 2003). The other two data sets were collected by microarray expression analysis of anterior and posterior (A/P) wing disc cells in our own laboratory (N Simigdala, unpubl.) or by others (Ibrahim et al. 2013). Of all genes in clusters 4b and 5b combined, 12.4% (54/435) showed a compartmentally restricted expression pattern, which is about fivefold higher than for all remaining genes (2.6%, 373/14,505) (Table 3). The effect is even more pronounced for bivalently labeled TFs, where the enrichment in clusters 4b and 5b is 10-fold greater (25% [40/160] vs. 2.4% [14/595]). This strongly suggests that the bivalent marks for these genes derive from distinct expression domains within the wing disc. However, there are also a large number of bivalently marked genes that are not expressed in a spatially restricted way. These genes may either have expression patterns in subsets of wing disc cells that were not captured by the available data sets or carry both marks in a cell-autonomous fashion. Irrespective of the cell autonomy of these marks, our data suggest that bivalent chromatin is a hallmark of genes that are highly relevant for wing development.
Discussion
TF library and phenotypic analysis
We present an in vivo resource to systematically study TF function by misexpression in Drosophila. The number of phenotypes and the strength of the observed phenotypes are significantly greater than for previously analyzed gene sets that did not include TFs. This is not surprising since TFs typically regulate many target genes, and the number of genes targeted in a particular condition is strongly dependent on the nuclear abundance of the TF (Biggin 2011; Simicevic et al. 2013). Thus, the induction of a particular TF likely significantly affects its DNA binding and gene regulatory activity, resulting in the subsequent misexpression of dozens or even hundreds of genes.
A comparison with other large-scale data sets provided several important molecular insights. For example, we observed a bias in the capability of phenotype induction by misexpression of TFs toward those that are lowly transcribed in the wing disc. This implies that elevating the abundance of already highly expressed TFs tends to have little impact. There are exceptions to this rule, however, suggesting that the occupancy of these specific TFs on target DNA binding sites may not be saturated under physiological conditions. This view is consistent with the notion that accessible DNA sites compete with one another for TF binding, resulting in increased binding upon increasing TF levels (Janssen et al. 2000; Simicevic et al. 2013). TF misexpression may thus allow a comprehensive characterization of the genome-wide DNA binding potential of TFs. Another insight is the relatively low correlation between knockdown and misexpression phenotypes. Underlying reasons may include (1) misexpression-related activating or inhibiting effects such as dominant-negative phenotypes, (2) the disruption of a multimeric protein complex or changing the abundance of interacting proteins (Prelich 2012), (3) loss-of-function effects caused by the C-terminal HA-tag (Bischof et al. 2013), and (4) RNAi-related artifacts such as off-target effects or nonfunctional RNAi constructs, which for the Vienna RNAi lines has been estimated up to 40% (Dietzl et al. 2007). Misexpression-only phenotypes could additionally be due to the low endogenous expression of the respective TF in the wing (this is true for at least seven TFs according to our RNA Pol II data) or redundant activity with other TFs. One example for the latter involves dl and Dif, two NFkB homologs that cause lethality upon misexpression but fail to induce a knockdown phenotype and have an established redundant role in immunity (Matova and Anderson 2006). Nevertheless, TFs that show both misexpression and knockdown phenotypes are likely of highest biological interest. We found 25 such TFs that have never been characterized before and are currently only annotated by a CG number (Supplemental Table S1). Thus, these genes represent interesting candidates with potentially important roles in wing development.
In summary, our analysis provides an initial phenotypic characterization of 594 Drosophila TFs. We identified many TFs that induce highly specific phenotypes in the wing. The observed effects are quantitatively and qualitatively more pronounced than RNAi-mediated knockdown, indicating that misexpression is a powerful alternative to characterize gene function.
Functional relevance of bivalently marked genes
Our histone modification ChIP-seq analyses revealed many genes that display both activating and repressive chromatin marks. Our data suggest that at least some of these bivalent states derive from spatially separated expression domains within the wing disc. The underlying chromatin regions are therefore not bivalent sensu stricto. Genes whose expression is restricted to certain areas but do not appear to have bivalent marks might be regulated by different mechanisms, e.g., by region-specific transcriptional activators or repressors (Davidson and Levine 2008). Conversely, for a number of genes that display bivalent marks, there is no evidence that they are expressed in the wing disc in a spatially distinct fashion. It therefore cannot be excluded that these genes may carry genuine bivalent marks within individual cells, similar to those genes that were identified in distinct mouse and human cell lines using sequential ChIP-seq experiments (Voigt et al. 2012). The fact that we also observed bivalent gene clusters in S2 cells may lend credibility to the latter hypothesis, but since S2 cells are nonclonal (Schneider 1972), it is also possible that such bivalency stems from cell population heterogeneity. However, additional in-depth experiments will be required to unequivocally establish the existence of bivalent chromatin in Drosophila.
We also found many genes that are enriched for both H3K4me1 and H3K27me3 across their genomic loci. Such a chromatin signature was, as already indicated, first discovered in human ESCs and subsequently confirmed in mouse ESCs (Bajpai et al. 2010; Zentner et al. 2011). Since such bivalently marked regions were mostly found at distal loci of genes that are inactive in ESCs but become transcribed during ESC differentiation, these regions are thought to correspond to poised enhancers. In Drosophila, such bivalently marked enhancers were recently found in the developing mesoderm (Bonn et al. 2012), yet their transcriptional importance in this tissue is unclear as these enhancers were found to be mostly repressed instead of poised. Thus, similar to bivalent chromatin on genes, the functional relevance of bivalent chromatin on enhancers remains poorly understood. An important outcome of our study in this regard is that chromatin bivalency constitutes an interesting and novel criterion next to more obvious measures such as high, system-specific, or developmentally dynamic expression to identify genes that may have a key role in tissue development. Three lines of evidence support this claim for wing development: (1) Bivalently marked genes are enriched for the GO term “imaginal disc development”; (2) TFs cause significantly more and stronger phenotypes when encoded by bivalently compared with nonbivalently marked genes; and (3) many genes and especially TF-coding ones that display bivalent marks show spatially restricted expression in the wing disc, indicating functional relevance during development. Thus, our data support the notion that bivalent chromatin is a hallmark of TF-coding genes with important regulatory roles in a developing organ such as the wing, thereby providing novel insights into the biology of its development.
Methods
Transgene cloning and transgenesis
A detailed description of the transgene production can be found in Bischof et al. (2013). Expression plasmids were generated from our own TF ORF collection by Gateway cloning (Hens et al. 2011). Subsequently, UAS-TF expression plasmids were pooled and injected, and the progeny was clonally crossed to balancer lines to establish individual stocks. Transgenes were identified by Sanger sequencing of the respective barcode in standardized PCRs. All transgenic lines created in this study are publicly available through our website (www.flyorf.ch).
Tester strain for ChIP-seq and RNA-seq
A spalt major (salm) enhancer fragment (4.8 kb from pLB4-1 [data not shown], a brief description can be found in FlyBase: FBrf0211371) was digested with EcoRI, introduced in pEGFP.attB (Bischof et al. 2013), and tested for correct orientation. The resulting construct was injected into strain ΦX-86Fb, and a homozygous salmE-eGFP strain was established. The transgene salmE-eGFP was subsequently recombined with C765-Gal4, Gal80ts, both present on the third chromosome.
Mass isolation of wing discs
Virgins of yw;; C765-Gal4 tubGal80ts salmE-eGFP were crossed to the UAS-TF strains and kept for 7 d at 21°C. Larvae were shifted to 29°C 13 h prior to harvest. Five milliliters of wandering L3 larvae was used for mass isolation of wing discs. We adapted a recently published protocol (Marty et al. 2014). Five milliliters of larvae were disrupted using the gentleMACS dissociator (Milteny). The disrupted material was crosslinked in 1% formaldehyde for 10 min at room temperature. Crosslinking was stopped and formaldehyde quenched with 125 mM glycine for 5 min and washed two times in PBS (PBS Dulbecco, L 182-50; Biochrom AG). The material was separated by a gradient of 10% Ficoll (Ficoll PM 400, 17 0300 50; GE Healthcare) as the upper phase, 20% Ficoll as the middle phase, and 30% Ficoll as the lower phase. The duration of the gradient centrifugation was 20 min at 5000 rpm. The discs were enriched at the interphase between 10% and 20%. Imaginal discs were washed once with PBS to clean them from residual Ficoll. All Ficoll solutions were made with PBS.
Sorting of wing discs
Mass-isolated wing discs were sorted from the rest of the organs by using criteria for the density and the fluorescence intensity of the wing disc (BioSorter, Union Biometrica). Wing discs were sorted based on fluorescence intensity (1500–30,000 green peak height) and counter-sorted according to autofluorescence. Green PMT voltage was set to 450, sort delay to 25 (mS), and drop width to 10 (mS). The sorting mode was set to enrichment, and the wing disc recovery rate was typically 90% of the input material. Residual contaminants were manually removed from the sample. Discs were frozen in batches of 1000 discs. Usually, mass isolation of 5 mL of larvae yielded 1000 to 1500 discs.
ChIP-seq and library preparation
The ChIP protocol was adapted from Weinmann and Farnham (2002). Briefly, crosslinking was performed during the mass isolation (see section “Mass Isolation of Wing Discs”). Wing discs were resuspended in cell lysis buffer (5 mM PIPES at pH 8.0, 85 mM KCl, 0.5% NP-40, protease inhibitors), snap frozen in liquid nitrogen, and kept at −80°C. Prior to ChIP, wing discs were thawed on ice; cell lysis buffer was removed; and the discs were resuspended in 200 µL nuclear lysis buffer (50 mM Tris-Cl at pH 8.1, 10 mM EDTA, 1% SDS, protease inhibitors) and transferred into two sonication vials (microTUBE, 520045, Covaris). The chromatin was fragmented using the Covaris S220 (duty cycle, 10%; intensity, 5; cycles/burst, 200; time, 40 sec) to an average size of 500 bp. Afterward, 200 µL was pooled, insoluble material was removed by centrifugation, and soluble chromatin extract was used for IP. Two hundred microliters of IP dilution buffer (0.01% SDS, 1.1% Triton X-100, 1.2 mM EDTA, 16.7 mM Tris-Cl at pH 8.1, 167 mM NaCl, protease inhibitors) and the indicated antibodies were added to the chromatin and incubated overnight at 4°C. IP was performed by adding 60 µL magnetic beads (MagnaChIP Protein A and G, 16-663, Millipore) that were washed once in nuclear lysis buffer:IP dilution buffer (Nu:IP; 1:1) to the chromatin. The mix was incubated for 2 h on a rotating wheel. Samples were washed four times for 3 min using 1 mL of IP wash buffer (100 mM Tris-Cl at pH 8.0, 500 mM LiCl, 1% NP-40, 1% deoxycholic acid, protease inhibitors). For elution and crosslink reversal, the beads were resuspended in 50 µL of Nu:IP containing 20 µg RNase A, and incubated at 65°C for at least 4 h. Following, 40 µg Proteinase K was added, and samples were kept at 45°C for 2 h. DNA was purified using the MinElute PCR purification kit (28004, Qiagen). DNA was eluted in 24 µL H2O. Concentration was measured from 4 µL by Qubit using the dsDNA HS assay kit. Libraries were prepared using the Illumina TruSeq ChIP sample prep kit (IP-202-1012, Illumina). Libraries were sequenced on an Illumina HiSeq 2500 machine at the Lausanne Genomics Technologies Facility (GTF), obtaining more than 200 million 100-bp reads per sequenced lane.
The following antibodies (Abcam) were used in this study: ab6002, anti-Histone H3 (tri methyl K27); ab28940, anti-Histone H3 (mono+di+tri methyl K79); ab8895, anti-Histone H3 (mono methyl K4); ab6000, anti-Histone H3 (di+tri methyl K4); ab4729, anti-Histone H3 (acetyl K27) antibody; a mix of ab5408 (phospho S5 antibody 4H8) and ab817 (antibody 8WG16), anti RNA-polymerase II-CTD repeat YSPTSPS of Pol II largest subunit (RPB1); ab9110, anti-HA (used for Pangolin ChIP).
qRT-PCR
Flies carrying the transgenic TF of interest were crossed to yw;C765-Gal4 tubGal80ts salm-eGFP/TM6b. Flies were kept at 21°C until 24 h before dissection, when they were shifted to 29°C to induce transgene expression. RNA was isolated from 2 × 30–40 wing discs and purified using the RNA XS kit (NucleoSpin RNA XS, 740902.10, Machery-Nagel). Five hundred nanograms of RNA was reverse transcribed into cDNA according to the manufacturer's guidelines (first strand cDNA synthesis kit for RT-PCR, 11483188001, Roche) using Oligo-p(dT)15 primer. cDNA was directly used as template for qRT-PCR using the ABI SYBR green system. Transcript levels were normalized to act, tub, and Tbp.
The following gene-specific primer sequences were used:
Tub for: GCCAGATGCCGTCTGACAA
Tub rev: AGTCTCGCTGAAGAAGGTGTTGA
Act for: GCCCATCTACGAGGGTTATGC
Act rev: AATCGCGACCAGCCAGATC
TBP for: CGCGCATCATCCAAAAGC
TBP rev: GCCGACCATGTTTTGAATCTTAA
Hid for: TCTACGAGTGGGTCAGGATGT
Hid rev: GCGGATACTGGAAGATTTGC
Rpr for: TCGATTTCTACTGCAGTCAAGG
Rpr rev: GAGTAAACTAAAATTGGGTGGGTGT
Omb for: GCGAAGGGCTTTCGTGATAC
Omb rev: GACCCTCGGTTCGACATCAG
Data analysis
Peak calling
Bowtie 2 (version 2.0.0-beta6) (Langmead and Salzberg 2012) was used to align the sequencing reads using default parameters. The BDGP5.66 Drosophila genome annotation version was used as reference. The program makeUCSCfile from HOMER (Heinz et al. 2010) was used to produce visualization files in bedGraph format. BedGraph files were normalized to 10 million tags (HOMER default parameters). The program findPeaks from the HOMER package was used to identify regions enriched for histone modification marks, and data from a H3 ChIP-seq experiment were used as a control. RNA Pol II ChIP was analyzed using HOMER and findPeaks, and tags from the total input DNA sample were used as control. The findPeaks option called region was set to 500 bp for all the histone modification marks and RNA Pol II, except for H3K27me3, for which the region was set to 5000 bp. To determine the distribution of chromatin marks near the TSS, the program annotatePeaks (HOMER) in hist mode was used, and the average tag coverage 1000 bp upstream of and downstream from the TSS was calculated using a resolution of 10 bp.
Gene cluster analysis
Clustering of chromatin marks and RNA Pol II profiles was performed using seqMINER (Ye et al. 2011). The gene profile analysis covered the gene body and 2000 bp upstream and downstream with the latter regions being considered gene-proximal. Gene body sizes were normalized and divided into 100 bins, and the upstream and downstream parts were divided into 20 bins each. The k-means ranked method was used to find the clusters. The number of clusters was set to eight (k = 8). seqMINER produced eight clusters, three of which did not show enrichment for any of the chromatin marks. These three clusters were joined to form cluster 6. To identify genes specially enriched for H3K27me3 in clusters 4 and 5, we first selected the H3K27me3-enriched regions obtained using HOMER, after which we explored the overlap of H3K27me3-enriched regions with genes in clusters 4 and 5. The genes whose TSS overlapped these H3K27me3-enriched regions were finally grouped separately in clusters 4b and 5b, respectively.
Chromatin mark and RNA Pol II correlation analysis
To generate the heat map representing the linear Pearson correlation among tag densities of chromatin marks and RNA Pol II, regions enriched for chromatin marks or for RNA Pol II were split into 100-bp bins, after which the number of tags in each bin was calculated using HOMER. Chromatin mark tag density was normalized using H3 and RNA Pol II tag density with an input DNA sample. The Pearson linear correlation was then calculated among log2 ratio enrichment profiles for all pairs of chromatin marks and RNA Pol II (one pseudo tag was added to avoid zero values).
RNA Pol II and RNA-seq correlation analysis
To determine the extent of correlation between the RNA Pol II ChIP-seq and RNA-seq data, the RNA Pol II ChIP-seq tags at, respectively, the promoter (250 bp upstream of and 250 bp downstream from the TSS) and along the gene body (250 bp downstream from the TSS to 250 bp upstream of the transcription end site [TES]) were counted using HOMER. Tag counts from a total DNA sequenced sample were used for normalization. RNA Pol II and RNA-seq data were then transformed using log2 and quantile normalization (one pseudo tag was added to avoid zero values).
H3K4me1 genomic distribution analysis
The cis-regulatory element annotation system (CEAS) (Shin et al. 2009) was used to estimate the relative enrichment of H3K4me1 in each gene feature in relation to the whole genome. CEAS also provides a summary report showing a pie chart of how H3K4me1-enriched regions distribute over specific gene-related categories.
General statistics
Fisher's exact test, as implemented in R (R Development Core Team 2014), was used to determine the significance of proportional differences in phenotype strength upon misexpression or knockdown for distinct functional categories.
Data access
The ChIP-seq data from this study have been submitted to the NCBI Gene Expression Omnibus (GEO; http://www.ncbi.nlm.nih.gov/geo/) under accession number GSE59769. Accession numbers for the individual chromatin marks are as follows: GSM1446260 (H3K4me1), GSM1446261 (H3K4me2-3), GSM1446262 (H3K27me3), GSM1446263 (H3K27ac), and GSM1446264 (H3K79me1-2-3). The accession number for RNA Pol II is GSM1446265.
Supplementary Material
Acknowledgments
We thank Edy Furger, Nellcia Wang, and Jean-Daniel Feuz for technical assistance; the Lausanne Genomic Technologies Facility (GTF) and VITAL-IT for, respectively, sequencing and server support; and George Hausmann for critical reading and suggestions on the manuscript. This work was supported by a Sinergia grant (no. CRSI33_127485) of the Swiss National Science Foundation and by Institutional Support from the Ecole Polytechnique Federale de Lausanne (EPFL).
Footnotes
[Supplemental material is available for this article.]
Article published online before print. Article, supplemental material, and publication date are at http://www.genome.org/cgi/doi/10.1101/gr.181305.114.
References
- Adryan B, Teichmann SA. 2006. FlyTF: a systematic review of site-specific transcription factors in the fruit fly Drosophila melanogaster. Bioinformatics 22: 1532–1533. [DOI] [PubMed] [Google Scholar]
- Arnold CD, Gerlach D, Stelzer C, Boryń ŁM, Rath M, Stark A. 2013. Genome-wide quantitative enhancer activity maps identified by STARR-seq. Science 339: 1074–1077. [DOI] [PubMed] [Google Scholar]
- Bajpai R, Chen DA, Rada-Iglesias A, Zhang J, Xiong Y, Helms J, Chang C-P, Zhao Y, Swigut T, Wysocka J. 2010. CHD7 cooperates with PBAF to control multipotent neural crest formation. Nature 463: 958–962. [DOI] [PMC free article] [PubMed] [Google Scholar]
- Bernstein BE, Mikkelsen TS, Xie X, Kamal M, Huebert DJ, Cuff J, Fry B, Meissner A, Wernig M, Plath K, et al. 2006. A bivalent chromatin structure marks key developmental genes in embryonic stem cells. Cell 125: 315–326. [DOI] [PubMed] [Google Scholar]
- Biggin MD. 2011. Animal transcription networks as highly connected, quantitative continua. Dev Cell 21: 611–626. [DOI] [PubMed] [Google Scholar]
- Bischof J, Maeda RK, Hediger M, Karch F, Basler K. 2007. An optimized transgenesis system for Drosophila using germ-line-specific phiC31 integrases. Proc Natl Acad Sci 104: 3312–3317. [DOI] [PMC free article] [PubMed] [Google Scholar]
- Bischof J, Björklund M, Furger E, Schertel C, Taipale J, Basler K. 2013. A versatile platform for creating a comprehensive UAS-ORFeome library in Drosophila. Development 140: 2434–2442. [DOI] [PubMed] [Google Scholar]
- Björklund M, Taipale M, Varjosalo M, Saharinen J, Lahdenperä J, Taipale J. 2006. Identification of pathways regulating cell size and cell-cycle progression by RNAi. Nature 439: 1009–1013. [DOI] [PubMed] [Google Scholar]
- Bonn S, Zinzen RP, Girardot C, Gustafson EH, Perez-Gonzalez A, Delhomme N, Ghavi-Helm Y, Wilczyński B, Riddell A, Furlong EEM. 2012. Tissue-specific analysis of chromatin state identifies temporal signatures of enhancer activity during embryonic development. Nat Genet 44: 148–156. [DOI] [PubMed] [Google Scholar]
- Brand AH, Perrimon N. 1993. Targeted gene expression as a means of altering cell fates and generating dominant phenotypes. Development 118: 401–415. [DOI] [PubMed] [Google Scholar]
- Butler MJ, Jacobsen TL, Cain DM, Jarman MG, Hubank M, Whittle JRS, Phillips R, Simcox A. 2003. Discovery of genes with highly restricted expression patterns in the Drosophila wing disc using DNA oligonucleotide microarrays. Development 130: 659–670. [DOI] [PubMed] [Google Scholar]
- Cao R, Wang L, Wang H, Xia L, Erdjument-Bromage H, Tempst P, Jones RS, Zhang Y. 2002. Role of histone H3 lysine 27 methylation in Polycomb-group silencing. Science 298: 1039–1043. [DOI] [PubMed] [Google Scholar]
- Capdevila J, Guerrero I. 1994. Targeted expression of the signaling molecule decapentaplegic induces pattern duplications and growth alterations in Drosophila wings. EMBO J 13: 4459–4468. [DOI] [PMC free article] [PubMed] [Google Scholar]
- Czermin B, Melfi R, McCabe D, Seitz V, Imhof A, Pirrotta V. 2002. Drosophila enhancer of Zeste/ESC complexes have a histone H3 methyltransferase activity that marks chromosomal Polycomb sites. Cell 111: 185–196. [DOI] [PubMed] [Google Scholar]
- Davidson EH. 2006. The regulatory genome: gene regulatory networks in development and evolution. Academic Press, San Diego. [Google Scholar]
- Davidson EH, Levine MS. 2008. Properties of developmental gene regulatory networks. Proc Natl Acad Sci 105: 20063–20066. [DOI] [PMC free article] [PubMed] [Google Scholar]
- Deplancke B. 2009. Experimental advances in the characterization of metazoan gene regulatory networks. Brief Funct Genomic Proteomic 8: 12–27. [DOI] [PubMed] [Google Scholar]
- Dietzl G, Chen D, Schnorrer F, Su K-C, Barinova Y, Fellner M, Gasser B, Kinsey K, Oppel S, Scheiblauer S, et al. 2007. A genome-wide transgenic RNAi library for conditional gene inactivation in Drosophila. Nature 448: 151–156. [DOI] [PubMed] [Google Scholar]
- Filion GJ, van Bemmel JG, Braunschweig U, Talhout W, Kind J, Ward LD, Brugman W, de Castro IJ, Kerkhoven RM, Bussemaker HJ, et al. 2010. Systematic protein location mapping reveals five principal chromatin types in Drosophila cells. Cell 143: 212–224. [DOI] [PMC free article] [PubMed] [Google Scholar]
- Hammonds AS, Bristow CA, Fisher WW, Weiszmann R, Wu S, Hartenstein V, Kellis M, Yu B, Frise E, Celniker SE. 2013. Spatial expression of transcription factors in Drosophila embryonic organ development. Genome Biol 14: R140. [DOI] [PMC free article] [PubMed] [Google Scholar]
- Heinz S, Benner C, Spann N, Bertolino E, Lin YC, Laslo P, Cheng JX, Murre C, Singh H, Glass CK. 2010. Simple combinations of lineage-determining transcription factors prime cis-regulatory elements required for macrophage and B cell identities. Mol Cell 38: 576–589. [DOI] [PMC free article] [PubMed] [Google Scholar]
- Hens K, Feuz J-D, Isakova A, Iagovitina A, Massouras A, Bryois J, Callaerts P, Celniker SE, Deplancke B. 2011. Automated protein–DNA interaction screening of Drosophila regulatory elements. Nat Methods 8: 1065–1070. [DOI] [PMC free article] [PubMed] [Google Scholar]
- Ibrahim DM, Biehs B, Kornberg TB, Klebes A. 2013. Microarray comparison of anterior and posterior Drosophila wing imaginal disc cells identifies novel wing genes. G3 (Bethesda) 3: 1353–1362. [DOI] [PMC free article] [PubMed] [Google Scholar]
- Janssen S, Cuvier O, Müller M, Laemmli UK. 2000. Specific gain- and loss-of-function phenotypes induced by satellite-specific DNA-binding drugs fed to Drosophila melanogaster. Mol Cell 6: 1013–1024. [DOI] [PubMed] [Google Scholar]
- Kharchenko PV, Alekseyenko AA, Schwartz YB, Minoda A, Riddle NC, Ernst J, Sabo PJ, Larschan E, Gorchakov AA, Gu T, et al. 2011. Comprehensive analysis of the chromatin landscape in Drosophila melanogaster. Nature 471: 480–485. [DOI] [PMC free article] [PubMed] [Google Scholar]
- Langmead B, Salzberg SL. 2012. Fast gapped-read alignment with Bowtie 2. Nat Methods 9: 357–359. [DOI] [PMC free article] [PubMed] [Google Scholar]
- Lunde K, Biehs B, Nauber U, Bier E. 1998. The knirps and knirps-related genes organize development of the second wing vein in Drosophila. Development 125: 4145–4154. [DOI] [PubMed] [Google Scholar]
- Marquez RM, Singer MA, Takaesu NT, Waldrip WR, Kraytsberg Y, Newfeld SJ. 2001. Transgenic analysis of the Smad family of TGFβ signal transducers in Drosophila melanogaster suggests new roles and new interactions between family members. Genetics 157: 1639–1648. [DOI] [PMC free article] [PubMed] [Google Scholar]
- Marty F, Rockel-Bauer C, Simigdala N, Brunner E, Basler K. 2014. Large-scale imaginal disc sorting: a protocol for “omics”-approaches. Methods 68: 260–264. [DOI] [PubMed] [Google Scholar]
- Matova N, Anderson KV. 2006. Rel/NF-κB double mutants reveal that cellular immunity is central to Drosophila host defense. Proc Natl Acad Sci 103: 16424–16429. [DOI] [PMC free article] [PubMed] [Google Scholar]
- McKay DJ, Lieb JD. 2013. A common set of DNA regulatory elements shapes Drosophila appendages. Dev Cell 27: 306–318. [DOI] [PMC free article] [PubMed] [Google Scholar]
- Miklos GL, Rubin GM. 1996. The role of the genome project in determining gene function: insights from model organisms. Cell 86: 521–529. [DOI] [PubMed] [Google Scholar]
- The modENCODE Consortium, Roy S, Ernst J, Kharchenko PV, Kheradpour P, Negre N, Eaton ML, Landolin JM, Bristow CA, Ma L, et al. 2010. Identification of functional elements and regulatory circuits by Drosophila modENCODE. Science 330: 1787–1797. [DOI] [PMC free article] [PubMed] [Google Scholar]
- Molnar C, Casado M, López-Varea A, Cruz C, de Celis JF. 2012. Genetic annotation of gain-of-function screens using RNA interference and in situ hybridization of candidate genes in the Drosophila wing. Genetics 192: 741–752. [DOI] [PMC free article] [PubMed] [Google Scholar]
- Muse GW, Gilchrist DA, Nechaev S, Shah R, Parker JS, Grissom SF, Zeitlinger J, Adelman K. 2007. RNA polymerase is poised for activation across the genome. Nat Genet 39: 1507–1511. [DOI] [PMC free article] [PubMed] [Google Scholar]
- Nègre N, Brown CD, Ma L, Bristow CA, Miller SW, Wagner U, Kheradpour P, Eaton ML, Loriaux P, Sealfon R, et al. 2011. A cis-regulatory map of the Drosophila genome. Nature 471: 527–531. [DOI] [PMC free article] [PubMed] [Google Scholar]
- Neumann CJ, Cohen SM. 1996. Distinct mitogenic and cell fate specification functions of wingless in different regions of the wing. Development 122: 1781–1789. [DOI] [PubMed] [Google Scholar]
- Posadas DM, Carthew RW. 2014. MicroRNAs and their roles in developmental canalization. Curr Opin Genet Dev 27C: 1–6. [DOI] [PMC free article] [PubMed] [Google Scholar]
- Prelich G. 2012. Gene overexpression: uses, mechanisms, and interpretation. Genetics 190: 841–854. [DOI] [PMC free article] [PubMed] [Google Scholar]
- R Development Core Team. 2014. R: a language and environment for statistical computing. R Foundation for Statistical Computing, Vienna, Austria: http://www.R-project.org. [Google Scholar]
- Schertel C, Rutishauser T, Förstemann K, Basler K. 2012. Functional characterization of Drosophila microRNAs by a novel in vivo library. Genetics 192: 1543–1552. [DOI] [PMC free article] [PubMed] [Google Scholar]
- Schertel C, Huang D, Björklund M, Bischof J, Yin D, Li R, Wu Y, Zeng R, Wu J, Taipale J, et al. 2013. Systematic screening of a Drosophila ORF library in vivo uncovers Wnt/Wg pathway components. Dev Cell 25: 207–219. [DOI] [PubMed] [Google Scholar]
- Schmitges FW, Prusty AB, Faty M, Stützer A, Lingaraju GM, Aiwazian J, Sack R, Hess D, Li L, Zhou S, et al. 2011. Histone methylation by PRC2 is inhibited by active chromatin marks. Mol Cell 42: 330–341. [DOI] [PubMed] [Google Scholar]
- Schneider I. 1972. Cell lines derived from late embryonic stages of Drosophila melanogaster. J Embryol Exp Morphol 27: 353–365. [PubMed] [Google Scholar]
- Selbach M, Schwanhäusser B, Thierfelder N, Fang Z, Khanin R, Rajewsky N. 2008. Widespread changes in protein synthesis induced by microRNAs. Nature 455: 58–63. [DOI] [PubMed] [Google Scholar]
- Shin H, Liu T, Manrai AK, Liu XS. 2009. CEAS: cis-regulatory element annotation system. Bioinformatics 25: 2605–2606. [DOI] [PubMed] [Google Scholar]
- Shlyueva D, Stampfel G, Stark A. 2014. Transcriptional enhancers: from properties to genome-wide predictions. Nat Rev Genet 15: 272–286. [DOI] [PubMed] [Google Scholar]
- Simicevic J, Schmid AW, Gilardoni PA, Zoller B, Raghav SK, Krier I, Gubelmann C, Lisacek F, Naef F, Moniatte M, et al. 2013. Absolute quantification of transcription factors during cellular differentiation using multiplexed targeted proteomics. Nat Methods 10: 570–576. [DOI] [PubMed] [Google Scholar]
- Tupler R, Perini G, Green MR. 2001. Expressing the human genome. Nature 409: 832–833. [DOI] [PubMed] [Google Scholar]
- Voigt P, LeRoy G, Drury WJ III, Zee BM, Son J, Beck DB, Young NL, Garcia BA, Reinberg D. 2012. Asymmetrically modified nucleosomes. Cell 151: 181–193. [DOI] [PMC free article] [PubMed] [Google Scholar]
- Voigt P, Tee W-W, Reinberg D. 2013. A double take on bivalent promoters. Genes Dev 27: 1318–1338. [DOI] [PMC free article] [PubMed] [Google Scholar]
- Weinmann AS, Farnham PJ. 2002. Identification of unknown target genes of human transcription factors using chromatin immunoprecipitation. Methods 26: 37–47. [DOI] [PubMed] [Google Scholar]
- Ye T, Krebs AR, Choukrallah M-A, Keime C, Plewniak F, Davidson I, Tora L. 2011. seqMINER: an integrated ChIP-seq data interpretation platform. Nucleic Acids Res 39: e35. [DOI] [PMC free article] [PubMed] [Google Scholar]
- Zeitlinger J, Stark A, Kellis M, Hong J-W, Nechaev S, Adelman K, Levine M, Young RA. 2007. RNA polymerase stalling at developmental control genes in the Drosophila melanogaster embryo. Nat Genet 39: 1512–1516. [DOI] [PMC free article] [PubMed] [Google Scholar]
- Zentner GE, Tesar PJ, Scacheri PC. 2011. Epigenetic signatures distinguish multiple classes of enhancers with distinct cellular functions. Genome Res 21: 1273–1283. [DOI] [PMC free article] [PubMed] [Google Scholar]
Associated Data
This section collects any data citations, data availability statements, or supplementary materials included in this article.