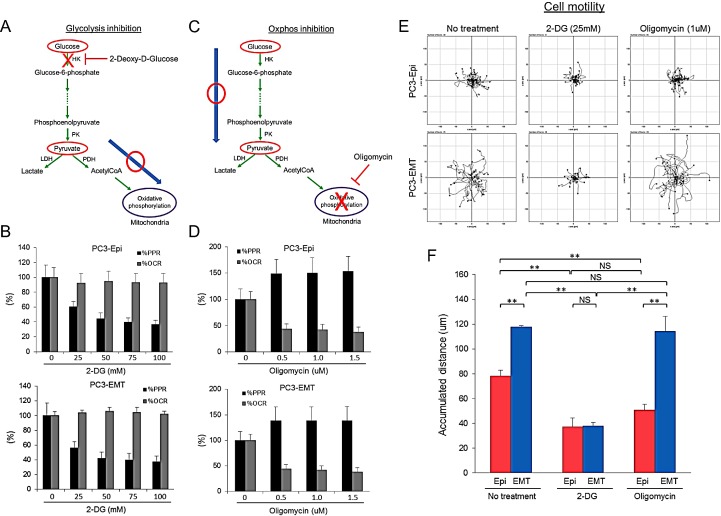
Figure 5. Inhibition of glycolysis, but not mitochondrial ATP synthesis, attenuates cell motility.
(A) Schema of the effect of 2-deoxy-D-glucose (2-DG) in the presence of pyruvate on glycolytic pathway and TCA cycle. 2-DG treatment in the presence of pyruvate blocks glycolysis without affecting mitochondrial respiration. (B) Effect of 2-DG on PPR and OCR in PC3-Epi (upper) and PC3-EMT (lower) cells. Data are represented as percent change of PPR and OCR compared to base line. (C) Schema of the effect of oligomycin on glycolytic pathway and TCA cycle. Oligomycin treatment blocks ATP synthesis in mitochondria while glycolytic pathway is not affected. (D) Effect of oligomycin on PPR and OCR in PC3-Epi (upper) and PC3-EMT (lower) cells. Data are represented as percent change of PPR and OCR compared to base line. PC3-Epi and PC3-EMT cells were cultured in XF minimal basal medium supplemented with 11mM glucose, 1mM sodium pyruvate and 1×GlutaMax (Invitrogen) in the presence or absence of 2-DG (25mM) or oligomycin (1uM). (E) Representative tracks of cell movements that were traced and visualized using Manual Tracking and Chemotaxis tool of ImageJ software every 15 min for 6 hrs. (n=38 and 25 for control, n=31 and 29 for 2-DG treatment and n=45 and 29 for oligomycin treatment in PC3-Epi and PC3-EMT cells, respectively.) (F) The accumulated distance analyzed by chemotaxis tool of ImageJ software. Data are represented as mean of triplicate experiments ± SD. **P<0.01. NS; not significant.

