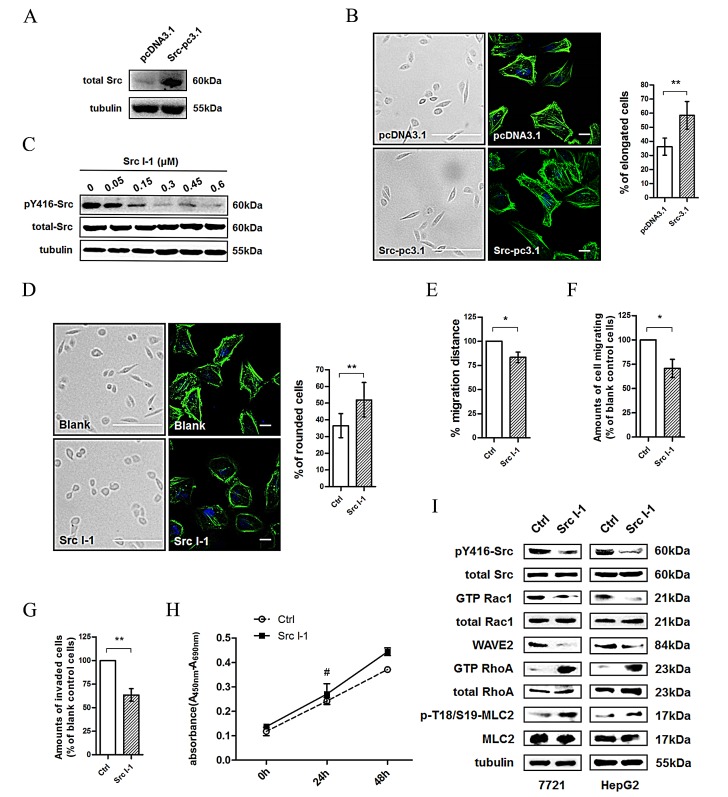
Fig.2. Src activity alteration leads to morphological and migratory activity changes in HCC cells.
(A) Src activity level (pY416-Src/total Src) was assessed using western blotting in pcDNA3.1 or Src-pc3.1 transfected 7721 cells. (B) Images (Scale bar = 500μm) and confocal microscopy images (Scale bar = 20μm) demonstrating the effect of Src overexpression on morphological changes in 7721 cells. Green: actin; Blue: DAPI. Left panel: representative image. Right panel: quantification. (C) Src activity was assessed using western blotting after treatment of 7721 cells with Src kinase inhibitor (Src I-1). (D) Images (Scale bar = 500μm) and confocal microscopy images (Scale bar = 20μm) demonstrating the effect of Src I-1 treatment on morphological changes in 7721 cells. Green: actin; Blue: DAPI. Left panel: representative image. Right panel: quantification. (E) Effects of Src I-1 treatment on cell motility of 7721 cells. (F) Effects of Src I-1 treatment on cell migration of 7721 cells. (G) Effects of Src I-1 treatment on cell invasion of 7721 cells. (H) Effects of Src I-1 treatment on cell proliferation of 7721 cells. (I) Src and Rac1 activities, WAVE2 expression, and RhoA and MLC2 activities were examined in 7721 and HepG2 cells treated with 300 nM of Src I-1. The bars represent each sample performed in triplicate, and the error bars indicate ± SD. ** P < 0.01, * P < 0.05, # P > 0.05, by t-test (B, D-G) and one-way ANOVA (H).

