Abstract
Introduction
The purpose of this research is to evaluate the prospects for the use of 4-(trans-18F-fluoranylmethyl)-N-[2-[4-(2-methoxyphenyl)piperazin-1-yl]ethyl]-N-pyridin-2-ylcyclohexane-1-carboxamide (18F-Mefway) in comparison to 18F-trans-4-fluoro-N-2-[4-(2-methoxyphenyl)piperazin-1-yl]ethyl]-N-(2-pyridyl)cyclohexanecarboxamide (18F-FCWAY) for the quantification of 5-HT1A receptors in human subjects.
Method
Five healthy male controls were included for two positron emission tomography (PET) studies: 18F-FCWAY PET after the pretreatment with 500 mg of disulfiram and two months later, 18F-Mefway PET without disulfiram. Regional time-activity curves (TACs) were extracted from nine cortical and subcortical regions in dynamic PET images. Using cerebellar cortex without vermis as reference tissue, in vivo kinetics for both radioligands were compared based on the distribution volume ratio (DVR) calculated by non-invasive Logan graphical analysis and area under the curve ratio of the TACs (AUC ratio).
Result
Although the pattern of regional uptakes in the 18F-Mefway PET was similar to that of the 18F-FCWAY PET (highest in the hippocampus and lowest in the cerebellar cortex), the amount of regional uptake in 18F-Mefway PET was almost half of that in 18F-FCWAY PET. The skull uptake in 18F-Mefway PET was only 25% of that in 18F-FCWAY PET with disulfiram pretreatment. The regional DVR values and AUC ratio values for 18F-Mefway were 17—40% lower than those of 18F-FCWAY. In contrast to a small overestimation of DVR values by AUC ratio values (< 10%) in 18F-FCWAY PET, the overestimation bias of AUC ratio values was much higher (up to 21%) in 18F-Mefway PET.
Conclusion
As 18F-Mefway showed lower DVR values and greater overestimation bias of AUC ratio values, 18F-Mefway may appear less favorable than 18F-FCWAY. However, in contrast to 18F-FCWAY, the resistance to in vivo defluorination of 18F-Mefway obviates the need for the use of a defluorination inhibitor. Thus, 18F-Mefway may be a good candidate PET radioligand for 5-HT1A receptor imaging in human.
Introduction
Serotonin 1A (5-hydroxytryptamine, 5-HT1A) receptors in the central nervous system belong to the G-protein coupled receptor family and play an important role in cognitive and emotional functions. Growing evidence demonstrates that the changes in 5-HT1A receptor binding has been strongly implicated in the etiology of mental illnesses such as depression [1,2], anxiety [3,4] and schizophrenia [5]. Thereby, the necessity of in vivo molecular imaging markers for 5-HT1A receptors has been increasingly recognized [6,7].
Many radioligands for positron emission tomography (PET) imaging of 5-HT1A receptors have been developed, the majority of which are structural analogues of N-[2-[4-(2-methoxyphenyl)-1-piperazinyl]ethyl]-N-2-pyridinylcyclohexanecarboxamide (WAY-100635), a 5-HT1A receptor antagonist with a highly selectivity and affinity [8]. Although extensive investigation has been performed to find effective PET radioligands in the last decades, only three radioligands are being used studies in human subjects: [11C]WAY-100635, 18F-trans-4-fluoro-N-2-[4-(2-methoxyphenyl)piperazin-1-yl]ethyl]-N-(2-pyridyl)cyclohexanecarboxamide (18F-FCWAY), and 4-18F-fluoranyl-N-[2-[4-(2-methoxyphenyl)piperazin-1-yl]ethyl]-N-pyridin-2-ylbenzamide (18F-MPPF).
The 11C-based radioligands have an intrinsic limitation for clinical studies because their short half-life of 20 min requires a expensive cyclotron in the proximity of PET imaging facilities. Besides these currently available 11C-labelled radioligands, 18F-FCWAY showed considerable defluorination in vivo [9,10] and 18F-MPPF was susceptible to P-glycoprotein (P-gp) [11,12]. In vivo defluorination hampers the exact quantification of 5-HT1A receptor binding in superficial brain areas due to contamination from radioactivity in the skull. This defluorination in humans can be ameliorated by the pre-administration of disulfiram, resulting in improved brain PET images. However, as the disulfiram is difficult to use in practice and potentially neurotoxic [13,14], there are limitations in widespread use of disulfiram for clinical study of 18F-FCWAY PET.
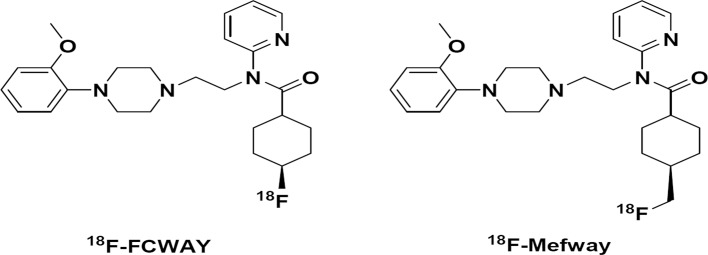
To overcome this defluorination problem, the Mukherjee group developed 4-(trans-18F-fluoranylmethyl)-N-[2-[4-(2-methoxyphenyl)piperazin-1-yl]ethyl]-N-pyridin-2-ylcyclohexane-1-carboxamide (18F-Mefway). This radiotracer extends the carbon bond on the cyclohexyl ring of 18F-FCWAY to strengthen metabolic stability in vivo (Fig. 1). 18F-Mefway showed high affinity to the 5-HT1A receptors, excellent target-to-reference ratio, high-quality 5-HT1A specific images in the rhesus monkey even without disulfiram and favorable characteristics in human subject including low test-retest variability[15–18]. Moreover, 18F-Mefway showed kinetic properties, whole-body biodistribution, and dosimetry similar to [carbonyl-11C]WAY-100635[17]. Thus, in the present study we evaluated 18F-Mefway for the quantification of 5-HT1A receptors in comparison with 18F-FCWAY in human subjects.
Fig 1. Chemical structures of 18F-FCWAY and 18F-Mefway.
Material and Methods
Ethic clearance
Five healthy male subjects (age = 27.6 ± 2.2 years) participated in this study. Participants were screened using self-report questionnaires, including the Social Interaction Anxiety Scale [19],Social Phobia Scale [19], Brief Version of the Fear of Negative Evaluation Scale [20], and Beck Depression Inventory [21]. All participants were medication-naïve and had no history of psychiatric disorder. Institutional Review Board of Gangnam Severance Hospital ethically approved this study. The individual in this study has given written informed consent.
Radiosynthesis
18F-FCWAY and 18F-Mefway were prepared as previously described [22,23]. Specific activities at the time of injection were 103.2 ± 38.3 and 117.8 ± 20.5 GBq/μmol, respectively. The radiochemical purities of these radioligands were greater than 99%.
Acquisition of images
All five subjects underwent two PET scans: first with 18F-FCWAY and second with 18F-Mefway. For 18F-FCWAY PET, 500 mg of oral disulfiram was administered at 24 hours before the PET scan to inhibit in vivo defluorination. Participants were instructed not to drink alcohol the day before and 14 days after taking disulfiram [24]. After two months, 18F-Mefway PET scans were performed without pretreatment with disulfiram. All brain PET images were acquired with an integrated PET with computed tomography (PET/CT) scanner (Biograph 40 TruePoint PET/CT, Siemens Healthcare, Knoxville, TN, USA). A head holder was applied to minimize head movement, and brain CT images were acquired for attenuation correction (120 KeV, 180 mAs, 3 mm of slice thickness, 512 x 512 x 110 matrix with 0.67 x 0.67 x 2 mm of voxel size). After the bolus injection of radiotracers for 1 minute (259.7 ± 23.7 MBq for 18F-FCWAY and 276.8 ± 29.2 MBq for 18F-Mefway), we acquired dynamic PET scans data for 2 hours. Then, 33 time frames (6 x 30 sec, 3 x 1 min, 2 x 2 min, and 22 x 5 min) of attenuation-corrected dynamic PET images were reconstructed in the same matrix and with same voxel size as the CT images by using the ordered-subsets expectation maximization (OSEM) algorithm (iteration = 6 and subset = 16). In all subjects, high resolution T1-weighted brain magnetic resonance (MR) images were acquired in 1.5 T MR scanner (Signa Horizon, GE Medical Systems, Milwaukee, WI, USA) by using a fast spoiled gradient echo sequence (matrix = 256 x 256 x 116 matrix, voxel size = 0.94 x 0.94 x 1.5 mm, repetition time = 8.5 ms, echo time = 1.8 ms, field of view = 240 mm, flip angle = 12o).
Preprocessing of PET images
For motion correction, dynamic PET images were realigned to mean PET images except first three time frames by sum of squared difference dissimilarity measure and Powell algorithm (PMOD 3.1 software, PMOD Technologies Ltd., Adliswil, Switzerland). T1-weighed MR images were corrected for inhomogeneity and segmented into gray matter, white matter and cerebrospinal fluid with statistical parametric mapping 8 (SPM8; The Wellcome Trust Centre for Neuroimaging, University College London, UK) implemented in MATLAB 8 (MathWorks, Natick, MA). The segments of gray and white matter were binarized with a threshold 0.5 to create whole brain mask, and skull-stripped MR images were created by overlaying the whole brain mask on inhomogeneity-corrected MR images. Mean PET images were coregistered to the skull-stripped MR images. The dynamic PET images were spatially normalized to template space by using the transformation parameter normalizing skull stripped MR images to the skull-stripped Montreal Neurologic Institute (MNI) MR template. Finally, time-activity curves (TACs) of seven cortical (frontal, parietal, occipital, temporal, insula, cingulate cortices, and hippocampus) and two subcortical (striatum and cerebellum) regions were obtained by overlaying template volumes of interest (VOI) modified from automated anatomical labeling (AAL) template. For the cerebellum, the vermis was excluded from VOI since this area contains small amount of 5-HT1A receptors [25]. The accumulation of radioactivity in skull caused by the partial-volume effect was evaluated. To obtain exact TAC of skull, individual cranial bone was extracted from CT image, and this mask for cranial bone was overlaid on individual PET images. Regional TACs were normalized for the body weight and administrated dose and converted to standardized uptake value (SUV) (radioactivity in kBq/cc x body weight in kg/injected dose in MBq).
Kinetic analysis for binding values
We used cerebellar cortex without cerebellar vermis as reference tissue to obtain regional binding values. By using Ichise’s multilinear reference tissue model (MRTM), individual k 2’ was obtained from TAC of combined region (hippocampus and insula) with fixed time for the linearization (t*) at 60 minute [26]. Then with these parameters, regional distribution volume ratio (DVR) values were calculated by using non-invasive Logan’s graphical analysis method [27]. Parametric DVR images were created for visualization with same parameters and model.
Using 60 to 100 minute data, we also calculated regional area under the curve of TAC (AUC) ratio (AUCtarget / AUCreference) with trapezoid method. Because the target-to-reference ratios show the plateau in this period.
Statistical analysis
The Mann-Whitney U test was used to compare the DVR values between two radiotracers. Pearson's correlation was used to determination of relationship between DVR and AUC ratio. All statistical analyses were performed with Prism 5 (ver. 5.04, GraphPad).
Results
Comparison of skull uptake
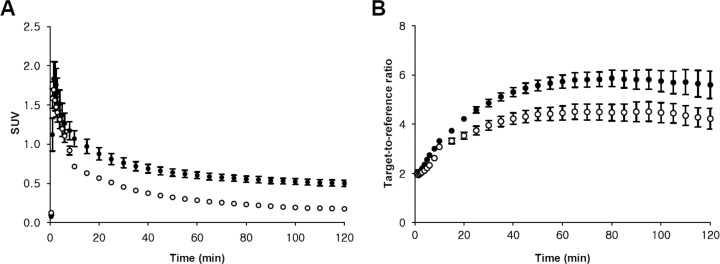
The uptake of radioactivity in bone including skull is due to the presence of the radioactive 18F-fluoride ions resulting from metabolism of the parent compounds. The degree of radiofluorination can be used in the indicator for metabolic stability in vivo. In 18F-FCWAY PET, skull uptake gradually increased to 1.44 ± 0.48 SUV at 30 minutes and decreased to 1.36 ± 0.40 SUV at 120 minutes. In contrast, the skull uptake of 18F-Mefway rapidly reached its peak at 1.5 minutes (1.04 ± 0.21 SUV) and continuously decreased to 0.35 ± 0.02 SUV at 120 minutes (Fig. 2). At 120 minutes, brain-to-skull ratio for 18F-Mefway PET in the combined regions of insula and hippocampus was 1.58, which was similar to that for 18F-FCWAY PET (1.66).
Fig 2. Comparison of skull uptake in 18F-FCWAY and 18F-Mefway PET.
Here, 18F-FCWAY PET data were acquired with disulfiram pretreatment. Circles and error bars represent mean ± standard error of the mean (SEM) in five healthy controls (closed circle = 18F-FCWAY, open circle = 18F-Mefway).
Comparison of regional brain uptakes
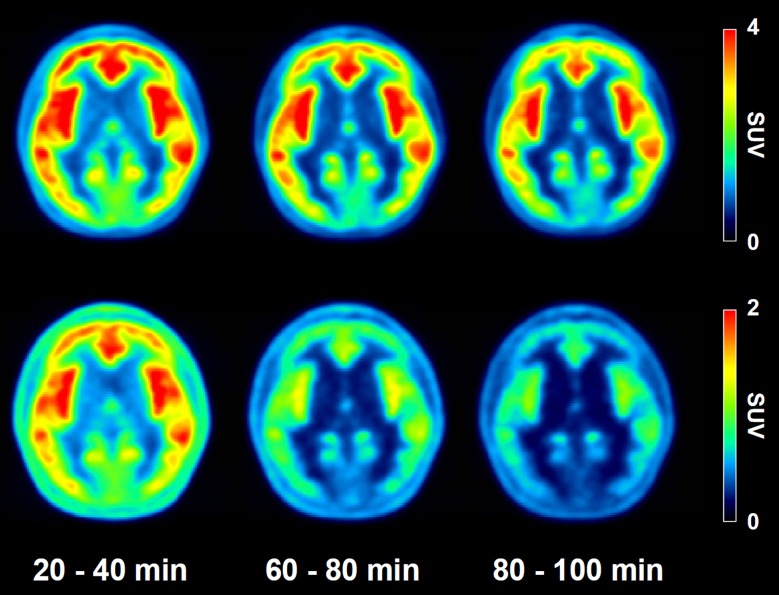
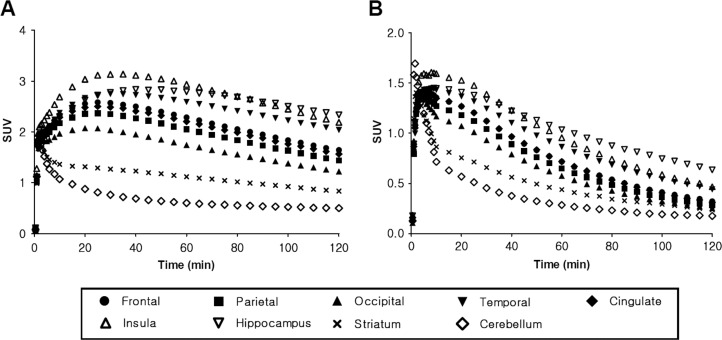
The regional uptake patterns of both radiotracers were similar: from highest to lowest in following order hippocampus, insula, temporal, frontal, cingulate, parietal, occipital cortices, striatum and cerebellum (Figs. 3 and 4). However, regional peak SUV values for the 18F-FCWAY PET are almost two fold than those of 18F-Mefway PET. In 18F-FCWAY PET, cortical uptake continuously increased to 3.13 SUV at 30 minutes postinjection and slowly decreased (Fig. 4A). In 18F-Mefway PET, the peak (1.6 SUV) appeared at 10 minutes, and the decline of radioactivity was much faster than 18F-FCWAY (Fig. 4B). The cerebellar radioactivity of 18F-FCWAY was 2.5 times higher than that of 18F-Mefway (Fig. 5A). Target-to-reference ratio of 18F-FCWAY in the combined region of insula and hippocampus is 37% higher than that of 18F-Mefway, and this ratio for both radiotracers reached peudo-equilibrium after 60 minutes (Fig. 5B).
Fig 3. Axial PET images of 18F-FCWAY (upper) and 18F-Mefway (lower).
Time-averaged images using dynamic PET images of 20–40, 60–80, and 80–100 minute, respectively.
Fig 4. Regional time-activity curves of 18F-FCWAY (A) and 18F-Mefway (B) PET.
Data represent mean values for five healthy controls.
Fig 5. Comparison of cerebellar uptake (A) and target-to-reference ratio (B) in the hippocampus between 18F-FCWAY and 18F-Mefway PET.
Circles and error bars represent mean ± standard error of the mean (SEM) in five healthy controls (closed circle = 18F-FCWAY, open circle = 18F-Mefway).
Comparison of regional binding values and parametric images
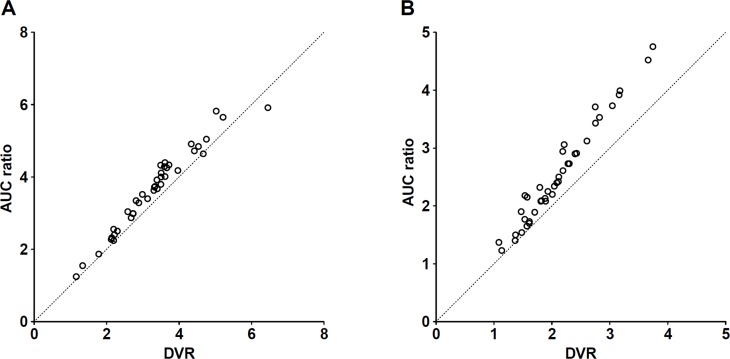
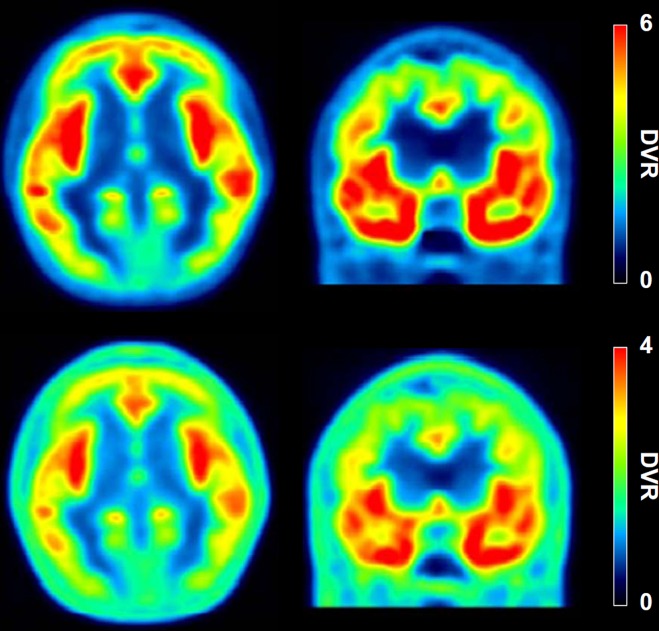
Regional DVR and AUC ratio values are summarized in Table 1 and Table A in S1 File. The 18F-FCWAY PET showed higher DVR and AUC ratio values than 18F-Mefway PET by 25–63% and 23–57%, respectively. The AUC ratio values of both radiotracers strongly correlated with DVR values (R2 = 0.97). However, the AUC ratio values were generally overestimated compared to DVR values, and the regions with high density of 5-HT1A receptor tended to show higher overestimation bias than those with low density of receptor. This overestimation bias was greater for 18F-Mefway than 18F-FCWAY (Table 1 and Fig. 6). Similarly, parametric DVR images of 18F-FCWAY PET showed higher DVR values than those of 18F-Mefway PET (Fig. 7 and Fig. A in S1 File).
Table 1. Regional DVR and AUC ratio values for 18F-FCWAY and 18F-Mefway PET.
| Regions | 18F-FCWAY | 18F-Mefway | ||||
|---|---|---|---|---|---|---|
| DVR | AUC ratio | bias | DVR | AUC ratio | bias | |
| Frontal | 3.27 ± 0.44 | 3.70 ± 0.45 | 0.12 | 2.00 ± 0.30‡ | 2.36 ± 0.38 | 0.15 |
| Parietal | 2.95 ± 0.48 | 3.32 ± 0.50 | 0.11 | 1.80 ± 0.26‡ | 2.11 ± 0.32 | 0.15 |
| Occipital | 2.53 ± 0.34 | 2.81 ± 0.34 | 0.10 | 1.63 ± 0.21‡ | 1.87 ± 0.25 | 0.13 |
| Temporal | 3.93 ± 0.53 | 4.33 ± 0.48 | 0.09 | 2.42 ± 0.39‡ | 2.98 ± 0.51 | 0.19 |
| Cingulate | 3.16 ± 0.63 | 3.62 ± 0.70 | 0.13 | 1.96 ± 0.39† | 2.35 ± 0.42 | 0.17 |
| Insula | 4.32 ± 0.83 | 4.87 ± 0.78 | 0.11 | 2.63 ± 0.53‡ | 3.26 ± 0.65 | 0.19 |
| Hippocampus | 4.60 ± 1.19 | 4.79 ± 0.66 | 0.04 | 3.06 ± 0.68 | 3.82 ± 0.82 | 0.20 |
| Striatum | 1.72 ± 0.46 | 1.84 ± 0.40 | 0.07 | 1.35 ± 0.23 | 1.50 ± 0.21 | 0.10 |
Data are presented as mean ± SD. Bias was calculated as (mean AUC ratio—mean DVR)/mean AUC ratio.
*P < 0.05,
†P< 0.01,
‡P< 0.001.
Fig 6. Relationship between the DVR and AUC ratio values for 18F-FCWAY (A) and 18F-Mefway (B). Dashed lines represent identity lines.
Fig 7. Voxel-wise parametric mapping for 18F-FCWAY (A) and 18F-Mefway (B).
Discussion
We found that the binding pattern of 18F-Mefway PET was similar to that of 18F-FCWAY PET with disulfiram. Although lower brain uptake, lower binding values, and greater overestimation bias of AUC ratio values of 18F-Mefway may be shortcomings of 18F-Mefway compared to 18F-FCWAY, the greatest advantage of 18F-Mefway was little skull uptake resulting from in vivo defluorination. Thus, this radiotracer obviates the need for the use of disulfiram, a defluorination blocker, which may be necessary for the 18F-FCWAY PET in order to obtain clean brain signals. In addition, the radioactivity in the cerebellum for the 18F-Mefway PET was lower than that of 18F-FCWAY. Cerebellum is regarded as non-specific binding region because this area is almost devoid of 5-HT1A receptors. The low cerebellar uptake gives rise to high contrast PET images results from the low background. This result is similar to the binding data in Table 2. Binding affinity of 18F-Mefway showed the highest value, and the binding potential of 18F-Mefway was almost two fold higher than the 18F-MPPF, same 18F-labeled radioligand for 5-HT1A receptor [28]. Therefore, 18F-Mefway may be a promising radioligand for 5-HT1A receptor imaging in human.
Table 2. Comparison of the radiotracers for WAY-100635 derivatives.
| Radiotracer | Binding affinity a (IC50, nM) | Binding potential | ||||
|---|---|---|---|---|---|---|
| Frontal | Temporal | Insula | Cingulate | Hippocampus | ||
| 11C-WAY-100635 b | - | 3.23 | 4.75 | 5.45 | 4.2 | 4.24 |
| 18F-MPPF c | 3.66 | 0.61 | 0.85 | 0.96 | 0.75 | 1.43 |
| 18F-FCWAY | 2.16 | 2.27 | 2.93 | 3.32 | 2.16 | 3.60 |
| 18F-Mefway | 1.49 | 1.11 | 1.50 | 1.75 | 1.09 | 2.07 |
aIC50 measured in human recombinant 5-HT1A receptors expressed in Chinese hamster ovary cells by using 3H-WAY-100635 [28].
b, c Binding potential values for 11C-WAY-100635 and 18F-MPPF are calculated differently [37], [38].
For 18F-FCWAY and 18F-Mefway, binding potential values were calculated as DVR—1. DVR was a mean value in the various brain regions (this work).
Reference method for kinetic modeling utilizes indirect input curves in the reference tissue which is devoid of interesting receptors. Cerebellar gray matter and vermis contain noticeable 5-HT1A receptors whereas cerebellar white matter has few 5-HT1A receptors in humans [25]. Therefore we calculated regional binding values using the white matter as previously recommended [29,30]
In the present study, the brain uptake values of 18F-Mefway PET were lower than those estimated in the rhesus monkey [31]. This discrepancy may be partly explained by the species differences in the enzyme system metabolizing the radiotracer and the substrate activity for P-gp. First, cytochrome P450 (CYP) transforms lipophilic drugs into more polar compounds that can be easily eliminated from the body [32]. The majority of CYP enzymes are conserved among species but some isoforms of CYP were shown to generate species differences in drug metabolism [33]. For instance, various CYP3A isoforms exist in difference species. CYP3A4, 3A5, 3A7 and 3A43 are the major drug-metabolizing isoforms for humans whereas CYP3A8 is important for monkey. Second, P-gp is an efflux transporter located in the apical side of the endothelial cell of the blood brain barrier (BBB) and plays a role in removal of potentially harmful compounds such as toxic substances from the brain [34]. Similarly, the brain uptake of a radiotracer, which is a substrate for P-gp, can be affected by P-gp function. The 11C-(R)-RWAY and 18F-MPPF, 5-HT1A receptor antagonists, were found to be P-gp substrates in rodents and showed low brain uptake [12,35]. Thus, it may be possible that the P-gp function partially contributed to lower brain radioactivity of 18F-Mefway PET in this study. However, the intervention of different CYP enzymes and P-gp merits further investigation.
Faster plasma clearance and slower tissue clearance increases the apparent volume of distribution and target-to-reference ratio in transient equilibrium, and thus, this results in overestimation bias compared to the total volume of distribution and DVR values derived from kinetic modeling. Moreover, the overestimation bias is clearly affected by regional receptor density [36]. In the present study, the AUC ratio values were higher than the DVR values for both radiotracers, and the overestimation bias of AUC ratio values were higher for the 18F-Mefway than 18F-FCWAY. The regional overestimation bias of 18F-Mefway was disproportional; highest in the hippocampus (20%) and lowest in the striatum (10%). AUC tissue to reference ratio can easily applied to estimate the receptor binding to the target tissue. This large bias deduces low accuracy of AUC ratio methods, therefore care should be taken for the large clinical studies of 18F-Mefway PET with static PET scans.
Although defluorination and resulting high skull uptake is a major metabolic problem for some 18F-labeled radioligands, there is no uniform, established method to prevent this issue. The CYP2E1 and glutathione S-transferase are related with the defluorination of 18F-FCWAY and 18F-SP203, respectively. Disulfiram, a direct CYP2E1 inhibitor, can be applied to prevent defluorination in human [24]. Because of its known neurotoxicity particularly to the globus pallidus, striatum, and substantia nigra and resulting extrapyramidal signs, its clinical application may be limited [13,14]. Thus, little skull uptake 18F-Mefway even without defluorination blocker is greatest advantage over 18F-FCWAY.
There are limitations in this study. First, we did not acquire plasma input function nor metabolite assay, which might useful for fully analyzing the characteristics of 18F-Mefway. Second, we did not correct the cerebellum for vascular radioactivity or uptake of labeled mebolites as has been done with previous 18F-FCWAY studies. These factors may be causes for a moderate decrease in target-to-reference ratios at the late times. Further studies should be necessary to make these things clear.
Conclusion
Although the 18F-Mefway PET showed relatively low brain uptake and DVR values compared to 18F-FCWAY PET with disulfiram pretreatment, 18F-Mefway has reasonable binding values with little skull uptake. Therefore, 18F-Mefway may be a good candidate PET radioligand in human use.
Supporting Information
Table A, Comparison of reference tissue models.
(DOCX)
Acknowledgments
The authors express their gratitude to Nambuk Medical Co,LTD. for proving F-18 and to Taeho Song, Wontaek Lee and Minsu Jeon for the technical support in the PET experiments.
Data Availability
All relevant data are within the paper.
Funding Statement
This study was supported by a faculty research grant of Yonsei University College of Medicine (6-2008-2037). The funders had no role in study design, data collection and analysis, decision to publish, or preparation of the manuscript.
References
- 1. Drevets WC, Thase ME, Moses-Kolko EL, Price J, Frank E, Kupfer DJ, et al. Serotonin-1A receptor imaging in recurrent depression: replication and literature review. Nucl Med Biol.2007;34(7): 865–877. [DOI] [PMC free article] [PubMed] [Google Scholar]
- 2. Moses-Kolko EL, Wisner KL, Price JC, Berga SL, Drevets WC, Hanusa BH, et al. Serotonin 1A receptor reductions in postpartum depression: a positron emission tomography study. Fertil Steril.2008;89(3): 685–692. [DOI] [PMC free article] [PubMed] [Google Scholar]
- 3. Akimova E, Lanzenberger R, Kasper S The serotonin-1A receptor in anxiety disorders. Biol Psychiatry.2009;66(7): 627–635. 10.1016/j.biopsych.2009.03.012 [DOI] [PubMed] [Google Scholar]
- 4. Lanzenberger RR, Mitterhauser M, Spindelegger C, Wadsak W, Klein N, Mien LK, et al. Reduced serotonin-1A receptor binding in social anxiety disorder. Biol Psychiatry.2007;61(9): 1081–1089. [DOI] [PubMed] [Google Scholar]
- 5. Yasuno F, Suhara T, Ichimiya T, Takano A, Ando T, Okubo Y Decreased 5-HT1A receptor binding in amygdala of schizophrenia. Biol Psychiatry.2004;55(5): 439–444. [DOI] [PubMed] [Google Scholar]
- 6. Grasby PM, Bench C Neuroimaging of mood disorders. Curr Opin Psychiatry.1997;10(2): 73–78. [Google Scholar]
- 7. Kumar JS, Mann JJ PET tracers for 5-HT1A receptors and uses thereof. Drug Discov Today.2007;12(17–18): 748–756. [DOI] [PubMed] [Google Scholar]
- 8. Paterson LM, Kornum BR, Nutt DJ, Pike VW, Knudsen GM 5-HT radioligands for human brain imaging with PET and SPECT. Med Res Rev.2013;33(1): 54–111. 10.1002/med.20245 [DOI] [PMC free article] [PubMed] [Google Scholar]
- 9. Carson RE, Lang L, Watabe H, Der MG, Adams HR, Jagoda E, et al. PET evaluation of [18F]FCWAY, an analog of the 5-HT1A receptor antagonist, WAY-100635. Nucl Med Biol.2000;27(5): 493–497. [DOI] [PubMed] [Google Scholar]
- 10. Tipre DN, Zoghbi SS, Liow JS, Green MV, Seidel J, Ichise M, et al. PET imaging of brain 5-HT1A receptors in rat in vivo with 18F-FCWAY and improvement by successful inhibition of radioligand defluorination with miconazole. J Nucl Med.2006;47(2): 345–353. [PubMed] [Google Scholar]
- 11. Lacan G, Plenevaux A, Rubins DJ, Way BM, Defraiteur C, Lemaire C, et al. Cyclosporine, a P-glycoprotein modulator, increases [18F]MPPF uptake in rat brain and peripheral tissues: microPET and ex vivo studies. Eur J Nucl Med Mol Imaging.2008;35(12): 2256–2266. 10.1007/s00259-008-0832-z [DOI] [PubMed] [Google Scholar]
- 12. Passchier J, van Waarde A, Doze P, Elsinga PH, Vaalburg W Influence of P-glycoprotein on brain uptake of [18F]MPPF in rats. Eur J Pharmacol.2000;407(3): 273–280. [DOI] [PubMed] [Google Scholar]
- 13. Cho YN, Lyoo CH, Lee MS Imaging evidence of nigral damage in dystonia secondary to disulfiram intoxication. Mov Disord.2011;26(4): 763–764. 10.1002/mds.23496 [DOI] [PubMed] [Google Scholar]
- 14. Laplane D, Attal N, Sauron B, de Billy A, Dubois B Lesions of basal ganglia due to disulfiram neurotoxicity. J Neurol Neurosurg Psychiatry.1992;55(10): 925–929. [DOI] [PMC free article] [PubMed] [Google Scholar]
- 15. Choi JY, Kim CH, Jeon TJ, Kim BS, Yi CH, Woo KS, et al. Effective microPET imaging of brain 5-HT1A receptors in rats with [18F]MeFWAY by suppression of radioligand defluorination. Synapse.2012;66(12): 1015–1023. 10.1002/syn.21607 [DOI] [PubMed] [Google Scholar]
- 16. Hillmer AT, Wooten DW, Bajwa AK, Higgins AT, Lao PJ, Betthauser TJ, et al. First-in-human evaluation of 18F-mefway, a PET radioligand specific to serotonin-1A receptors. J Nucl Med.2014;55(12): 1973–1979. 10.2967/jnumed.114.145151 [DOI] [PMC free article] [PubMed] [Google Scholar]
- 17. Saigal N, Bajwa AK, Faheem SS, Coleman RA, Pandey SK, Constantinescu CC, et al. Evaluation of serotonin 5-HT1A receptors in rodent models using [18F]mefway PET. Synapse.2013;67(9): 596–608. 10.1002/syn.21665 [DOI] [PMC free article] [PubMed] [Google Scholar]
- 18. Saigal N, Pichika R, Easwaramoorthy B, Collins D, Christian BT, Shi B, et al. Synthesis and biologic evaluation of a novel serotonin 5-HT1A receptor radioligand, 18F-labeled mefway, in rodents and imaging by PET in a nonhuman primate. J Nucl Med.2006;47(10): 1697–1706. [PubMed] [Google Scholar]
- 19. Mattick RP, Clarke JC Development and validation of measures of social phobia scrutiny fear and social interaction anxiety. Behav Res Ther.1998;36(4): 455–470. [DOI] [PubMed] [Google Scholar]
- 20. Leary MR A Brief Version of the Fear of Negative Evaluation Scale. Personality and Social Psychology Bulletin 1983;9(3): 371–375. [Google Scholar]
- 21. Beck AT, Ward CH, Mendelson M, Mock J, Erbaugh J An inventory for measuring depression. Arch Gen Psychiatry.1961;4: 561–571. [DOI] [PubMed] [Google Scholar]
- 22. Choi JY, Kim CH, Ryu YH, Seo YB, Truong P, Kim EJ, et al. Optimization of the radiosynthesis of [18F]MEFWAY for imaging brain serotonin 1A receptors by using the GE TracerLab FXFN-Pro module. J Labelled Comp Radiopharm.2013;56(12): 589–594. 10.1002/jlcr.3067 [DOI] [PubMed] [Google Scholar]
- 23. Lang L, Jagoda E, Schmall B, Vuong BK, Adams HR, Nelson DL, et al. Development of fluorine-18-labeled 5-HT1A antagonists. J Med Chem.1999;42(9): 1576–1586. [DOI] [PubMed] [Google Scholar]
- 24. Ryu YH, Liow JS, Zoghbi S, Fujita M, Collins J, Tipre D, et al. Disulfiram inhibits defluorination of 18F-FCWAY, reduces bone radioactivity, and enhances visualization of radioligand binding to serotonin 5-HT1A receptors in human brain. J Nucl Med.2007;48(7): 1154–1161. [DOI] [PubMed] [Google Scholar]
- 25. Parsey RV, Arango V, Olvet DM, Oquendo MA, Van Heertum RL, John Mann J Regional heterogeneity of 5-HT1A receptors in human cerebellum as assessed by positron emission tomography. J Cereb Blood Flow Metab.2005;25(7): 785–793. [DOI] [PubMed] [Google Scholar]
- 26. Ichise M, Liow JS, Lu JQ, Takano A, Model K, Toyama H, et al. Linearized reference tissue parametric imaging methods: application to [11C]DASB positron emission tomography studies of the serotonin transporter in human brain. J Cereb Blood Flow Metab.2003;23(9): 1096–1112. [DOI] [PubMed] [Google Scholar]
- 27. Logan J, Fowler JS, Volkow ND, Wang GJ, Ding YS, Alexoff DL Distribution volume ratios without blood sampling from graphical analysis of PET data. J Cereb Blood Flow Metab.1996;16(5): 834–840. [DOI] [PubMed] [Google Scholar]
- 28. Choi JY, Kim BS, Kim CH, Kim DG, Han SJ, Lee K, et al. Translational possibility of [18 F]Mefway to image serotonin 1A receptors in humans: Comparison with [18F]FCWAY in rodents. Synapse.2014;68: 595–603. 10.1136/jech-2014-204040 [DOI] [PubMed] [Google Scholar]
- 29. Giovacchini G, Conant S, Herscovitch P, Theodore WH Using cerebral white matter for estimation of nondisplaceable binding of 5-HT1A receptors in temporal lobe epilepsy. J Nucl Med.2009;50(11): 1794–1800. 10.2967/jnumed.109.063743 [DOI] [PMC free article] [PubMed] [Google Scholar]
- 30. Hirvonen J, Kajander J, Allonen T, Oikonen V, Nagren K, Hietala J Measurement of serotonin 5-HT1A receptor binding using positron emission tomography and [carbonyl-11C]WAY-100635-considerations on the validity of cerebellum as a reference region. J Cereb Blood Flow Metab.2007;27(1): 185–195. [DOI] [PubMed] [Google Scholar]
- 31. Wooten DW, Moraino JD, Hillmer AT, Engle JW, Dejesus OJ, Murali D, et al. In vivo kinetics of [F-18]MEFWAY: a comparison with [C-11]WAY100635 and [F-18]MPPF in the nonhuman primate. Synapse.2011;65(7): 592–600. 10.1002/syn.20878 [DOI] [PMC free article] [PubMed] [Google Scholar]
- 32. Venkatakrishnan K, Von Moltke LL, Greenblatt DJ Human drug metabolism and the cytochromes P450: application and relevance of in vitro models. J Clin Pharmacol.2001;41(11): 1149–1179. [DOI] [PubMed] [Google Scholar]
- 33. Martignoni M, Groothuis GM, de Kanter R Species differences between mouse, rat, dog, monkey and human CYP-mediated drug metabolism, inhibition and induction. Expert Opin Drug Metab Toxicol.2006;2(6): 875–894. [DOI] [PubMed] [Google Scholar]
- 34. Gottesman MM, Fojo T, Bates SE Multidrug resistance in cancer: role of ATP-dependent transporters. Nat Rev Cancer.2002;2(1): 48–58. [DOI] [PubMed] [Google Scholar]
- 35. Zhang XY, Yasuno F, Zoghbi SS, Liow JS, Hong J, McCarron JA, et al. Quantification of serotonin 5-HT1A receptors in humans with [11C](R)-(-)-RWAY: radiometabolite(s) likely confound brain measurements. Synapse.2007;61(7): 469–477. [DOI] [PubMed] [Google Scholar]
- 36. Carson RE, Channing MA, Blasberg RG, Dunn BB, Cohen RM, Rice KC, et al. Comparison of bolus and infusion methods for receptor quantitation: application to [18F]cyclofoxy and positron emission tomography. J Cereb Blood Flow Metab.1993;13(1): 24–42. [DOI] [PubMed] [Google Scholar]
- 37. Parsey RV, Slifstein M, Hwang DR, Abi-Dargham A, Simpson N, Mawlawi O, et al. Validation and reproducibility of measurement of 5-HT1A receptor parameters with [carbonyl-11C]WAY-100635 in humans: comparison of arterial and reference tisssue input functions. J Cereb Blood Flow Metab.2000;20(7): 1111–1133. [DOI] [PubMed] [Google Scholar]
- 38. Costes N, Zimmer L, Reilhac A, Lavenne F, Ryvlin P, Le Bars D Test-retest reproducibility of 18F-MPPF PET in healthy humans: a reliability study. J Nucl Med.2007;48(8): 1279–1288. [DOI] [PubMed] [Google Scholar]
Associated Data
This section collects any data citations, data availability statements, or supplementary materials included in this article.
Supplementary Materials
Table A, Comparison of reference tissue models.
(DOCX)
Data Availability Statement
All relevant data are within the paper.


