

Introduction:
Indeterminate pulmonary nodules (IPNs) lack clinical or radiographic features of benign etiologies and often undergo invasive procedures unnecessarily, suggesting potential roles for diagnostic adjuncts using molecular biomarkers. The primary objective was to validate a multivariate classifier that identifies likely benign lung nodules by assaying plasma protein expression levels, yielding a range of probability estimates based on high negative predictive values (NPVs) for patients with 8 to 30 mm IPNs.
Methods:
A retrospective, multicenter, case-control study was performed using multiple reaction monitoring mass spectrometry, a classifier comprising five diagnostic and six normalization proteins, and blinded analysis of an independent validation set of plasma samples.
Results:
The classifier achieved validation on 141 lung nodule-associated plasma samples based on predefined statistical goals to optimize sensitivity. Using a population based nonsmall-cell lung cancer prevalence estimate of 23% for 8 to 30 mm IPNs, the classifier identified likely benign lung nodules with 90% negative predictive value and 26% positive predictive value, as shown in our prior work, at 92% sensitivity and 20% specificity, with the lower bound of the classifier’s performance at 70% sensitivity and 48% specificity. Classifier scores for the overall cohort were statistically independent of patient age, tobacco use, nodule size, and chronic obstructive pulmonary disease diagnosis. The classifier also demonstrated incremental diagnostic performance in combination with a four-parameter clinical model.
Conclusions:
This proteomic classifier provides a range of probability estimates for the likelihood of a benign etiology that may serve as a noninvasive, diagnostic adjunct for clinical assessments of patients with IPNs.
Keywords: Lung nodule, Proteomics, Molecular diagnostic, Biomarker
Lung nodules deemed indeterminate lack the features suggestive of benign etiologies1 and present clinicians with a diagnostic conundrum. Patient and practitioner balance a desire for the certainty of a diagnosis against the tolerance for the unknown, while assessing the risk and yield of an invasive procedure and the likelihood of malignancy. Achieving an early diagnosis of cancer remains a clinical imperative2 to improve the dismal 16% 5-year survival of nonsmall-cell lung cancer (NSCLC),3 and also to assuage the immediate concern and anxiety engendered among both patients and physicians upon the identification of such spots.4–6 The use of computed tomography (CT) technology has grown annually with the number of nodules identified by chest CT scans approaching millions per year, most of which are benign.5 Patients with a nodule less than 8 mm in size or having benign radiographic features may be managed expectantly by serial CT scan surveillance.1 However, those with larger nodules may embark on a diagnostic odyssey,7 including positron emission tomography (PET), transthoracic needle aspiration, bronchoscopic biopsy, and/or surgery.1 Therefore, innovative strategies to identify benign lung nodules may mitigate the diagnostic burden of those considered indeterminate, by providing complementary data for decision-making, minimizing surgical resection of benign processes,8 and managing more lung nodules by radiographic surveillance.
Extensive efforts to classify pulmonary nodules using molecular biomarkers, such as DNA, RNA, and proteins, have yielded novel insights into lung cancer pathogenesis, with most having been focused largely on identifying malignant rather than benign lung nodules.2,9–17 Proteins are attractive as biomarkers because they are the dynamic, functional molecules acting in cell communications,18 with those of greatest interest often being in low abundance in plasma or serum. Therefore, advances in bioinformatics are at the core of recent progress in the development of diagnostic biomarker classifiers.19 The current enthusiasm for introducing biomarkers into practice has also heightened expectations for rigor in their validation as diagnostic tools for a targeted or intended use population.20
Our prior work21 applied multiple reaction monitoring mass spectrometry22,23 for the discovery and initial validation of a classifier incorporating plasma protein expression levels to differentiate benign and malignant pulmonary nodules with 90% negative predictive value (NPV). In this study, we performed a validation of a multiprotein plasma classifier that prioritizes the diagnostic parameters of sensitivity and NPV to identify likely benign lesions in patients presenting with 8 to 30 mm lung nodules.
MATERIALS AND METHODS
Validation
The study conforms to Institute of Medicine guidelines20 (Supplemental Table 4, Supplemental Digital Content, http://links.lww.com/JTO/A773) and the Standards for Reporting of Diagnostic Accuracy (STARD) criteria for reporting studies of diagnostic accuracy (Supplemental Table 5, Supplemental Digital Content, http://links.lww.com/JTO/A773).24 Protein expression analyses and computational procedures were performed in a clinical laboratory adhering to the Clinical Laboratory Improvement Amendments of 1988.20
Study Design and Oversight
The overall objective was to validate the performance of an 11-protein classifier in identifying lung nodules with likely benign (i.e., nonmalignant) etiologies (Supplemental Materials, Supplemental Digital Content, http://links.lww.com/JTO/A773), yielding a range of probability estimates for use as a diagnostic adjunct in clinical assessments. A retrospective, case-control study utilized multiple reaction monitoring mass spectrometry to analyze archival plasma samples from subjects enrolled in clinical studies approved by the Ethics Review Board or Institutional Review Boards at multiple institutions, using a blinded data analysis strategy. Management of clinical data complied with the Health Insurance Portability and Accountability Act of 1996.
Study Inclusion and Exclusion Criteria
The subject inclusion criteria were a minimum age of 40 years and any smoking history. The radiologic and pathologic criteria for lung nodule inclusion were a diameter between 8 to 30 mm, a histopathologic diagnosis of NSCLC or a benign process, or a clinical diagnosis of a benign etiology based on stability in size and appearance for 2 years after the baseline CT scan. The subject exclusion criteria included the lack of nodule size or histopathologic diagnosis, follow-up for less than 2 years, or a diagnosis of small-cell lung cancer. The subjects’ spirometry data and the global initiative for chronic obstructive lung disease criteria25 were used to define the presence and severity of chronic obstructive pulmonary disease (COPD). The cancer and benign subgroups were matched for age, gender, smoking history, and nodule size.
Lung Nodule Protein Expression Classifier and Proteomic Analysis
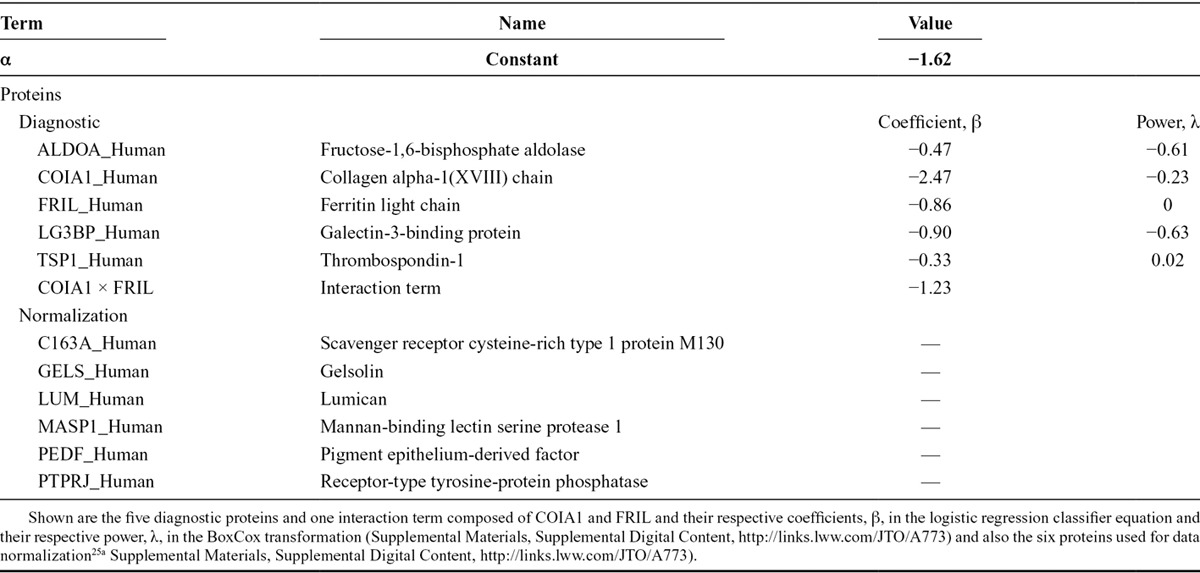
The classifier consists of five diagnostic and six normalization proteins (Table 1), which were fully defined, or “locked-down,” before sample analysis. The five diagnostic proteins were refined from the 13 proteins previously shown to discriminate benign and malignant lung nodules21 using stable isotope standards (Supplemental Materials, Supplemental Digital Content, http://links.lww.com/JTO/A773). The six normalization proteins were identified to reduce preanalytical and analytical variations in mass spectroscopic protein quantification.25a Plasma protein expression assays were performed as previously described21 using methods incorporating stable isotope standards (Supplemental Materials, Supplemental Digital Content, http://links.lww.com/JTO/A773).
TABLE 1.
Lung Nodule Protein Expression Classifier Diagnostic and Normalization Proteins
Data Analysis
The first objective was to validate the overall performance of the classifier (Table 1) in identifying benign nodules, using the method of the partial area under the curve (pAUC).26 This objective required that the lower 95% confidence bound of the pAUC bounded by a sensitivity of 0.8 be higher than the corresponding pAUC (0.02) of a nonperforming classifier. The second objective was to validate the performance of the classifier in identifying benign nodules at predefined reference values using binomial testing. This objective required that the lower 95% confidence bound of the fraction of benign samples among samples whose scores were less than or equal to the corresponding reference values be higher than the fraction of benign samples in the study. The fixed-sequence procedure27,28 was used to control the overall multitesting error rate (α = 0.05) in the study. Statistical analyses were performed using the MannWhitney and Fisher’s exact tests.
RESULTS
Study Cohort
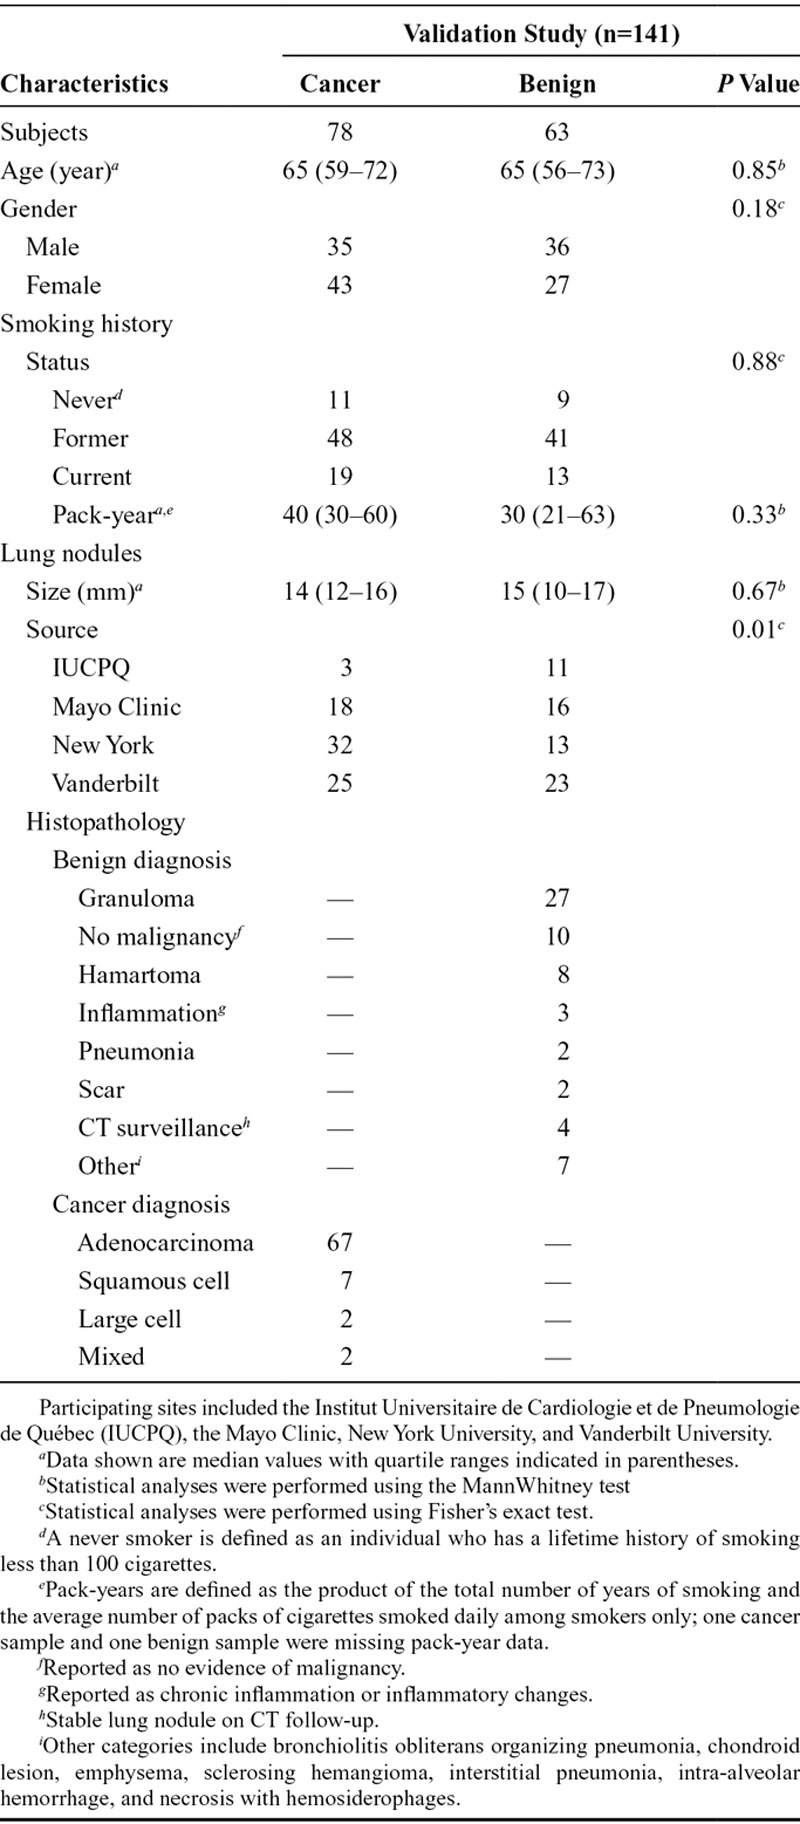
Plasma specimens from 195 subjects with lung nodules at four institutions in different geographic regions of North America initially satisfied the study inclusion criteria, which included a minimum subject age of 40 years, but no stipulated smoking status or pack-year history. Thirty-two candidate samples were excluded due to clinical criteria, and an additional 22 samples were excluded based on laboratory criteria. A total of 141 subjects satisfied all clinical and laboratory criteria, including 78 with cancer and 63 with benign diagnoses, demonstrated no overlap with those involved in the classifier’s development, and were included in the data analysis (Fig. 1 and Table 2). There were no statistically significant differences in subject age, gender, and smoking history or lung nodule size between the cancer and benign groups.
FIGURE 1.
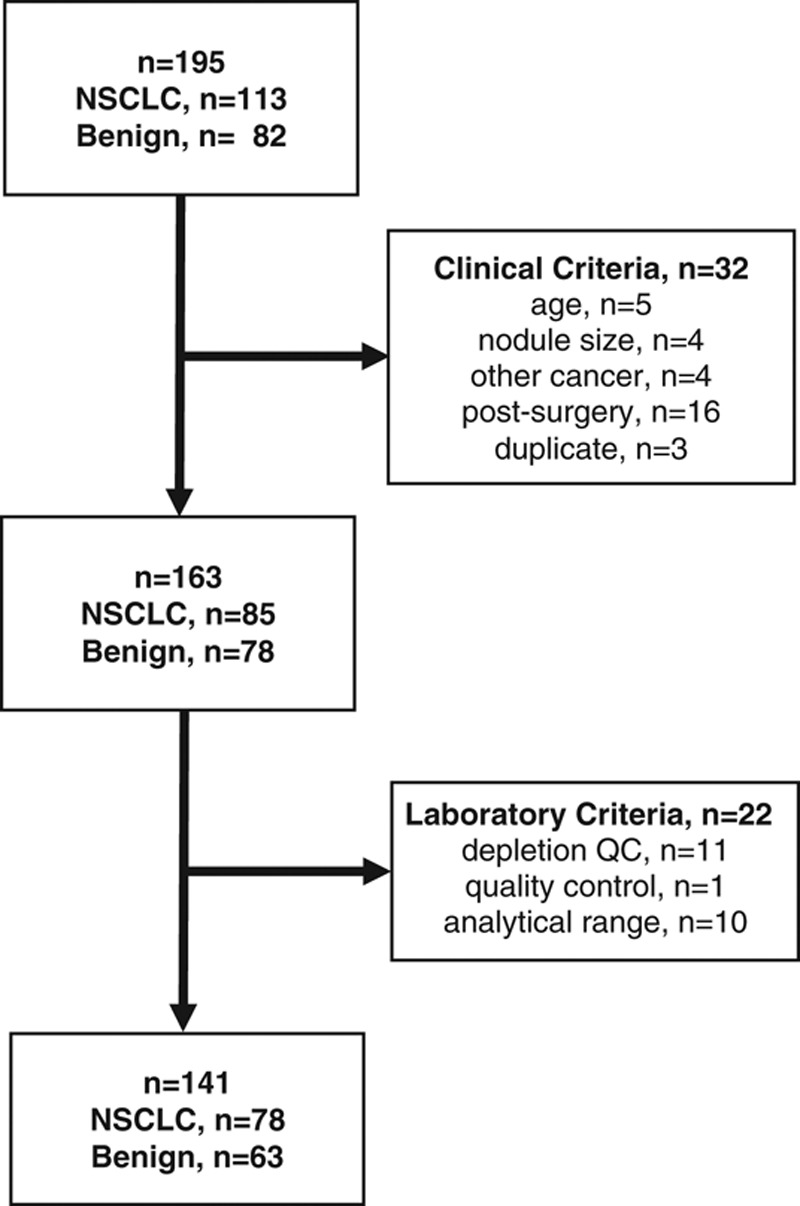
Flow chart of validation study plasma sample availability and exclusions based on clinical and laboratory criteria. The participating centers (n = 4) identified 195 plasma samples from 195 subjects initially satisfying the study inclusion criteria. After completion of clinical data monitoring, 32 candidate samples were excluded due to subject age less than 40 years; nodule size less than 8 mm or larger than 30 mm; nodule cancer pathology other than NSCLC; plasma sample collection after surgery; or provision of duplicate samples from the same subjects. An additional 22 samples were excluded after sample analysis based on laboratory criteria including depletion column quality control, mass spectrometry quality control, or a classifier result outside of the validated analytical range.21 A final total of 141 samples from 141 subjects satisfied the prespecified clinical and laboratory criteria, including 78 cancer and 63 benign samples, and were included in the data analysis.
TABLE 2.
Clinical Characteristics of Subjects and Lung Nodules
Identification of Likely Benign Lung Nodules
The use of biomarkers for diagnostic purposes requires validation of the classifier’s performance,20 including the definition of the clinically relevant performance range to impact decision-making. Based on the plasma measurements of five diagnostic and six normalization proteins, the protein expression classifier yields a score from 0 to 1, with each value associated with a sensitivity and a specificity, and lower scores associated with a higher probability of a benign etiology.21
The overall performance of the classifier in identifying benign nodules was validated with a lower 95% confidence bound for the pAUC of 0.026, which was greater than the targeted pAUC of 0.02 (Fig. 2 and Supplemental Materials, Supplemental Digital Content, http://links.lww.com/JTO/A773). The performance of the classifier in identifying benign nodules at predefined reference values was tested individually in an increasing, stepwise manner and validated up to a reference value of 0.47 (Supplemental Materials, Supplemental Digital Content, http://links.lww.com/JTO/A773). As shown in Figure 2, the sensitivity of the classifier increases above 70% at 0.47, as the reference values decrease toward the upper-right portion of the receiver operating characteristics (ROC) curve.
FIGURE 2.
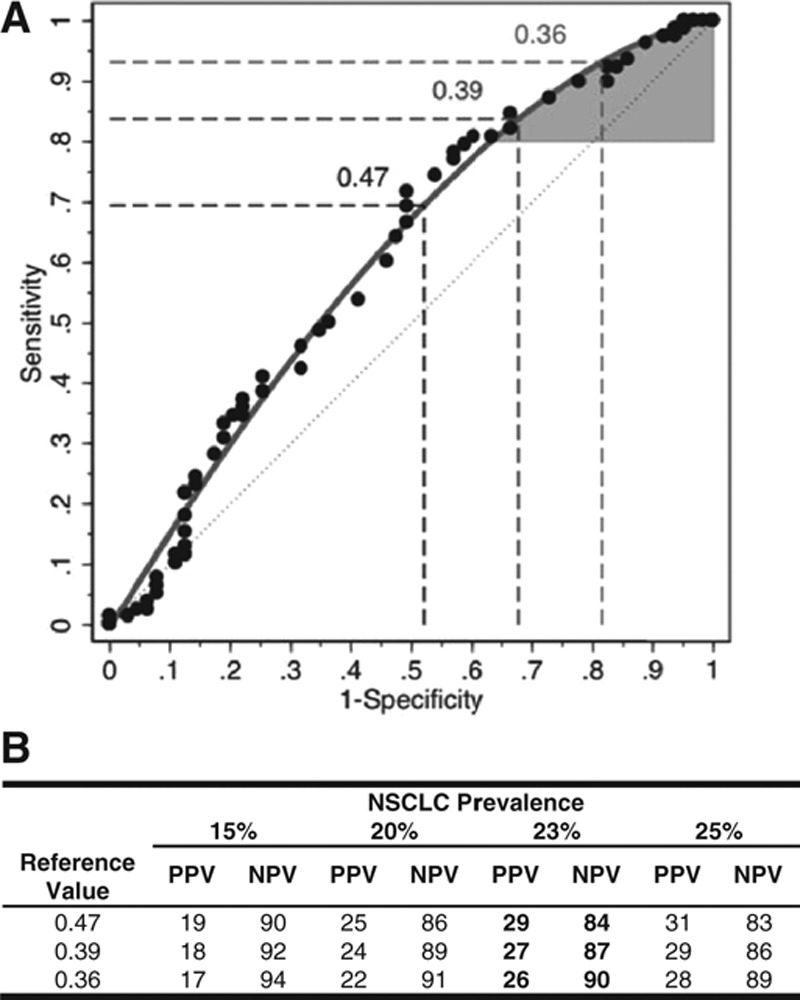
Protein expression classifier validation. The protein expression classifier yields a score between 0 and 1, with lower values associated with a higher probability of a benign etiology, based on the identification and quantification of specific plasma proteins (Supplemental Materials, Supplemental Digital Content, http://links.lww.com/JTO/A773). A, The statistical performance of the classifier was validated with a lower 95% confidence bound for the partial area under the curve (pAUC) of 0.026, which was greater than the targeted pAUC of 0.02; the performance of the classifier was validated at predefined reference values from 0.38 to 0.47. Shown are the receiver operating characteristic (ROC) curves based on the raw (circles) and fitted (grey line) data, along with the ROC curve associated with chance (grey dashed line). The maximal classifier score in the study for use as a reference value to assign a likely benign classification was 0.47, using the fixed-sequence procedure.27,28 Therefore, the region bounded by the grey ROC curve and a sensitivity of 80% represents the classifier’s partial area under the ROC curve (AUC) (shaded in grey). The associated sensitivity and specificity values (%) for the reference value of 0.47 are indicated (dashed lines). Similar data for reference values of 0.39 and 0.36, which correspond to NPVs of 87% and 90%, respectively, are indicated (dashed lines). B, A reference value is a specific score at or below which the classifier may assign a likely benign result to a given plasma specimen, based on the measured values of the classifier’s constituent proteins. Classifier scores between 0.18 and 0.47 may be used as a reference value. Shown are the positive and negative predictive values (PPV and NPV, respectively) for classifier reference values of 0.36, 0.39, and 0.47 using cancer prevalences of 15%, 20%, 23%, and 25%. The value of 0.47 is shown based on the prespecified criterion for validation of the classifier using the fixed sequence procedure; and the values of 0.36 and 0.39 are shown to illustrate a diagnostic performance of 90% NPV and an intermediate value, respectively.
The NPV was determined for each reference value by incorporating the prevalence of NSCLC in the target population with 8 to 30 mm lung nodules, as high NPVs are useful in identifying the absence of malignancy,29 e.g., benign nodules. Due to the lack of a consensus estimate of cancer prevalence for pulmonary nodules,30–33 a population-based weight-adjusted NSCLC prevalence of 23.1% was used, incorporating data from a national, multicenter chart review study of patients with indeterminate pulmonary nodules (IPNs, n = 377; unpublished data) and the National Lung Screening Trial34 (Supplemental Materials, Supplemental Digital Content, http://links.lww.com/JTO/A773). The NPV also increases from 84% at a reference value of 0.47 to 90% at a reference value of 0.36 (Fig. 2B), corresponding to sensitivity and specificity of 92% and 20%, respectively (Supplemental Fig. 4, Supplemental Digital Content, http://links.lww.com/JTO/A773). The reference value-specific NPVs may be associated with potential false-negative results, possibly resulting in malignant nodules being misclassified as likely benign, as shown in Supplemental Table 7 (Supplemental Digital Content, http://links.lww.com/JTO/A773). No single or combination of clinical parameters was identified that distinguished a given lung nodule sample in the study cohort as a potential “false-negative” result, using either 0.47 or 0.36 as a reference value.
Classifier Independence of NSCLC Predictors
The cancer and benign groups were matched for age, pack-years, and nodule size, similar to what was done in the discovery and initial validation of the classifier proteins.21 This enabled further assessment of the relationship of the classifier score to these clinical parameters. With respect to age, smoking history pack-years, and nodule size, none of these parameters correlated with the classifier scores (Supplemental Fig. 5 and Table 8, Supplemental Digital Content, http://links.lww.com/JTO/A773), which is consistent with our previous results.21
COPD Status and Classifier Scores
Because COPD is a major risk factor for lung cancer,35 the potential impact of a concurrent COPD diagnosis on classifier scores was determined. Spirometry data were available for 54 (45%) of the 121 subjects with a history of tobacco use, including 33 with a cancer diagnosis and 21 with a benign diagnosis (Fig. 3A). There was no difference between the classifier scores in subjects with malignant lung nodules without or with COPD (Fig. 3B). Similarly, there was no difference observed for classifier scores in subjects with benign lung nodules in the absence or presence of COPD.
FIGURE 3.
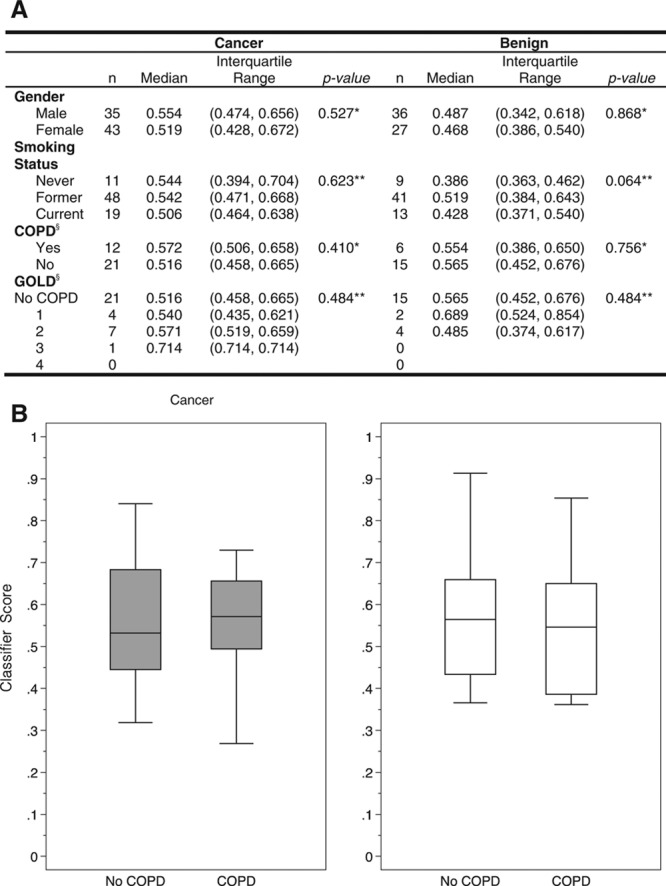
Distribution of classifier scores between cancer and benign histopathology by tobacco use and chronic obstructive pulmonary disease (COPD). A, Shown are the correlations of classifier scores by subject gender, tobacco use history, and COPD subgrouped by the global initiative for chronic obstructive lung disease (GOLD) classification system for malignant and benign lung nodules. (Statistical analyses were performed using either the MannWhitney test* or the KruskalWallis test.** Data provided only for those nonsmoking subjects satisfying the GOLD definition of COPD.§) B, Box plots of classifier scores for subjects without and with COPD in association with lung nodules, with either a diagnosis of NSCLC (cancer) or a benign etiology (benign), demonstrate no statistically significant impact of COPD on classifier scores.
Incremental Diagnostic Value
To illustrate the potential added diagnostic value of the protein expression classifier to the clinical assessment of patients with lung nodules, a four-parameter clinical model composed of patient age, gender, and smoking history pack-years together with lung nodule size (clinical) and a model combining the clinical model with the protein expression classifier (clinical + classifier) were evaluated, as shown in Figure 4. The classifier demonstrated an area under the curve (AUC) of 0.615 (95% confidence interval [CI]: 0.524, 0.707), which was greater than that of the clinical model which showed an AUC of 0.591 (95% CI: 0.492, 0.678), whereas the AUC of the combined clinical + classifier model was 0.634 (95% CI: 0.530, 0.724). Similarly, the pAUC of the clinical + classifier model was 0.062 (95% CI: 0.035, 0.088) and greater than the pAUC of 0.041 (95% CI: 0.022, 0.062) for the clinical model alone. The clinical + classifier model significantly improved upon the performance of the clinical model alone based on the likelihood ratio test (p = 0.025). The integrated discrimination improvement index, a metric for evaluating the incremental diagnostic value of biomarkers,36 for the clinical + classifier model was 0.041 (95% CI: 0.006, 0.076; p = 0.021). These data suggest that the protein expression classifier result may augment the diagnostic performance of clinical parameters used by physicians to assess lung nodules.
FIGURE 4.
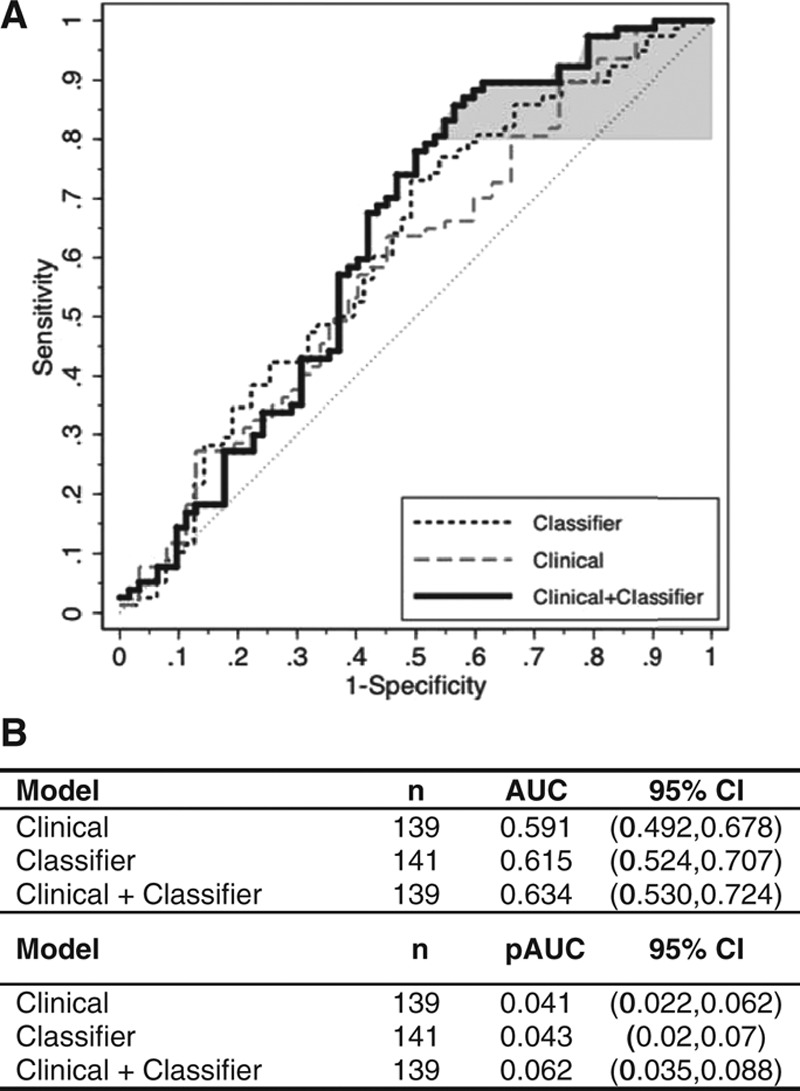
Incremental diagnostic value of the protein expression classifier to a clinical lung nodule prediction model. Shown are the respective ROC curves for the clinical model48 alone (grey dashed line), the protein expression classifier alone (black dashed line), and the model combining the protein expression classifier and the clinical model (solid line). Model performance for the clinical models was evaluated based on 1000 bootstrappings. Area under the ROC curve (AUC) and partial area under the curve (pAUC) at 80% sensitivity (shaded in grey) were calculated with bootstrap bias-corrected 95% confidence intervals (CI). The clinical model was composed of gender and the continuous variables of subject age and smoking history in pack-years (PKY) together with lung nodule size in a logistic regression model (Supplemental Materials, Supplemental Digital Content, http://links.lww.com/JTO/A773). The clinical plus classifier model included an additional parameter—the protein expression classifier score. Of the 141 subjects and lung nodules in the validation study cohort, one cancer sample and one benign sample were removed from the analysis due to missing PKY data; therefore, 139 samples were fitted in the logistic regression models, first with the clinical model alone and then with the clinical plus classifier model. The clinical model alone yielded an AUC of 0.591, whereas the clinical plus classifier model yielded an AUC of 0.634. The clinical model alone yielded a pAUC of 0.041, whereas the clinical plus classifier model yielded a pAUC of 0.062.
DISCUSSION
Although most lung nodules are benign,5 the decision to pursue serial CT scan surveillance is often difficult for those characterized as indeterminate (Supplemental Table 3, Supplemental Digital Content, http://links.lww.com/JTO/A773).1 To address the need for diagnostic adjuncts to the clinical predictors of malignancy, our prior work identified a panel of plasma proteins that discriminates benign from malignant lung nodules based on high sensitivity and high NPV and involves molecular pathways implicated in lung cancer. This study demonstrates successful validation of a protein expression classifier using an independent plasma sample set, yielding a range of NPVs to estimate the probability that a patient’s lung nodule is due to a benign, i.e., nonmalignant, etiology.
By incorporating the expression values of 11 plasma proteins quantified by mass spectrometry, the classifier yields a score that may be translated into a probability that an IPN is benign. Such a probability may be useful to discriminate nodules that are benign from those that are indeterminate at the time of initial assessment.1 The classifier includes five diagnostic proteins that play roles in diverse signaling pathways implicated in homeostasis and lung cancer pathogenesis. Expression of fructose-1,6-bisphosphate aldolase, an enzyme regulating diverse cellular functions, is upregulated in adenocarcinoma tissues and correlates with the metastatic potential of squamous cell carcinoma.37,38 Collagen alpha-1 (XVIII) chain is an extracellular matrix protein constituent of vascular and epithelial basement membranes whose expression is strongly associated with poor outcomes in NSCLC.39 Downregulation of the expression of ferritin light chain identified in the early stages of squamous cell carcinoma suggests its potential as a biomarker for early diagnosis.40 Tissue expression of galectin-3-binding protein, which is implicated in angiogenesis and cell adhesion, motility and invasion, correlates with poor survival rates in lung cancer patients.41,42 Thrombospondin-1 is an endogenous angiogenesis inhibitor previously implicated as a circulating diagnostic biomarker discriminatory for lung cancer.43,44 The 141 validation study plasma samples analyzed, and the 247 patient samples in our prior study, were representative of the classifier’s target population.21 Achieving the first-validation objective based on the partial AUC of the ROC curve enabled optimization of the classifier’s sensitivity, and achieving the second-validation objective defined the range of classifier scores used to derive the NPVs, based on the associated sensitivity and a weight-adjusted estimate of NSCLC prevalence for the target population. The importance of cancer prevalence on NPV was demonstrated by comparing the classifier NPVs based on the observed prevalence in the study cohort to the weight-adjusted prevalence estimated for the target population (Supplemental Fig. 4, Supplemental Digital Content, http://links.lww.com/JTO/A773). This study’s cancer prevalence of 55% is artifactually high given the case-control study design and is not representative of the cancer prevalence in the overall population of patients with IPNs. By contrast, use of the 23% cancer prevalence estimate for the target population allowed the calculation of NPVs (for the range of classifier reference values) that would more likely be observed in clinical practice. The potential impact of lower or higher prevalence of NSCLC on the protein expression classifier is shown in Figure 2B, demonstrating that a lower cancer prevalence increases the classifier’s NPV at each reference value, whereas a higher cancer prevalence decreases its performance. By contrast, the corresponding low positive predictive values based on the associated specificities were anticipated due to the prioritization of identifying benign rather than malignant nodules. Thus, the proteomic analysis of a patient’s plasma based on the classifier may be used to derive a probability, ranging from an NPV of 84% that a given individual’s lung nodule is likely due to a benign etiology.
Several aspects of the data suggest that the protein expression classifier may be a useful diagnostic adjunct to the current paradigm for assessing indeterminate lung nodules. There was no correlation between classifier scores and the clinical parameters of age, smoking history pack-years, or nodule size for this cohort, which was also previously demonstrated for this biomarker panel.21 The independence of the classifier from these clinical predictors enabled it to augment the diagnostic performance of a four-parameter clinical model as demonstrated by an increase in the AUC of the combined model. The addition of other clinical and imaging parameters, such as nodule location, shape, or structure, may further augment the performance of such models. The lack of correlation between COPD global initiative for chronic obstructive lung disease status and classifier scores suggests that the classifier’s clinical performance may be minimally influenced by a patient’s concurrent diagnosis of mild or moderate COPD. Furthermore, the range of NPVs for the classifier reference values has a minimum of 84%, correlating with a false-negative rate (FNR) of 16% or lower; these classifier performance data compare favorably with the 4% to 28% FNR for quantitatively interpreted PET scans, the 10% to 30% FNR for transthoracic needle biopsy, and the 30% to 70% FNR for bronchoscopic biopsy.1
The potential limitations of this study derive from specifics of the experimental design relating to the classifier performance priorities and molecular biomarkers. As illustrated by the classifier ROC curve and the associated AUC and pAUC, the developmental prioritization of sensitivity allowed us to develop a classifier with high NPVs, which allows for the accurate identification of a likely benign lung nodule. However, the emphasis on sensitivity and high NPV throughout the discovery and validation of the classifier’s constituent proteins yielded a specificity ranging from 48% to 20% for NPVs ranging from 84% to 90%, respectively, demonstrating that the classifier may identify approximately half of the lung nodules that are benign. Therefore, a higher probability of an accurate assignment of a nodule as likely benign is accompanied by a lower proportion of nodules with that probability. Clinicians may need to consider this performance compromise for the classifier, not only in comparison with similar issues with other diagnostic modalities, but also with respect to their potential morbidities. In addition, the use of archival samples from academic centers, though representative of the target population, may raise questions about the classifier’s prospective performance in the general population. The Institute of Medicine guidelines recognize and sanction the use of archival biospecimens due to the inherent difficulties in their acquisition and their limited availability.20 This limitation is further mitigated for the validation cohort by the analysis of samples from geographically dispersed centers with diverse patient populations, including two not participating in the classifier’s discovery. Nevertheless, future evaluations of the proteomic expression classifier in prospective lung nodule studies may clarify some of these performance issues. Additional limitations in the study cohort include the relative preponderance of adenocarcinoma among the cancer group, the lack of granuloma histologic subtyping, and the size of the study subcohort demonstrating the lack of an impact of COPD status on classifier scores; however, the number of subjects in the validation compares favorably with other proteomic investigations of COPD biomarkers.45–47
In summary, this work validates the performance of a proteomic classifier that identifies likely benign lung nodules with a high NPV, in patients with a minimum age of 40 who present with a lung nodule 8 to 30 mm in diameter. The data suggest that the classifier may serve as a noninvasive, objective, biology-based, and quantitative diagnostic adjunct to current modalities, such as PET scan, that may help decrease the number of lung nodules categorized as indeterminate and facilitate their diagnostic triage to surveillance imaging. Incorporation of the classifier result early during the initial clinical assessment may provide assurance about the likelihood of a benign etiology, with further reassurance provided by radiographic stability on subsequent chest CT scans. The noninvasive advantage of a blood-based molecular diagnostic test for lung nodules may preclude a diagnostic odyssey7 of successively more invasive procedures, reassure patients and physicians about surveillance decisions, decrease concern and anxiety about malignancy, and mitigate the morbidity and costs associated with biopsies and surgery that unfortunately often lead to benign diagnoses.1
ACKNOWLEDGMENTS
The authors acknowledge the participation of the subjects and clinical research groups at the participating institutions and the contributions of the project teams at Integrated Diagnostics.
Supplementary Material
Footnotes
Disclosure: The authors declare no conflict of interest.
All authors made substantial contributions to the concept and design of the article; the acquisition, analysis, and interpretation of the data; participated in the drafting and revision of the article critically for important intellectual content; and gave their final approval of the version to be published.
Supported by National Institutes of Health grants NCI EDRN 5UO1CA 152662 (P.P.M.), NCI EDRN 5U01CA111295-07 (H.I.P.), NCI 1R21CA156087-01 (A.V.), UO1 CA086137 (W.N.R.), the Stephen A. Banner Lung Cancer Foundation (H.I.P.), and Integrated Diagnostics.
REFERENCES
- 1.Gould MK, Donington J, Lynch WR, et al. Evaluation of individuals with pulmonary nodules: when is it lung cancer? Diagnosis and management of lung cancer, 3rd ed: American College of Chest Physicians evidence-based clinical practice guidelines. Chest. 2013;143(5 Suppl):e93S–120S. doi: 10.1378/chest.12-2351. [DOI] [PMC free article] [PubMed] [Google Scholar]
- 2.Hanash SM, Baik CS, Kallioniemi O. Emerging molecular biomarkers–blood-based strategies to detect and monitor cancer. Nat Rev Clin Oncol. 2011;8:142–150. doi: 10.1038/nrclinonc.2010.220. [DOI] [PubMed] [Google Scholar]
- 3.American Cancer Society. Cancer Facts & Figures 2013. Atlanta: American Cancer Society; 2013. [Google Scholar]
- 4.Slatore CG, Press N, Au DH, Curtis JR, Wiener RS, Ganzini L. What the heck is a “nodule”? A qualitative study of veterans with pulmonary nodules. Ann Am Thorac Soc. 2013;10:330–335. doi: 10.1513/AnnalsATS.201304-080OC. [DOI] [PMC free article] [PubMed] [Google Scholar]
- 5.Wiener RS, Gould MK, Woloshin S, Schwartz LM, Clark JA. What do you mean, a spot?: A qualitative analysis of patients’ reactions to discussions with their doctors about pulmonary nodules. Chest. 2013;143:672–677. doi: 10.1378/chest.12-1095. [DOI] [PMC free article] [PubMed] [Google Scholar]
- 6.Wiener RS, Gould MK, Woloshin S, Schwartz LM, Clark JA. ‘The thing is not knowing’: patients’ perspectives on surveillance of an indeterminate pulmonary nodule. Health Expect. 2012 Dec 16 doi: 10.1111/hex.12036. [Epub ahead of print] [DOI] [PMC free article] [PubMed] [Google Scholar]
- 7.Botkin JR, Teutsch SM, Kaye CI, et al. EGAPP Working Group. Outcomes of interest in evidence-based evaluations of genetic tests. Genet Med. 2010;12:228–235. doi: 10.1097/GIM.0b013e3181cdde04. [DOI] [PubMed] [Google Scholar]
- 8.Midthun DE, Jett JR. Screening for lung cancer: the US studies. J Surg Oncol. 2013;108:275–279. doi: 10.1002/jso.23391. [DOI] [PubMed] [Google Scholar]
- 9.Greenberg AK, Lee MS. Biomarkers for lung cancer: clinical uses. Curr Opin Pulm Med. 2007;13:249–255. doi: 10.1097/MCP.0b013e32819f8f06. [DOI] [PubMed] [Google Scholar]
- 10.Pecot CV, Li M, Zhang XJ, et al. Added value of a serum proteomic signature in the diagnostic evaluation of lung nodules. Cancer Epidemiol Biomarkers Prev. 2012;21:786–792. doi: 10.1158/1055-9965.EPI-11-0932. [DOI] [PMC free article] [PubMed] [Google Scholar]
- 11.Daly S, Rinewalt D, Fhied C, et al. Development and validation of a plasma biomarker panel for discerning clinical significance of indeterminate pulmonary nodules. J Thorac Oncol. 2013;8:31–36. doi: 10.1097/JTO.0b013e31827627f8. [DOI] [PubMed] [Google Scholar]
- 12.Kossenkov AV, Dawany N, Evans TL, et al. Peripheral immune cell gene expression predicts survival of patients with non-small cell lung cancer. PLoS One. 2012;7:e34392. doi: 10.1371/journal.pone.0034392. [DOI] [PMC free article] [PubMed] [Google Scholar]
- 13.Mazzone PJ, Wang XF, Xu Y, et al. Exhaled breath analysis with a colorimetric sensor array for the identification and characterization of lung cancer. J Thorac Oncol. 2012;7:137–42. doi: 10.1097/JTO.0b013e318233d80f. [DOI] [PMC free article] [PubMed] [Google Scholar]
- 14.Boeri M, Verri C, Conte D, et al. MicroRNA signatures in tissues and plasma predict development and prognosis of computed tomography detected lung cancer. Proc Natl Acad Sci U S A. 2011;108:3713–3718. doi: 10.1073/pnas.1100048108. [DOI] [PMC free article] [PubMed] [Google Scholar]
- 15.Lam S, Boyle P, Healey GF, et al. EarlyCDT-Lung: an immunobiomarker test as an aid to early detection of lung cancer. Cancer Prev Res (Phila) 2011;4:1126–1134. doi: 10.1158/1940-6207.CAPR-10-0328. [DOI] [PubMed] [Google Scholar]
- 16.Ostroff RM, Bigbee WL, Franklin W, et al. Unlocking biomarker discovery: large scale application of aptamer proteomic technology for early detection of lung cancer. PLoS One. 2010;5:e15003. doi: 10.1371/journal.pone.0015003. [DOI] [PMC free article] [PubMed] [Google Scholar]
- 17.Hassanein M, Callison JC, Callaway-Lane C, Aldrich MC, Grogan EL, Massion PP. The state of molecular biomarkers for the early detection of lung cancer. Cancer Prev Res (Phila) 2012;5:992–1006. doi: 10.1158/1940-6207.CAPR-11-0441. [DOI] [PMC free article] [PubMed] [Google Scholar]
- 18.Hood LE, Omenn GS, Moritz RL, et al. Workshop Participants. New and improved proteomics technologies for understanding complex biological systems: addressing a grand challenge in the life sciences. Proteomics. 2012;12:2773–2783. doi: 10.1002/pmic.201270086. [DOI] [PMC free article] [PubMed] [Google Scholar]
- 19.Poste G. Bring on the biomarkers. Nature. 2011;469:156–157. doi: 10.1038/469156a. [DOI] [PubMed] [Google Scholar]
- 20.Micheel CM, Nass SJ, Omenn GS, editors. CotRoO-BTfPPOiC, Services BoHC, Policy BoHS. Evolution of Translational Omics: Lessons Learned and the Path Forward. National Academy of Sciences. 2012. [PubMed] [Google Scholar]
- 21.Li XJ, Hayward C, Fong PY, et al. A blood-based proteomic classifier for the molecular characterization of pulmonary nodules. Sci Transl Med. 2013;5:207ra142. doi: 10.1126/scitranslmed.3007013. [DOI] [PMC free article] [PubMed] [Google Scholar]
- 22.Kitteringham NR, Jenkins RE, Lane CS, Elliott VL, Park BK. Multiple reaction monitoring for quantitative biomarker analysis in proteomics and metabolomics. J Chromatogr B Analyt Technol Biomed Life Sci. 2009;877:1229–1239. doi: 10.1016/j.jchromb.2008.11.013. [DOI] [PubMed] [Google Scholar]
- 23.Lange V, Picotti P, Domon B, Aebersold R. Selected reaction monitoring for quantitative proteomics: a tutorial. Mol Syst Biol. 2008;4:222. doi: 10.1038/msb.2008.61. [DOI] [PMC free article] [PubMed] [Google Scholar]
- 24.Bossuyt PM, Reitsma JB, Bruns DE, et al. Towards complete and accurate reporting of studies of diagnostic accuracy: the STARD initiative. Ann Intern Med. 2003;138:40–44. doi: 10.7326/0003-4819-138-1-200301070-00010. [DOI] [PubMed] [Google Scholar]
- 25.Global Strategy for the Diagnosis MaPoCD: Global Initiative for Chronic Obstructive Lung Disease (GOLD) 2013. http://www.goldcopd.org/ [Google Scholar]
- 25a.Li X, Lee LW, Hayward C, et al. An integrated quantification method to increase the precision, robustness, and resolution of protein measurement in human plasma samples. Kearney Clinical Proteomics. 2015;12:3. doi: 10.1186/1559-0275-12-3. [DOI] [PMC free article] [PubMed] [Google Scholar]
- 26.Dodd LE, Pepe MS. Partial AUC estimation and regression. Biometrics. 2003;59:614–623. doi: 10.1111/1541-0420.00071. [DOI] [PubMed] [Google Scholar]
- 27.Dmitrienko A, D’Agostino RB, Sr, Huque MF. Key multiplicity issues in clinical drug development. Stat Med. 2013;32:1079–1111. doi: 10.1002/sim.5642. [DOI] [PubMed] [Google Scholar]
- 28.Dmitrienko A, Tamhane AC, Bretz F. Multiple Testing Problems in Pharmaceutical Statistics. Boca Raton, FL:: Chapman & Hall/CRC; 2010. [Google Scholar]
- 29.Brothers JF, Hijazi K, Mascaux C, El-Zein RA, Spitz MR, Spira A. Bridging the clinical gaps: genetic, epigenetic and transcriptomic biomarkers for the early detection of lung cancer in the post-National Lung Screening Trial era. BMC Med. 2013;11:168. doi: 10.1186/1741-7015-11-168. [DOI] [PMC free article] [PubMed] [Google Scholar]
- 30.Henschke CI, Yip R, Yankelevitz DF, Smith JP International Early Lung Cancer Action Program Investigators. Definition of a positive test result in computed tomography screening for lung cancer: a cohort study. Ann Intern Med. 2013;158:246–252. doi: 10.7326/0003-4819-158-4-201302190-00004. [DOI] [PubMed] [Google Scholar]
- 31.Swensen SJ, Jett JR, Hartman TE, et al. CT screening for lung cancer: five-year prospective experience. Radiology. 2005;235:259–265. doi: 10.1148/radiol.2351041662. [DOI] [PubMed] [Google Scholar]
- 32.Oken MM, Hocking WG, Kvale PA, et al. PLCO Project Team. Screening by chest radiograph and lung cancer mortality: the prostate, lung, colorectal, and ovarian (PLCO) randomized trial. JAMA. 2011;306:1865–1873. doi: 10.1001/jama.2011.1591. [DOI] [PubMed] [Google Scholar]
- 33.Greenberg AK, Lu F, Goldberg JD, et al. CT scan screening for lung cancer: risk factors for nodules and malignancy in a high-risk urban cohort. PLoS One. 2012;7:e39403. doi: 10.1371/journal.pone.0039403. [DOI] [PMC free article] [PubMed] [Google Scholar]
- 34.Church TR, Black WC, Aberle DR, et al. Results of initial low-dose computed tomographic screening for lung cancer. N Engl J Med. 2013;368:1980–1991. doi: 10.1056/NEJMoa1209120. [DOI] [PMC free article] [PubMed] [Google Scholar]
- 35.Nomura A, Stemmermann GN, Chyou PH, Marcus EB, Buist AS. Prospective study of pulmonary function and lung cancer. Am Rev Respir Dis. 1991;144:307–311. doi: 10.1164/ajrccm/144.2.307. [DOI] [PubMed] [Google Scholar]
- 36.Pencina MJ, D’Agostino RB, Sr, D’Agostino RB, Jr, Vasan RS. Evaluating the added predictive ability of a new marker: from area under the ROC curve to reclassification and beyond. Stat Med. 2008;27:157–72; discussion 207. doi: 10.1002/sim.2929. [DOI] [PubMed] [Google Scholar]
- 37.Rho JH, Roehrl MH, Wang JY. Glycoproteomic analysis of human lung adenocarcinomas using glycoarrays and tandem mass spectrometry: differential expression and glycosylation patterns of vimentin and fetuin A isoforms. Protein J. 2009;28:148–160. doi: 10.1007/s10930-009-9177-0. [DOI] [PubMed] [Google Scholar]
- 38.Du S, Guan Z, Hao L, et al. Fructose-bisphosphate aldolase A is a potential metastasis-associated marker of lung squamous cell carcinoma and promotes lung cell tumorigenesis and migration. PLoS One. 2014;9:e85804. doi: 10.1371/journal.pone.0085804. [DOI] [PMC free article] [PubMed] [Google Scholar]
- 39.Iizasa T, Chang H, Suzuki M, et al. Overexpression of collagen XVIII is associated with poor outcome and elevated levels of circulating serum endostatin in non-small cell lung cancer. Clin Cancer Res. 2004;10:5361–5366. doi: 10.1158/1078-0432.CCR-04-0443. [DOI] [PubMed] [Google Scholar]
- 40.Kudriavtseva AV, Anedchenko EA, Oparina NIu, et al. [Expression of FTL and FTH genes encoding ferretin subunits in lung and renal carcinomas]. Mol Biol (Mosk) 2009;43:1044–1054. [PubMed] [Google Scholar]
- 41.Fortuna-Costa A, Gomes AM, Kozlowski EO, Stelling MP, Pavão MS. Extracellular galectin-3 in tumor progression and metastasis. Front Oncol. 2014;4:138. doi: 10.3389/fonc.2014.00138. [DOI] [PMC free article] [PubMed] [Google Scholar]
- 42.Szoke T, Kayser K, Baumhakel JD, et al. Prognostic significance of endogenous adhesion/growth-regulatory lectins in lung cancer. Oncology. 2005;69:167–174. doi: 10.1159/000087841. [DOI] [PubMed] [Google Scholar]
- 43.Baek KH, Bhang D, Zaslavsky A, et al. Thrombospondin-1 mediates oncogenic Ras-induced senescence in premalignant lung tumors. J Clin Invest. 2013;123:4375–4389. doi: 10.1172/JCI67465. [DOI] [PMC free article] [PubMed] [Google Scholar]
- 44.Bigbee WL, Gopalakrishnan V, Weissfeld JL, et al. A multiplexed serum biomarker immunoassay panel discriminates clinical lung cancer patients from high-risk individuals found to be cancer-free by CT screening. J Thorac Oncol. 2012;7:698–708. doi: 10.1097/JTO.0b013e31824ab6b0. [DOI] [PMC free article] [PubMed] [Google Scholar]
- 45.Tu C, Mammen MJ, Li J, et al. Large-scale, ion-current-based proteomics investigation of bronchoalveolar lavage fluid in chronic obstructive pulmonary disease patients. J Proteome Res. 2014;13:627–639. doi: 10.1021/pr4007602. [DOI] [PMC free article] [PubMed] [Google Scholar]
- 46.Röpcke S, Holz O, Lauer G, et al. Repeatability of and relationship between potential COPD biomarkers in bronchoalveolar lavage, bronchial biopsies, serum, and induced sputum. PLoS One. 2012;7:e46207. doi: 10.1371/journal.pone.0046207. [DOI] [PMC free article] [PubMed] [Google Scholar]
- 47.Pastor MD, Nogal A, Molina-Pinelo S, et al. Identification of proteomic signatures associated with lung cancer and COPD. J Proteomics. 2013;89:227–237. doi: 10.1016/j.jprot.2013.04.037. [DOI] [PubMed] [Google Scholar]
- 48.Gould MK, Ananth L, Barnett PG Veterans Affairs SNAP Cooperative Study Group. A clinical model to estimate the pretest probability of lung cancer in patients with solitary pulmonary nodules. Chest. 2007;131:383–388. doi: 10.1378/chest.06-1261. [DOI] [PMC free article] [PubMed] [Google Scholar]