

Abstract
Members of the Mycobacterium terrae complex are slow-growing, non-chromogenic acid-fast bacilli found in the natural environment and occasionally in clinical material. These genetically closely-related members are difficult to differentiate by conventional phenotypic and molecular tests. In this paper we describe the use of whole genome data for the identification of four strains genetically similar to Mycobacterium sp. JDM601, a newly identified member of the M. terrae complex. Phylogenetic information from the alignment of genome-wide orthologous genes and single nucleotide polymorphisms show consistent clustering of the four strains together with M. sp. JDM601 into a distinct clade separate from other rapid and slow growing mycobacterial species. More detailed inter-strain comparisons using average nucleotide identity, tetra-nucleotide frequencies and analysis of synteny indicate that our strains are closely related to but not of the same species as M. sp. JDM601. Besides the 16S rRNA signature described previously for the M. terrae complex, five more hypothetical proteins were found that are potentially useful for the rapid identification of mycobacterial species belonging to the M. terrae complex. This paper illustrates the versatile utilization of whole genome data for the delineation of new bacterial species and introduces four new genomospecies to add to current members in the M. terrae complex.
Introduction
The Mycobacterium terrae complex (MTC) is made up of genetically closely-related slow-growing, nonchromogenic nontuberculous mycobacteria (NTM). This complex has expanded over the years to include M. terrae [1], M. triviale [2], M. nonchromogenicum [3], M. hiberniae [4], M. kumamotonense [5], M. arupense [6], M. senuense [7], M. paraterrae [8], M. sp. JDM601 [9], M. engbaekii [10], M. longobardum [10] and M. heraklionense [10]. Recently, however, M. triviale was excluded from the complex because of notable differences in the 16S rRNA sequence which included the presence of a short helix 18 that is generally considered a signature of rapidly growing mycobacteria [10].
Most MTC members are environmental bacteria of little clinical significance although they have been isolated occasionally from animal hosts [11] and human patients [12]. Nonetheless, in humans, chronic and debilitating infections have been reported [13] and multiple antibiotic resistance has contributed to the therapeutic problems posed by these infections [14].
Species differentiation for the MTC is traditionally based on DNA polymorphism in the 16S rRNA, hsp65 and rpoB genes and in the 16S-23S rRNA internal transcribed spacer [15,16]. With the greater accessibility of whole genome sequencing, however, these single and concatenated gene approaches are being surpassed by the use of whole genome data that can provide more comprehensive information for species and subspecies differentiation and the determining of phylogenetic relationships between bacterial strains. Numerous genome-wide nucleotide and protein-based approaches have been advocated, including the construction of phylogenetic trees based on the occurrence of protein-folds that collectively represent the 3-D structure of an organism [17]. As a result, many genonmospecies sharing a high degree of DNA relatedness have been recognized, leading to a greater appreciation of species complexity and enabling a more accurate definition of species boundaries. Despite technological advances, however, there are still taxonomic ambiguities and difficulties with the separation of strains into distinct taxa.
While conducting a study on the prevalence of tuberculosis in captive elephants [18], we recovered four NTM isolates from elephant trunk wash (UM_ Kg1, UM_Kg17, UM_Kg27, UM_NZ2, hereafter referred to as UM strains). As our routine diagnostic tests identified them variously as different species in the MTC, we analyzed the genomes of these isolates with a combination of different bioinformatics approaches, to study their phylogenetic relationship to M. sp. JDM601, the only member of the M. terrae complex with genome sequence data in the public domain (hereafter referred to as JDM601), as well as to other selected mycobacterial spp.
Material and Methods
Identification of mycobacterial isolates
Elephant trunk wash was collected and processed as described previously [18]. Acid-fast isolates on Middlebrook 7H10 agar were identified as NTM by a negative reaction for M. tuberculosis MPB64 antigen in the Tibilia test (TibiliaTM TB, Genesis, China). For NTM species identification, DNA was extracted by boiling a mycobacterial suspension at 100°C for 30 min. followed by centrifuging at 16,100g for 2 min. The supernatant was used for 16S rRNA-, rpoB- and hsp65-based PCRs as described in Lane [19], Adekambi [20] and Telenti [21], respectively (S1 Table). PCR products were purified using the QIAquick PCR Purification kit (QIAGEN, Germany) and outsourced for Sanger sequencing. The resulting DNA sequences were searched against the NCBI non-redundant (nr) nucleotide database using BLAST web server [22]; hsp65 sequences were further submitted to a Web-accessible database (http://msis.mycobacteria.info) [23]. The most probable species for each isolate was identified based on the nucleotide sequence similarity with reference strains.
Whole genome sequencing
A Nextera DNA sequencing library was prepared according to the Illumina Nextera protocol. In short, 40 ng of genomic DNA was tagged and fragmented using Nextera DNA Sample Prep Kit (Illumina Inc., CA), followed by DNA clean-up using DNA Clean & Concentrator (ZymoResearch, CA). Next, adaptors were added using Nextera Index Kit (Illumina Inc., CA) followed by PCR clean-up using Agencourt AMPure XP (Beckman Coulter, CA). Finally, sequencing was performed using the Illumina HiSeq 2500 system, on rapid run mode.
Raw sequences were subjected to the trimming of adapters and low quality reads based on Q25, using Trimmomatics [24] and Sycthe (https://github.com/vsbuffalo/scythe). SGA [25] was used for error correction and the sequencing quality of the reads was investigated using FastQC [26]. The data were then assembled using CLC Genomics Workbench v.7.0, with kmer size of 45. Only contigs larger than 200bp were used for downstream analysis. Gene prediction was accomplished with Prokaryotic Dynamic Programming Genefinding Algorithm (PRODIGAL) Version 2.60 [27] and the annotation of predicted CDSs was by homology search against the nr database. tRNA and rRNA were predicted using Aragon [28] and RNAmmer [29] respectively.
Phylogenetic and phylogenomic analyses
We constructed Maximum Likelihood (ML) phylogenetic trees based on the 16S rRNA, rpoB and hsp65 genes to study the relationship between the UM strains and other members of the MTC comprising JDM601, M. terrae, M. kumanotonense, M. senuense, M. nonchromogenicum, M. longobardum, M. heraklionense, M. arupense, M. hiberniae and M. engbaekii. The marker gene sequences of UM strains were obtained from their respective genomes, while those of the comparison strains were downloaded from the NCBI taxonomy database. The single gene and supermatrix trees were constructed with 1000 bootstrap replications, using MEGA software [30] version 5.2 with the Hasegawa-Kishino-Yano model for the 16S rRNA tree, the Tamura 3-parameter model for the hsp65 tree, and the Tamura-Nei model for the rpoB and the three gene concatenated trees. Nocardia farcinica (NC_006361) was included as the out-group.
Subsequently, we compared UM strains against mycobacterial spp. with whole genome sequences deposited in the NCBI Genome database up to 9th April 2014. These genomes represent the M. terrae complex (JDM601), rapid-growing mycobacteria (RGM) (M. smegmatis, M. abscessus subsp. bolletii, M. chelonae, M. fortuitum subsp. fortuitum, M. septicum,) and slow-growing mycobacteria (SGM) (M. marinum, M. ulcerans, M. avium subsp. paratuberculosis, M. parascrofulaceum, M. liflandii, M. avium, M. intracellulare) (S2 Table). Four ML trees were constructed based on the full length 16S rRNA, rpoB and hsp65 genes separately and concatenated. All trees were constructed with 1000 bootstrap replications and visualized with MEGA 5.2 software, using the Tamura-Nei model for the 16S rRNA tree and the General Time Reversible model for the rpoB, hsp65 and concatenated trees.
We then made two more comparisons, one using genome-wide orthologous genes and another using a genome alignment-free approach, to find single nucleotide polymorphisms (SNP). For the first approach, the 1084 single copy orthologous CDSs generated from OrthoMCL [31] with expected value of 1e-5 and inflation value of 1.5, were aligned with MUSCLE [32]. After using trimAL [33] to select informative regions, ProtTest [34] was used to select the best fit ML model with the Akaike Information Criterion framework (AIC) [35]. The resulting model (LG+I+G+F) was implemented in PhyML 3.0 [36]] to generate an ML tree with 100 bootstrap replications.
In the SNP-based comparison, our UM genomes together with completed and draft sequences downloaded from GenBank were subjected to a series of preprocessing processes to generate a FASTA input file that is compatible with the analysis software. The kchooser script was used to select an optimum value of k-mer size for the data set. Jellyfish in the kSNP package was used to enumerate a list of k-mers at optimum k-value for each genome in the data set. The sequence variation of the data set was evaluated and the fraction of core-k-mers at optimum k-value was identified. kSNP was used to search for putative SNP loci in the data set and the identified SNP alleles were concatenated into a string. Multiple sequence alignment was produced for each nucleotide in the SNP matrix with MUSCLE. The best fit nucleotides substitution model was tested in MEGA version 5.2 and the Kimura-2 model was selected to generate the ML tree with 100 bootstrap replications.
Inter-strain comparisons with ANI, TETRA, shared gene families and syntenic analysis
To further examine the degree of genetic relatedness between the UM strains and JDM601, we conducted analyses with average nucleotide identity (ANI) [37] and tetra-nucleotide usage patterns, using TETRA (http://www.megx.net/tetra) [38]. To obtain the ANI, all conserved genes between a pair of genomes were determined by whole-genome sequence comparisons using the BLAST algorithm. Genes from the query genome were considered conserved when they had a BLAST match of at least 30% overall sequence identity and the aligned region being at least 70% of its length in the reference genome. Strains sharing more than 94% ANI are considered belonging to the same species. In the TETRA analysis, the correlation indices of the tetra-nucleotide signatures between pair-wise genomic comparisons were calculated. Correlation coefficient values above 0.99 suggest the probability of two strains being from the same species.
In addition, a Venn diagram was drawn to show the degree of gene sharing among the UM strains and JDM601. Homologous genes were identified as genes sharing >50% protein sequence identity. For the analysis of synteny, we used Progressive Mauve software [39] for five-way genome alignments to identify Locally Collinear Blocks (LCBs) representing large scale differences generally due to evolutionary events such as gene loss, rearrangements, duplication, and horizontal transfer. The contigs from UM strains were reordered using JDM601 as the reference. Default parameters were used and alignments were visualized in LCB color scheme.
Signature genes
To identify candidate signatures for the MTC, we looked for conserved genes in selected non-terrae Mycobacterium spp. and contrasted these genes against those that are conserved only in JDM601 and UM strains. With an initial 50% cut-off, 6677 gene clusters were found. After the exclusion of genes not in the M. terrae group (JDM601, UM strains), 160 gene clusters remained. After further bidirectional BLAST searches in the NCBI nr and biocyc (http://biocyc.org/) databases, only five putative protein coding genes remained that are unique to the UM strains and JDM601.
Results
Identification of isolates
The four UM strains were cultured on 7H10 Middlebrook agar. After 8–14 days of incubation at 36°C, smooth to rough, white to pale buff colonies appeared that stained positive for acid-fast bacilli but were negative in the Tibilia test for M. tuberculosis. PCR-sequencing of the 16S rRNA, hsp65 and rpoB genes identified the strains as different members of the MTC (M. arupense, M. engbaekii, M. terrae, M. paraterrae, M. hiberniae and M.sp. F1–10193) with 96–100% sequence similarity (Table 1).
Table 1. Identification of UM strains using marker gene sequences.
| Strain | Growth and colonial morphology on Middlebrook 7H10 agar | hsp65 PCR (440bp) | 16S rRNA PCR (724bp) | rpoB PCR (918bp) |
|---|---|---|---|---|
| UM_Kg1 | Slow; 1mm; non-pigmented; smooth to dry | M. hiberniae (97) | M engbaekii (100) | M engbaekii (98) |
| UM_NZ2 | Intermediate; 5mm; non- pigmented; dry; irregular edge | M. arupense (96) | M. arupense (99) | M. sp. F1–10193* (99) |
| UM_Kg17 | Intermediate; 1mm; smooth-dry; turned pale pink at 3 weeks of incubation | M. arupense (98) | M arupense (99) | ND |
| UM_Kg27 | Intermediate; non-pigmented; 1mm; smooth-dry | M. arupense (96) | M paraterrae (99) | M terrae (99) |
*A new sequevar of the M. terrae complex described by Tortoli et al. [10]
ND, not done
Genome overviews
The number of Illumina sequencing reads generated for the UM genomes ranges from 5,107,720 to 24,102,740, resulting in 192 to 442 contigs with an N50 contig size of 25,337 to 67,651 bp. The genome sizes are from 4.2Mb (UM_Kg17) to 5.1Mb (UM_NZ2), with 67.4–68.5% G+C content. We predicted 3923 to 4811 putative coding sequences and 54 to 64 RNAs (S3 Table).
All four UM strains show two characteristic features that distinguish the SGM from the RGM. Firstly, like other SGM, there appears to be only one copy of the rRNA operon in each UM strain; this is in contrast to M. terrae and JDM601 which were both reported to have two copies of the rRNA operon, despite being slow growers [9]. Secondly, all UM strains show the signature of SGM which is a long version of helix 18 in the 16S rRNA gene [40]. In addition, UM strains have the 2bp insertion in helix 18 (Fig. 1) that has been reported to be unique in the MTC [41].
Fig 1. Secondary structure of 16S rRNA gene showing an extended helix 18 (455th to 477th in the boxed area), in UM strains.

Using the Phage Search Tool (PHAST) web server (http://phast.wishartlab.com) [42], we identified putative prophages in all UM strains. The largest genome, UM_NZ2, carries five prophages which, together, make up 187.6kb (3.7%) of the genome (S4 Table). Biological functions such as secretion, transcription regulation and stress response can be assigned to the genes in all the prophages. However, we failed to identify any match with phages in the PHAST phage library, the NCBI nucleotide database and the Mycobacteriophage Database at http://phagesdb.org/blast/. Thus, the prophages in our UM strains may be novel, a possibility that has to be verified with phage induction and characterization.
Phylogenetic and phylogenomic analyses
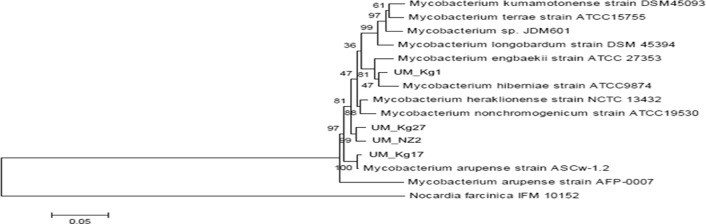
The individual and concatenated phylogenetic trees based on partial sequences of the three marker genes (hsp65, rpoB and 16S rRNA) consistently show the UM strains among members of the MTC (S1–S3 Figs.; Fig. 2; S5–S7 Tables). In the similarity matrix constructed for the 16S rRNA (S5 Table), UM_Kg1 is 100% similar to M. engbaekii ATCC27353, UM_Kg17 is 100% similar to 9 of 10 strains of M. arupense while UM_Kg27 and UM_NZ2 are 99.77% and 99.65% similar to M. paraterrae 052522, respectively. In the concatenated tree (Fig. 2), although the nearest neighbours to UM strains have changed, they are still members of the MTC complex.
Fig 2. Supermatrix phylogenetic tree for members of the M. terrae complex, based on concatenated 16S rRNA, rpoB and hsp65 genes (1931bp).
When compared to other RGM and SGM, using entire marker gene sequences extracted from whole genome data, the four UM strains are invariably clustered with JDM601 in a distinct clade among the SGM species (Fig. 3). Two strains, UM_NZ2 and UM_Kg27, are the closest neighbors in seven of the eight trees constructed, suggesting a high possibility that they may belong to the same species.
Fig 3. Phylogenetic trees to show the relationship of UM strains with SGM and RGM spp.

based on A) the 16S rRNA gene; B) the hsp65 gene; C) the rpoB gene; and D) concatenation of 16S rRNA, hsp65 and rpoB genes. RGMs are indicated by an *.
The clustering of UM strains and JDM601 is again obvious in the trees constructed with orthologs and SNPs. Both trees show almost identical topology, indicating a high concordance in the amino acid and nucleotide sequences of the species under study (Fig. 4).
Fig 4. Phylogenetic trees based on whole genome sequences.

A) constructed with genomic orthologous genes; B) constructed with genome-wide SNPs.
Further inter-strain comparisons
While the phylogenetic and phylogenomic analyses suggest that the UM strains are different genomospecies in the MTC, further inter-strain comparisons are necessary to refine their taxonomic relationships. For this purpose, we used the ANI together with TETRA. Unfortunately, although the tetranucleotide frequency correlation coefficients (Table 2) indicate a strong likelihood that the UM strains and JDM601 all belong to the same species, the ANI values are all below the 94% threshold for strains to be classified as belonging to the same species (Table 3). As in the phylogenetic analysis, UM_NZ2 and UM_Kg27 appear to be the most closely-related genetically, sharing the highest ANI (91.76%) and TETRA (0.99799) values.
Table 2. Results of TETRA analysis for UM strains and JDM601.
| Tetranucleotide frequency correlation coefficient values | |||||
|---|---|---|---|---|---|
| JDM601 | UM_Kg17 | UM_Kg1 | UM_Kg27 | UM_NZ2 | |
| JDM601 | --- | 0.9912 | 0.99174 | 0.99404 | 0.99259 |
| UM_Kg17 | 0.9912 | --- | 0.9908 | 0.99371 | 0.99273 |
| UM_Kg1 | 0.99174 | 0.9908 | --- | 0.9946 | 0.99164 |
| UM_Kg27 | 0.99404 | 0.99371 | 0.9946 | --- | 0.99799 |
| UM_NZ2 | 0.99259 | 0.99273 | 0.99164 | 0.99799 | --- |
Table 3. Results of ANI analysis for UM strains and JDM601.
| ANI values in percentage (%) | |||||
|---|---|---|---|---|---|
| JDM601 | UM_Kg17 | UM_Kg1 | UM_Kg27 | UM_NZ2 | |
| JDM601 | --- | 84.77 | 85.2 | 85.49 | 85.53 |
| UM_Kg17 | 84.93 | --- | 85.89 | 86.81 | 86.64 |
| UM_Kg1 | 85.2 | 85.47 | --- | 86.65 | 86.76 |
| UM_Kg27 | 85.5 | 86.54 | 86.65 | --- | 91.75 |
| UM_NZ2 | 85.54 | 86.39 | 86.76 | 91.76 | --- |
The Venn diagram constructed for the four UM strains and JDM601 show them sharing a large number of gene families (Fig. 5). More than half (2665 of 5035 gene families) are identified as the core genome, 2144–2334 (42.6–46.4%) are shared with at least one other strain and only 36–226 (0.7–6.7%) appear to be strain-specific. The UM strains share 58.4% (UM_Kg17) to 66.9% (UM_NZ2) of their genes with JDM601, and 60.6% to 71.1% among themselves (Fig. 5). The two genomes sharing the highest ANI and TETRA values (UM_NZ2 and UM_Kg27) show the greatest (71.1%) identity in gene families. Likewise, JDM and UM_Kg17 share the lowest ANI (84.77%) as well as the lowest gene family identity (58.4%).
Fig 5. Venn diagram for the genomes of UM strains and JDM601, showing shared and strain-specific genes.

Syntenic analysis for the UM strains and JDM601 show putative homologous matches over much of the genome sequences compared (48% to 62% of the JDM601 genome appear conserved in the UM strains), suggesting a high degree of gene-order conservation (Fig. 6). Nevertheless, a number of prominent variations are seen that suggest horizontal gene transfers and other events of evolutionary change. Although the four UM strains are more syntenic to one another than to JDM601, variations are still seen among them, such as translocations and inverted sequences in UM_Kg27 and UM_NZ2. The prophage regions we identified appear as genome-specific sequences, indicating that horizontal transfers occurred after the separation of UM strains from the progenitor of the MTC.
Fig 6. Multiple sequence alignment of UM strains and JDM601, using Progressive MAUVE and default parameters.

Coloured blocks are collinear and homologous regions. Non-coloured areas are unaligned sequences that may be genome-specific. Inverted regions are shown as blocks below a genome’s centre line.
Candidate M. terrae signatures
Phylogenetically-related genomes have been observed to share similar genomic signatures. Among the M. terrae complex, a 2bp addition to the long helix 18 in the 16S rRNA has been reported to be specific to members of this complex [41]. We used other conserved genomic regions in our search for additional signatures and found five predicted protein coding sequences in UM strains and JDM601 that are not observed in selected non-terrae mycobacterial spp. (Table 4). These hypothetical proteins are potentially useful as diagnostic markers for the determination of species in the M. terrae complex and for the rapid detection of these species in a mixed bacterial community.
Table 4. Amino acid and corresponding nucleotide sequences for candidate M. terrae signatures.
| Gene | Sequence |
|---|---|
| JDM601_0345 | MAGVIAALACTLGCCLPAILVALGVGASGAAGMGHAAHGAGESRGALLDLLHRVSPALLIASIALVAGAFAMRRRAAVLPALLAGVVLYLSVHGQTDPAVMYAGMAIGYGVWIGLYFWTRRSAQACEHEAGGVGAEVGAAHREPPIDPVQGQ |
| GTGGCGGGCGTTATCGCCGCACTGGCCTGCACGCTGGGGTGCTGCCTGCCGGCGATCCTGGTGGCACTCGGGGTCGGCGCATCCGGGGCCGCAGGCATGGGCCATGCGGCGCACGGCGCCGGTGAGTCTCGGGGCGCCCTGCTCGACCTGTTGCACCGGGTCAGCCCGGCGCTGCTGATCGCGTCGATCGCGCTGGTCGCCGGCGCATTCGCTCGACCTGTTGCACCGGGTCAGCCCGGCGCTGCTGATCGCGTCGATCGCGCTGGTCGCCGGCGCATTCGCGATGAGGCGACGCGCGGCGGTGCTGCCCGCGCTGTTGGCCGGGGTCGTGTTGTACCTCAGCGTTCACGGTCAGACCGATCCCGCCGTGATGTATGCCGGTATGGCCATCGGCTACGGCGTCTGGATCGGCCTCTATTTCTGGACGCGCCGGTCAGCCCAGGCCTGCGAGCACGAGGCGGGTGGCGTAGGCGCCGAGGTCGGCGCGGCTCACCGGGAGCCGCCCATCGACCCGGTCCAGGGTCAGTGA | |
| JDM601_0373 | MLALSCCLLAAPAAHADFDDLLDTLLGAGVDVDPGALPADSADIGDLGVLQDPLSQLDQLFHDSPSSADGTPEEPAEPAPEAPTDDPSDSTAGGEHSSESGGSNNLPSLPKFGMPGSGSGGSGGGPGGGSGGGPGGSSPGAAKTKANTSGSNGTGGAPVTPAPQR |
| GTGTTGGCGTTGAGTTGCTGCCTGCTGGCCGCGCCGGCCGCGCATGCCGACTTCGACGACCTGCTCGACACCCTGCTCGGCGCCGGTGTCGATGTGGACCCGGGCGCTCTGCCGGCAGATTCGGCCGATATCGGCGACCTCGGTGTCCTGCAGGACCCGCTGAGCCAGCTCGACCAGTTGTTCCACGACTCGCCGAGCTCCGCCGACGGCACTCCCGAGGAGCCCGCCGAGCCGGCCCCCGAAGCGCCGACCGACGACCCGTCCGACTCGACCGCGGGTGGCGAACACAGCAGCGAGAGCGGCGGTTCCAACAACCTGCCGAGCCTGCCGAAGTTCGGCATGCCCGGCAGCGGCTCCGGCGGCAGCGGTGGCGGCCCCGGCGGCGGCAGCGGCGGCGGACCCGGCGGTTCCAGCCCGGGCGCCGCGAAGACCAAGGCCAACACCAGCGGCAGCAACGGCACCGGCGGCGCGCCGGTGACGCCGGCCCCACAGCGGTAA | |
| JDM601_1987 | MSRIRKYLTVAAGAAAGLFLGALASSSAATADTAPINPGLPGVVEQMVASSTAIPQQLLQTTTSALSGTPLAPAASPAQSPIATATLNVPQTTTPASQPTGLPGLSGLPANLSSVLPFPMPNFGGTTPVAAAPTTMVPGAFAPTAPVTPMEVMLIPGLP |
| ATGTCACGAATCCGTAAGTACCTCACCGTTGCGGCCGGCGCCGCCGCGGGACTGTTCCTGGGGGCACTCGCGTCCAGCAGCGCCGCCACCGCGGACACCGCTCCGATCAACCCGGGGCTGCCCGGTGTGGTCGAGCAGATGGTCGCGTCCTCGACGGCCATTCCGCAGCAGTTACTGCAGACCACCACCTCCGCCCTGAGTGGAACGCCGCTGGCGCCCGCCGCGTCGCCGGCGCAGTCACCGATCGCCACCGCCACACTCAACGTGCCGCAGACCACGACGCCGGCCAGCCAGCCCACCGGCCTGCCCGGGCTGTCCGGTCTCCCGGCCAACCTGAGTTCGGTGCTGCCGTTCCCGATGCCGAACTTCGGCGGCACGACACCGGTGGCGGCCGCACCGACCACGATGGTCCCCGGCGCCTTCGCGCCGACGGCTCCGGTGACGCCGATGGAGGTCATGCTGATTCCCGGCTTGCCCTGA | |
| JDM601_2719 | MNATLRPFALAGAAIIGATAIAATPVVVVPVSVPTPVIELTADAGGAFEGALGSLGDSLGNLLSSLDLSEILGDLFSNLNLSEIFGDFFANLNLSEMFGDFFANFDLSGIFTGITDFFANFDLSGIFTGITDFFANFDLSGIFTGITDFFADFDLSGIFTGITDFFADFDLSGIFTGLGDFFADFDLSELLGGLDLSGLLDDLFGGL |
| ATGAACGCCACCCTTCGTCCGTTTGCCCTGGCGGGCGCCGCGATCATCGGCGCCACCGCAATCGCCGCCACACCCGTGGTGGTCGTACCCGTGAGCGTGCCGACACCGGTCATCGAGCTCACTGCCGACGCCGGCGGCGCGTTCGAGGGTGCGCTCGGCTCGCTCGGCGACAGTTTGGGCAACCTGCTGAGCAGCCTGGATCTGTCGGAGATCCTGGGCGACCTCTTCAGCAACCTGAATCTGTCGGAGATCTTCGGCGACTTCTTCGCCAACCTGAATCTGTCCGAAATGTTCGGCGACTTCTTCGCCAACTTCGACCTGTCGGGCATCTTCACCGGCATCACCGACTTCTTCGCCAACTTCGACCTGTCGGGCATCTTCACCGGCATCACCGACTTCTTCGCCAACTTCGACCTGTCGGGCATCTTCACCGGCATCACCGACTTCTTCGCCGACTTCGACCTGTCGGGCATCTTCACCGGCATCACCGACTTCTTCGCCGACTTCGACCTGTCGGGCATCTTCACCGGCCTCGGCGACTTCTTCGCCGACTTCGACCTGTCGGAGCTCCTGGGCGGCCTGGATCTGTCCGGCTTGCTCGACGACCTGTTCGGCGGTCTGTAA | |
| JDM601_3872 | MAYADEPTLAAEQQAAEQQAAAEQQVAEQHAEQATTAGATTAGAGGMGASIGSSMAMMGPMMAMYAPMMLAPMLMSGVTSLVGGAPATGAEAASAAATDFAGSAAATDAWGLAAPIASDLANLDLTLDPDVLTGALTDTGAMLGADVADATADAAGQAAADLAGQTAADTAGDLAASLGGELPGIAAETGVNVGGEIACGIIGGIFGVC |
| TTGGCGTACGCCGATGAGCCGACGCTGGCCGCTGAGCAGCAGGCGGCTGAGCAGCAGGCAGCAGCCGAGCAGCAGGTAGCCGAGCAGCACGCCGAGCAGGCCACCACGGCGGGTGCCACGACCGCCGGCGCCGGCGGCATGGGCGCCTCCATCGGCAGCTCGATGGCGATGATGGGCCCGATGATGGCGATGTACGCGCCCATGATGCTCGCACCGATGCTGATGTCGGGTGTGACCAGTCTTGTCGGGGGAGCCCCGGCCACCGGCGCGGAGGCCGCTTCGGCCGCGGCTACGGATTTCGCCGGTTCGGCGGCGGCCACCGACGCCTGGGGCCTGGCGGCTCCGATCGCCAGTGACCTGGCCAATCTCGATCTGACCCTCGACCCTGACGTGTTGACGGGTGCGCTCACCGACACCGGTGCCATGCTGGGCGCCGACGTTGCCGACGCTACGGCCGATGCCGCCGGCCAGGCGGCCGCGGATCTGGCCGGCCAGACCGCGGCCGACACCGCGGGCGACCTTGCCGCCAGCCTGGGCGGCGAGCTGCCGGGAATCGCCGCCGAAACCGGCGTGAACGTCGGTGGCGAGATCGCCTGCGGCATCATCGGCGGCATCTTCGGCGTCTGCTGA |
Discussion
Whole genome shotgun sequencing (WGS) is making inroads into clinical microbiology with the promise of unlimited genetic information for the identification and characterization of pathogens as well as the prediction of resistance to antimicrobials. The success of WGS-based diagnostics will depend very much on the availability, size and quality of genomic databases. Unfortunately, for many bacterial taxa, there are still too few genomes to provide a comprehensive database for accurate pathogen recognition and analysis.
In this study, we used different approaches to determine the taxonomic status of four strains of RGM which we were unable to resolve into definite species with conventional tests. The results indicated a high degree of consistency but also some discrepancies with the use of different analytical methods. With our routine diagnostic partial sequencing of the 16S rRNA, hsp65 and rpoB genes, each of the four strains had more than one species identification, albeit, all from the MTC. Their species designation is largely supported by our concatenated gene-based phylogenetic analysis for representative members of the MTC. With WGS, we were able to extract full length marker gene sequences as well as genome-wide orthologous genes and SNPs for the comparison of phylogeny. Our results showed a consistent clustering of UM strains with JDM601, and, at 100% coverage (1523bp), all four UM strains shared about 98% 16S rRNA sequence identity with JDM601. These results are suggestive of the UM strains being subspecies of JDM601. This possibility is also indicated by the TETRA correlation coefficients which are all over 0.99. However, the ANI values which are all below 94%, indicate that there ought to be five different species assignments for the five strains.
The ANI has been recognized to be one of the most reliable measurements of genomic relatedness between bacterial strains. The ANI threshold range (95–96%) for species demarcation previously set by comparison with DNA-DNA hybridization (DDH) values, was confirmed by Kim et al. [43] who investigated the distribution of ANI values in over six thousand prokaryotic genomes. These authors also showed, with over a million comparisons, that this ANI threshold corresponds to 98.65% 16S rRNA sequence similarity. Nonetheless, exceptions to the rule do occur. It has been reported that even strains showing close to 100% 16S rRNA identity can be assigned to different species [44] and conversely, at the 94% ANI cutoff, many species could share less than 90% of their genes [45].
Oligonucleotide frequencies within DNA sequences are known to exhibit species-specific patterns [46]. TETRA analyzes tetranucleotide usage patterns in genomic fragments. This method of analysis has been reported to be more reliable than the G+C content as a measure of sequence relatedness and is useful not only for the classification of bacteria, but also for the estimation of phylogenetic relationships among closely related species [47]. Furthermore, since oligonucleotide frequency can be determined without the need for multiple alignments of homologous sequences, it can be applied on genomes that have not been previously aligned and annotated.
A comparison of four members of the M. tuberculosis complex (M. tuberculosis, M. africanum, M. canettii and M. bovis) showed the expected agreement of ANI (>97%) and TETRA (0.99965–0.99994) values (data not shown). A possible explanation for the discrepancy between the results of our ANI and TETRA analyses for UM strains is the hypothesis that closely-related bacteria, subjected to the same environmental pressures in a complex habitat, can evolve to different species without losing their genetic signatures. Foerstner et al. [48] observed distinct and narrow G+C distributions among closely-related bacterial sequences present in the same environment, in contrast to a wider range of G+C content among closely-related sequences from different environments. They attributed this difference in G+C content to the influence of external environmental factors on the nucleotide compositions of co-evolving bacteria in a bacterial community. Konstantinidis and Tiedje [45] similarly postulated that differences in the ecology of bacterial strains can lead to differences in the conserved gene content among strains in the same species. Although our UM strains are all isolated from elephant trunk wash, the elephant hosts are from different countries of origin and are maintained in different conservation centres. It is possible that the UM strains, in their respective ecological niches, underwent genome size expansion and genome diversification by acquiring foreign sequences like prophages, but still retained their MTC-specific tetranucleotide signature.
Bacterial identification and pathogen detection are essential for the correct diagnosis and treatment of infections. Molecular diagnostic laboratories have long depended on 16S rRNA sequences for pathogen identification. Our results reaffirm the inadequacy of the single gene approach and illustrate the advantages of using genome-based methods that allow multifaceted characterization of strains and exhaustive inter-strain comparisons for more reliable species and subspecies definition. Comparative genomic analysis of the MTC is currently limited by the scarcity of published genomic sequences. With the introduction of four new genomospecies and five potential genetic signatures, we are enlarging the MTC database for future analyses. Before whole genome sequencing becomes affordable for the routine diagnostic service, PCR assays based on marker genes, such as the MTC signatures identified in this study, can be implemented easily for the rapid identification of bacterial pathogens in clinical specimens.
Nucleotide Sequence Accession Numbers
The GenBank database accession numbers for UM strains are:
Mycobacterium sp. UM_Kg1 JRMK00000000
Mycobacterium sp. UM_Kg17 JRML00000000
Mycobacterium sp. UM_Kg27 JRMM00000000
Mycobacterium sp. UM_NZ2 JRMN00000000
Supporting Information
(TIF)
(TIF)
(TIF)
(DOCX)
(DOCX)
(DOCX)
(DOCX)
(DOCX)
(DOCX)
(DOCX)
Acknowledgments
The authors are grateful to Professor Yong Hoi Sen from the University of Malaya for valuable suggestions.
Data Availability
The GenBank database accession numbers for UM strains are: Mycobacterium sp. UM_Kg1 JRMK00000000; Mycobacterium sp. UM_Kg17 JRML00000000; Mycobacterium sp. UM_Kg27 JRMM00000000; Mycobacterium sp. UM_NZ2 JRMN00000000.
Funding Statement
This work was supported by research grant UM.C/625/1/HIR/MOHE/CHAN/14/4 (account number: H50001-00-A000038) from the High Impact Research (http://www.hir.um.edu.my/), University of Malaya, Kuala Lumpur, Malaysia. YFN received the funding. The funders had no role in study design, data collection and analysis, decision to publish, or preparation of the manuscript.
References
- 1. Richmond L, Cimmings MM (1950) An evaluation of methods of testing the virulence of acid-fast bacilli. Am Rev Tuberc 62: 632–637. Available: http://www.ncbi.nlm.nih.gov/pubmed/14799779. Accessed 2014 Oct 8. [DOI] [PubMed] [Google Scholar]
- 2. Kubica GP, Silcox VA, Kilburn JO, Smithwick RW, Beam RE, Jones WD, et al. (1970) Differential identification of mycobacteria VI. Mycobacterium triviale Kubica sp. nov. Int J Syst Bacteriol 20: 161–174. Available: http://ijs.sgmjournals.org/content/20/2/161.abstract. Accessed 2014 Oct 8. [Google Scholar]
- 3. Tsukamura M, Kita N, Otsuka W, Shimoide H (1983) A study of the taxonomy of the Mycobacterium nonchromogenicum complex and report of six cases of lung infection due to Mycobacterium nonchromogenicum. Microbiol Immunol 27: 219–236. Available: http://www.ncbi.nlm.nih.gov/pubmed/6877101. Accessed 2014 Oct 8. [DOI] [PubMed] [Google Scholar]
- 4. Kazda J, Cooney R, Monaghan M, Quinn PJ, Stackebrandt E, Dorsch M, et al. (1993) Mycobacterium hiberniae sp. nov. Int J Syst Bacteriol 43: 352–357. Available: http://www.ncbi.nlm.nih.gov/pubmed/7684243. Accessed 2014 Oct 8. [DOI] [PubMed] [Google Scholar]
- 5. Masaki T, Ohkusu K, Hata H, Fujiwara N, Iihara H, Yamada-Noda M, et al. (2006) Mycobacterium kumamotonense Sp. Nov. Recovered from Clinical Specimen and the First Isolation Report of Mycobacterium arupense in Japan: Novel Slowly Growing, Nonchromogenic Clinical Isolates Related to Mycobacterium terrae Complex. Microbiol Immunol 50: 889–897. Available: http://doi.wiley.com/10.1111/j.1348-0421.2006.tb03865.x. Accessed 2014 Oct 8. [DOI] [PubMed] [Google Scholar]
- 6. Cloud JL, Meyer JJ, Pounder JI, Jost KC, Sweeney A, Carroll KC, et al. (2006) Mycobacterium arupense sp. nov., a non-chromogenic bacterium isolated from clinical specimens. Int J Syst Evol Microbiol 56: 1413–1418. Available: http://www.ncbi.nlm.nih.gov/pubmed/16738122. Accessed 2014 Oct 8. [DOI] [PubMed] [Google Scholar]
- 7. Mun H-S, Park J-H, Kim H, Yu H-K, Park Y-G, Cha CY, et al. (2008) Mycobacterium senuense sp. nov., a slowly growing, non-chromogenic species closely related to the Mycobacterium terrae complex. Int J Syst Evol Microbiol 58: 641–646. Available: http://www.ncbi.nlm.nih.gov/pubmed/18319471. Accessed 2014 Oct 8. 10.1099/ijs.0.65374-0 [DOI] [PubMed] [Google Scholar]
- 8. Lee H, Lee S-A, Lee I-K, Yu H-K, Park Y-G, Jeong J, et al. (2010) Mycobacterium paraterrae sp. nov. recovered from a clinical specimen: novel chromogenic slow growing mycobacteria related to Mycobacterium terrae complex. Microbiol Immunol 54: 46–53. Available: http://www.ncbi.nlm.nih.gov/pubmed/20055942. Accessed 2014 Sep 29. 10.1111/j.1348-0421.2009.00184.x [DOI] [PubMed] [Google Scholar]
- 9. Zhang Z-Y, Sun Z-Q, Wang Z-L, Wen Z-L, Sun Q-W, Zhu Z-Q, et al. (2011) Complete genome sequence of a novel clinical isolate, the nontuberculous Mycobacterium strain JDM601. J Bacteriol 193: 4300–4301. Available: http://jb.asm.org/content/193/16/4300.full. Accessed 2014 Oct 8. 10.1128/JB.05291-11 [DOI] [PMC free article] [PubMed] [Google Scholar]
- 10. Tortoli E, Gitti Z, Klenk H-P, Lauria S, Mannino R, Mantegani P, et al. (2013) Survey of 150 strains belonging to the Mycobacterium terrae complex and description of Mycobacterium engbaekii sp. nov., Mycobacterium heraklionense sp. nov. and Mycobacterium longobardum sp. nov. Int J Syst Evol Microbiol 63: 401–411. Available: http://www.ncbi.nlm.nih.gov/pubmed/22447702. Accessed 2014 Oct 8. 10.1099/ijs.0.038737-0 [DOI] [PubMed] [Google Scholar]
- 11. Tasler GRW, Hartley WJ (1981) Foal Abortion Associated with Mycobacterium terrae Infection. Vet Pathol 18: 122–125. Available: http://vet.sagepub.com/content/18/1/122.refs. Accessed 2014 Oct 8. [DOI] [PubMed] [Google Scholar]
- 12. Smith DS, Lindholm-Levy P, Huitt GA, Heifets LB, Cook JL (2000) Mycobacterium terrae: case reports, literature review, and in vitro antibiotic susceptibility testing. Clin Infect Dis 30: 444–453. Available: http://www.ncbi.nlm.nih.gov/pubmed/10722426. Accessed 2014 Oct 8. [DOI] [PubMed] [Google Scholar]
- 13. Milne BW, Arnold MH, Hudson B, Coolican MRJ (2009) Infectious arthritis of the knee caused by Mycobacterium terrae: a case report. J Orthop Surg (Hong Kong) 17: 103–108. Available: http://www.ncbi.nlm.nih.gov/pubmed/19398805. Accessed 2014 Oct 8. [DOI] [PubMed] [Google Scholar]
- 14. Zhang Z-Y, Sun Z-Q, Wang Z-L, Hu H-R, Wen Z-L, Song Y-Z, et al. (2013) Identification and pathogenicity analysis of a novel non-tuberculous mycobacterium clinical isolate with nine-antibiotic resistance. Clin Microbiol Infect 19: 91–96. Available: http://www.ncbi.nlm.nih.gov/pubmed/22439981. Accessed 2014 Oct 8. 10.1111/j.1469-0691.2012.03818.x [DOI] [PubMed] [Google Scholar]
- 15. Tortoli E (2012) Phylogeny of the genus Mycobacterium: many doubts, few certainties. Infect Genet Evol 12: 827–831. Available: http://www.ncbi.nlm.nih.gov/pubmed/21684354. Accessed 2014 Oct 6. 10.1016/j.meegid.2011.05.025 [DOI] [PubMed] [Google Scholar]
- 16. Roth A, Fischer M, Hamid ME, Michalke S, Ludwig W, Mauch H (1998) Differentiation of phylogenetically related slowly growing mycobacteria based on 16S-23S rRNA gene internal transcribed spacer sequences. J Clin Microbiol 36: 139–147. Available: http://www.pubmedcentral.nih.gov/articlerender.fcgi?artid=124824&tool=pmcentrez&rendertype=abstract. Accessed 2014 Oct 8. [DOI] [PMC free article] [PubMed] [Google Scholar]
- 17. Lin J, Gerstein M (2000) Whole-genome trees based on the occurrence of folds and orthologs: implications for comparing genomes on different levels. Genome Res 10: 808–818. Available: http://www.pubmedcentral.nih.gov/articlerender.fcgi?artid=10900&tool=pmcentrez&rendertype=abstract. Accessed 2014 Oct 9. [DOI] [PMC free article] [PubMed] [Google Scholar]
- 18. Ong BL, Ngeow YF, Razak MFAA, Yakubu Y, Zakaria Z, Mutalib AR, et al. (2013) Tuberculosis in captive Asian elephants (Elephas maximus) in Peninsular Malaysia. Epidemiol Infect 141: 1481–1487. Available: http://www.ncbi.nlm.nih.gov/pubmed/23414617. Accessed 2014 Sep 16. 10.1017/S0950268813000265 [DOI] [PMC free article] [PubMed] [Google Scholar]
- 19. Lane DJ (1991) 16S/23S rDNA sequencing Stackebrandt E. and Goodfellow M., Nucleic acid techniques in bacterial systematics. Wiley; pp. 115–175. [Google Scholar]
- 20. Adékambi T, Colson P, Drancourt M (2003) rpoB-based identification of nonpigmented and late-pigmenting rapidly growing mycobacteria. J Clin Microbiol 41: 5699–5708. Available: http://www.pubmedcentral.nih.gov/articlerender.fcgi?artid=308974&tool=pmcentrez&rendertype=abstract. Accessed 2014 Oct 8. [DOI] [PMC free article] [PubMed] [Google Scholar]
- 21. Telenti A, Marchesi F, Balz M, Bally F, Böttger EC, Bodmer T (1993) Rapid identification of mycobacteria to the species level by polymerase chain reaction and restriction enzyme analysis. J Clin Microbiol 31: 175–178. Available: http://www.pubmedcentral.nih.gov/articlerender.fcgi?artid=262730&tool=pmcentrez&rendertype=abstract. Accessed 2014 Oct 8. [DOI] [PMC free article] [PubMed] [Google Scholar]
- 22. Altschul SF, Gish W, Miller W, Myers EW, Lipman DJ (1990) Basic local alignment search tool. J Mol Biol 215: 403–410. Available: http://www.sciencedirect.com/science/article/pii/S0022283605803602. Accessed 2014 Jul 10. [DOI] [PubMed] [Google Scholar]
- 23. Dai J, Chen Y, Lauzardo M (2011) Web-accessible database of hsp65 sequences from Mycobacterium reference strains. J Clin Microbiol 49: 2296–2303. Available: http://jcm.asm.org/content/49/6/2296.abstract. Accessed 2014 Oct 9. 10.1128/JCM.02602-10 [DOI] [PMC free article] [PubMed] [Google Scholar]
- 24. Bolger AM, Lohse M, Usadel B (2014) Trimmomatic: a flexible trimmer for Illumina sequence data. Bioinformatics 30: 2114–2120. Available: http://www.pubmedcentral.nih.gov/articlerender.fcgi?artid=4103590&tool=pmcentrez&rendertype=abstract. Accessed 2014 Jul 9. 10.1093/bioinformatics/btu170 [DOI] [PMC free article] [PubMed] [Google Scholar]
- 25. Simpson JT, Durbin R (2010) Efficient construction of an assembly string graph using the FM-index. Bioinformatics 26: i367–73. Available: http://www.pubmedcentral.nih.gov/articlerender.fcgi?artid=2881401&tool=pmcentrez&rendertype=abstract. Accessed 2014 Sep 4. 10.1093/bioinformatics/btq217 [DOI] [PMC free article] [PubMed] [Google Scholar]
- 26. Andrews S (2010) FastQC: A Quality Control tool for High Throughput Sequence Data. Available: http://www.bioinformatics.babraham.ac.uk/projects/fastqc/. Accessed 2014 Oct 8. [Google Scholar]
- 27. Hyatt D, Chen G-L, Locascio PF, Land ML, Larimer FW, Hauser LJ (2010) Prodigal: prokaryotic gene recognition and translation initiation site identification. BMC Bioinformatics 11: 119 Available: http://www.biomedcentral.com/1471-2105/11/119. Accessed 2014 Sep 5. 10.1186/1471-2105-11-119 [DOI] [PMC free article] [PubMed] [Google Scholar]
- 28. Laslett D, Canback B (2004) ARAGORN, a program to detect tRNA genes and tmRNA genes in nucleotide sequences. Nucleic Acids Res 32: 11–16. Available: http://www.pubmedcentral.nih.gov/articlerender.fcgi?artid=373265&tool=pmcentrez&rendertype=abstract. Accessed 2014 Nov 23. [DOI] [PMC free article] [PubMed] [Google Scholar]
- 29. Lagesen K, Hallin P, Rødland EA, Staerfeldt H-H, Rognes T, Ussery DW (2007) RNAmmer: consistent and rapid annotation of ribosomal RNA genes. Nucleic Acids Res 35: 3100–3108. Available: http://www.pubmedcentral.nih.gov/articlerender.fcgi?artid=1888812&tool=pmcentrez&rendertype=abstract. Accessed 2014 Nov 25. [DOI] [PMC free article] [PubMed] [Google Scholar]
- 30. Tamura K, Peterson D, Peterson N, Stecher G, Nei M, Kumar S (2011) MEGA5: molecular evolutionary genetics analysis using maximum likelihood, evolutionary distance, and maximum parsimony methods. Mol Biol Evol 28: 2731–2739. Available: http://www.pubmedcentral.nih.gov/articlerender.fcgi?artid=3203626&tool=pmcentrez&rendertype=abstract. Accessed 2014 Jul 9. 10.1093/molbev/msr121 [DOI] [PMC free article] [PubMed] [Google Scholar]
- 31. Chen F, Mackey AJ, Stoeckert CJ, Roos DS (2006) OrthoMCL-DB: querying a comprehensive multi-species collection of ortholog groups. Nucleic Acids Res 34: D363–8. Available: http://www.pubmedcentral.nih.gov/articlerender.fcgi?artid=1347485&tool=pmcentrez&rendertype=abstract. Accessed 2014 Sep 14. [DOI] [PMC free article] [PubMed] [Google Scholar]
- 32. Edgar RC (2004) MUSCLE: multiple sequence alignment with high accuracy and high throughput. Nucleic Acids Res 32: 1792–1797. Available: http://www.pubmedcentral.nih.gov/articlerender.fcgi?artid=390337&tool=pmcentrez&rendertype=abstract. Accessed 2014 Jul 11. [DOI] [PMC free article] [PubMed] [Google Scholar]
- 33. Capella-Gutiérrez S, Silla-Martínez JM, Gabaldón T (2009) trimAl: a tool for automated alignment trimming in large-scale phylogenetic analyses. Bioinformatics 25: 1972–1973. Available: http://www.pubmedcentral.nih.gov/articlerender.fcgi?artid=2712344&tool=pmcentrez&rendertype=abstract. Accessed 2014 Jul 25. 10.1093/bioinformatics/btp348 [DOI] [PMC free article] [PubMed] [Google Scholar]
- 34. Darriba D, Taboada GL, Doallo R, Posada D (2011) ProtTest 3: fast selection of best-fit models of protein evolution. Bioinformatics 27: 1164–1165. Available: http://www.ncbi.nlm.nih.gov/pubmed/21335321. Accessed 2014 Sep 21. 10.1093/bioinformatics/btr088 [DOI] [PMC free article] [PubMed] [Google Scholar]
- 35. Akaike H (1974) A new look at the statistical model identification. IEEE Trans Automat Contr 19: 716–723. Available: http://ieeexplore.ieee.org/articleDetails.jsp?arnumber=1100705. Accessed 2014 Jul 12. [Google Scholar]
- 36. Guindon S, Gascuel O (2003) A simple, fast, and accurate algorithm to estimate large phylogenies by maximum likelihood. Syst Biol 52: 696–704. Available: http://www.ncbi.nlm.nih.gov/pubmed/14530136. Accessed 2014 Sep 18. [DOI] [PubMed] [Google Scholar]
- 37. Nei M, Li WH (1979) Mathematical model for studying genetic variation in terms of restriction endonucleases. Proc Natl Acad Sci 76: 5269–5273. Available: http://www.pnas.org/content/76/10/5269.short. Accessed 2014 Sep 22. [DOI] [PMC free article] [PubMed] [Google Scholar]
- 38. Teeling H, Waldmann J, Lombardot T, Bauer M, Glöckner FO (2004) TETRA: a web-service and a stand-alone program for the analysis and comparison of tetranucleotide usage patterns in DNA sequences. BMC Bioinformatics 5: 163 Available: http://www.pubmedcentral.nih.gov/articlerender.fcgi?artid=529438&tool=pmcentrez&rendertype=abstract. Accessed 2014 Sep 2. [DOI] [PMC free article] [PubMed] [Google Scholar]
- 39. Darling AE, Mau B, Perna NT (2010) progressiveMauve: multiple genome alignment with gene gain, loss and rearrangement. PLoS One 5: e11147 Available: http://www.pubmedcentral.nih.gov/articlerender.fcgi?artid=2892488&tool=pmcentrez&rendertype=abstract. Accessed 2014 Jul 10. 10.1371/journal.pone.0011147 [DOI] [PMC free article] [PubMed] [Google Scholar]
- 40. Stahl DA, Urbance JW (1990) The division between fast- and slow-growing species corresponds to natural relationships among the mycobacteria. J Bacteriol 172: 116–124. Available: http://www.pubmedcentral.nih.gov/articlerender.fcgi?artid=208408&tool=pmcentrez&rendertype=abstract. Accessed 2014 Oct 8. [DOI] [PMC free article] [PubMed] [Google Scholar]
- 41. Kirschner P, Springer B, Vogel U, Meier A, Wrede A, Kiekenbeck M, et al. (1993) Genotypic identification of mycobacteria by nucleic acid sequence determination: report of a 2-year experience in a clinical laboratory. J Clin Microbiol 31: 2882–2889. Available: http://www.pubmedcentral.nih.gov/articlerender.fcgi?artid=266149&tool=pmcentrez&rendertype=abstract. Accessed 2014 Oct 8. [DOI] [PMC free article] [PubMed] [Google Scholar]
- 42. Zhou Y, Liang Y, Lynch KH, Dennis JJ, Wishart DS (2011) PHAST: a fast phage search tool. Nucleic Acids Res 39: W347–52. Available: http://nar.oxfordjournals.org/content/early/2011/06/14/nar.gkr485.long. Accessed 2014 Sep 16. 10.1093/nar/gkr485 [DOI] [PMC free article] [PubMed] [Google Scholar]
- 43. Kim M, Oh H-S, Park S-C, Chun J (2014) Towards a taxonomic coherence between average nucleotide identity and 16S rRNA gene sequence similarity for species demarcation of prokaryotes. Int J Syst Evol Microbiol 64: 346–351. Available: http://www.ncbi.nlm.nih.gov/pubmed/24505072. Accessed 2014 Jul 18. 10.1099/ijs.0.059774-0 [DOI] [PubMed] [Google Scholar]
- 44. Fox GE, Wisotzkey JD, Jurtshuk P (1992) How close is close: 16S rRNA sequence identity may not be sufficient to guarantee species identity. Int J Syst Bacteriol 42: 166–170. Available: http://www.ncbi.nlm.nih.gov/pubmed/1371061. Accessed 2014 Oct 8. [DOI] [PubMed] [Google Scholar]
- 45. Konstantinidis KT, Tiedje JM (2005) Genomic insights that advance the species definition for prokaryotes. Proc Natl Acad Sci U S A 102: 2567–2572. Available: http://www.pubmedcentral.nih.gov/articlerender.fcgi?artid=549018&tool=pmcentrez&rendertype=abstract. Accessed 2014 Sep 18. [DOI] [PMC free article] [PubMed] [Google Scholar]
- 46. Teeling H, Meyerdierks A, Bauer M, Amann R, Glöckner FO (2004) Application of tetranucleotide frequencies for the assignment of genomic fragments. Environ Microbiol 6: 938–947. Available: http://www.ncbi.nlm.nih.gov/pubmed/15305919. Accessed 2014 Oct 4. [DOI] [PubMed] [Google Scholar]
- 47. Takahashi M, Kryukov K, Saitou N (2009) Estimation of bacterial species phylogeny through oligonucleotide frequency distances. Genomics 93: 525–533. Available: http://www.ncbi.nlm.nih.gov/pubmed/19442633. Accessed 2014 Oct 8. 10.1016/j.ygeno.2009.01.009 [DOI] [PubMed] [Google Scholar]
- 48. Foerstner KU, von Mering C, Hooper SD, Bork P (2005) Environments shape the nucleotide composition of genomes. EMBO Rep 6: 1208–1213. Available: http://www.pubmedcentral.nih.gov/articlerender.fcgi?artid=1369203&tool=pmcentrez&rendertype=abstract. Accessed 2014 Sep 12. [DOI] [PMC free article] [PubMed] [Google Scholar]
Associated Data
This section collects any data citations, data availability statements, or supplementary materials included in this article.
Supplementary Materials
(TIF)
(TIF)
(TIF)
(DOCX)
(DOCX)
(DOCX)
(DOCX)
(DOCX)
(DOCX)
(DOCX)
Data Availability Statement
The GenBank database accession numbers for UM strains are: Mycobacterium sp. UM_Kg1 JRMK00000000; Mycobacterium sp. UM_Kg17 JRML00000000; Mycobacterium sp. UM_Kg27 JRMM00000000; Mycobacterium sp. UM_NZ2 JRMN00000000.