

Abstract
Background
Melanocytic naevi are an important risk factor for melanoma. Naevi with distinct dermoscopic patterns can differ in size, distribution and host pigmentation characteristics.
Objectives
We examined MC1R and 85 other candidate loci in a cohort of children to test the hypothesis that the development and dermoscopic type of naevi are modulated by genetic variants.
Methods
Buccal DNAs were obtained from a cohort of 353 fifth graders (mean age 10·4 years). Polymorphisms were chosen based on a known or anticipated role in naevi and melanoma. Associations between single-nucleotide polymorphisms (SNPs) and baseline naevus count were determined by multivariate regression adjusting for sex, race/ethnicity and sun sensitivity. Dermoscopic images were available for 853 naevi from 290 children. Associations between SNPs and dermoscopic patterns were determined by polytomous regression.
Results
Four SNPs were significantly associated with increasing (IRF4) or decreasing (PARP1, CDK6 and PLA2G6) naevus count in multivariate shrinkage analyses with all SNPs included in the model; IRF4 rs12203952 showed the strongest association with log naevus count (relative risk 1·56, P < 0·001). Using homogeneous naevi as the reference, IRF4 rs12203952 and four other SNPs in TERT, CDKN1B, MTAP and PARP1 were associated with either globular or reticular dermoscopic patterns (P < 0·05).
Conclusions
Our results provide evidence that subsets of naevi defined by dermoscopic patterns differ in their associations with germline genotypes and support the hypothesis that dermoscopically defined subsets of naevi are biologically distinct. These results require confirmation in larger cohorts. If confirmed, these findings will improve the current knowledge of naevogenesis and assist in the identification of individuals with high-risk phenotypes.
What's already known about this topic?
Total-body naevus counts and dysplastic naevi are important risk factors for melanoma.
Naevi with distinct dermoscopic patterns differ in size, anatomical and age distribution, and host pigmentation characteristics.
What does this study add?
We have identified associations between genetic variants and the number of naevi in early age.
We have identified associations between host genetics and the dermoscopic pattern of naevi, supporting the hypothesis that naevi distinguished by their dermoscopic pattern represent distinct biological subsets.
Total-body naevus counts and dysplastic naevi are important risk factors for melanoma.1 Understanding the pathways involved in naevogenesis is therefore relevant to public health efforts aimed at melanoma prevention. Cross-sectional2 and longitudinal3 studies have demonstrated that childhood and adolescence are critical periods for naevogenesis. Naevi are more common among those with fair skin, sun sensitivity4,5 and freckling, and their development is influenced by age, sex4,6 and sun exposure.3,7 Data from twin studies have suggested that naevi have a strong heritable component,7–9 observations supported by subsequent candidate gene and genome-wide association studies. Gene variants implicated in naevus development thus far include those involved in pigmentation,10,11 cell-cycle regulation,10 telomere function and senescence12–14 and immune surveillance.10,15 Variants in DNA repair pathways, among others, were recently implicated in the development of dysplastic naevi.16
The understanding of naevus development in childhood has been advanced with the use of dermoscopy, which allows a more detailed morphological assessment of individual naevi and has led to a new classification proposal.17 We have previously distinguished two subsets of naevi with distinct dermoscopic patterns (i.e. globular, reticular) that differ in size, anatomical and age distribution, and host pigmentation characteristics,5 and that remain stable in pattern during preadolescence.18 Furthermore, these dermoscopic patterns can be subtly recognized in normal-appearing skin,19 suggesting an individual predisposition towards a given pattern. Based on our observations and those of others,20–25 we hypothesize that the development of naevi is modulated by host genetic variants and that dermoscopically defined subsets of acquired naevi are biologically distinct.
This study aimed to evaluate potential associations between genetics and melanocytic naevus count and between genetics and dermoscopic naevus patterns in early life.
Materials and methods
Participants and data collection
The study was approved by the Boston University and Harvard University institutional review boards. Student recruitment was conducted within the Framingham, Massachusetts, school system through the Study of Nevi in Children (SONIC) study. Details on the cohort and data collection procedures have been previously described.4,26 Briefly, children were enrolled in fifth grade (mean age 10·4 years) in 2004 and were prospectively followed up. At baseline, participants completed a questionnaire regarding sun exposure history, sun sensitivity and sun-related behaviour. In cases of missing student information on sun sensitivity, parent responses were used. A study nurse recorded phenotypic information on hair, eye and skin colour based on visual examination.
Naevus imaging
Digital overview images of the back were obtained for each participant using a Phase One P25 Camera Back, Hasselblad 503w Camera System, 1 kW Studio Flash System (Canfield Scientific, Inc., Fairfield, NJ, U.S.A.). Images were 5540 × 4080 pixels in size, allowing for close-up interrogation with minimal loss of image quality. Total back naevus counts were assessed from images by a study dermatologist. Each lesion was digitally tagged for reproducibility and quality assurance. In a random sample of 50 back images, interobserver concordance was high (ρ = 0·91).4
Dermoscopic patterns
Detailed procedures have been reported by Scope et al.5 Briefly, close-up clinical and dermoscopic images of up to four back naevi were obtained from each participant in the months of November and December, and included the largest naevus and randomly selected upper-back naevi, and a corresponding pair of lower-back naevi. Naevus size was assessed against standardized scales. Dermoscopic images were obtained using a Fuji S2 SLR digital camera (Fujifilm, Tokyo, Japan) and 60 mm Macro Nikkor lens (Nikon, Tokyo, Japan) with Epi-Lume™ attachment (Canfield Scientific, Inc.). Images were independently evaluated by two dermatologists for global dermoscopic patterns:5,27 (i) reticular – diffuse or patchy network, without globules; (ii) globular – globules present without network; (iii) homogeneous – absence of network and globules; and (iv) complex – both network and globules present. A dermoscopic pattern that could not be classified was denoted as ‘other’. Disagreements between observers were resolved at a consensus session with an expert dermoscopist (A.A.M.).
Biospecimen collection
Participants swirled 10 mL of water in their mouth for 40 s and the solution was collected in conical tubes. Samples were logged in student classrooms by a study coordinator, and sent to the University of New Mexico for DNA extraction with Qiagen DNA kits (Qiagen, Inc., Valencia, CA, U.S.A.) and Sanger sequencing of MC1R. DNA was shipped to the Molecular Epidemiology Laboratory at Memorial Sloan-Kettering for additional genotyping, as detailed below.
Genotyping
MC1R was sequenced using a 1125-bp polymerase chain reaction-amplified fragment to cover the coding region. Information on primers and cycling parameters is detailed in Data S1 (see Supporting Information). Excess nucleotides and primers were removed using shrimp alkaline phosphatase/exonuclease I using standard conditions. BigDye® terminator cycle sequencing followed under standard conditions using one of four primers to address the carboxy terminus, transmembrane and amino terminus regions (Data S1). Products were sequenced on an ABI Prism 3100 (Applied Biosystems, Foster City, CA, U.S.A.) and electropherograms were read by two independent reviewers using the Sequencher software v.4.05 (Gene Codes Corporation, Ann Arbor, MI, U.S.A.).
Additional genotyping included polymorphisms selected for their reported associations with naevi and melanoma risk, and their known or expected functional relevance based on laboratory data and in silico predictions.28 We used the MassArray iPLEX chemistry and platform (Sequenom, San Diego, CA, U.S.A.). Genomic DNA (5–10 ng) was amplified using specific primers (Table S1; see Supporting Information), and the experimental procedures were similar to those previously described.29 Cluster plots were evaluated with the TyperAnalyzer (MassARRAY v.4.0.20.65; Sequenom). Assays were considered optimal according to the degree of clustering and agreement within replicas. Selected single-nucleotide polymorphism (SNP) clusters and representative samples within the clusters were sequenced to confirm specificity. Rigorous quality-control procedures were implemented to avoid contamination. One sample failed across all assays and was removed from the study. Among the 96 SNPs tested in 361 specimens, 11 SNPs failed due to poor clustering and/or nonspecific extension. In total, 85 SNPs in genes associated with pigmentary, DNA repair, telomere/senescence and other pathways were successfully tested. The successful assays are described in Table S2 (see Supporting Information) in relation to their associated known pathway, genomic context, chromosomal coordinate, alleles, minor allele frequency (MAF) and call rate.
Statistical analysis
The primary outcome was the total number of naevi on each participant's back, transformed to the natural logarithm scale after adding a constant of 1 to account for those study subjects without any naevi, referred to as log naevus count. The log transformation is a variance-stabilizing transformation, which effectively compresses large values of the data while stretching smaller values, thus mitigating outlier issues for data points that may otherwise appear anomalous. The secondary outcome was dermoscopic pattern of naevi, a categorical variable taking four values: homogeneous, reticular, globular and complex patterns. Up to four naevi were evaluated for dermoscopic patterns in each study participant.
We used linear regression analysis to examine the association between SNPs and log naevus counts using a multivariable model, adjusted for race/ethnicity, sex and Sun Sensitivity Index (Data S2; see Supporting Information). For completeness, we also initially modelled each SNP individually, adjusted for the same factors. To address potential multiple comparison issues in the multivariate model, we used an empirical Bayes-type shrinkage analysis that shrinks the effects of seemingly null SNPs towards 0.30 We also incorporated pathway information of the SNPs in this analysis, as detailed in Table S2 (see Supporting Information), in two ways: firstly based on the a priori assumption that all SNPs within the same pathway conferred the same effect on the outcome, and next under the a priori assumption that each SNP conferred an effect that is inversely proportional to its MAF. SNPs having P-values < 0·05 in the multivariate analyses were deemed significant. Interaction between the most significant SNP and sun exposure was examined using linear regression analysis by including product terms in the model. Additional methodological details can be found in Data S2.
We used polytomous regression to analyse dermoscopic patterns of naevi with homogeneous pattern as baseline, and by treating individuals as clusters. We excluded complex naevi from the analyses due to their limited sample size (n = 33). Due to the limited number of participants who were of ethnicity other than white non-Hispanic (40 Hispanic and 19 Asian, African American and Native American combined) (Table S3; see Supporting Information), we analysed the secondary outcomes using 76 SNPs in 735 naevi from 231 participants of non-Hispanic white ethnicity, after excluding SNPs having MAF < 5%. We conducted a univariate analysis for each SNP without adjusting for any other variable. SNPs with P < 0·10 in univariate analyses were prioritized for multivariate analysis. As some of these SNPs exhibited correlations, we fitted the final multivariate model using 12 SNPs. Due to the limited number of reticular naevi (n = 62) in our analyses, we used a bootstrap procedure with 200 bootstrap samples to estimate the standard errors of the odds ratios, and obtained the corresponding P-values.31 We report SNPs having P < 0·05 in multivariate analyses, and did not adjust the P-values for multiple comparisons due to the exploratory nature of our secondary analyses.
Results
The demographic and phenotypic characteristics of the study participants are presented in Table 1. There were 353 children (mean age 10·4 years, 136 female and 217 male) with available total back naevus counts and DNA for genetic analyses. Details on enrolment, participation and baseline findings are reported elsewhere.4,26 The participants were predominantly white non-Hispanic, had fair skin and a varying degree of sunburn propensity and tanning response. The average back naevus count was 9·2 (range 0–119). In total 853 naevi in 290 children were dermoscopically imaged, with the following distribution of dermoscopic patterns: 430 (50·4%) homogeneous, 298 (34·9%) globular, 92 (10·8%) reticular and 33 (3·9%) complex. The interrelationship between dermoscopic patterns, naevus size, anatomical location and phenotypic (pigmentary) characteristics were previously described for this cohort.5
Table 1.
Demographic and skin phenotypic characteristics of the 353 genotyped children
| Characteristic | Valuea |
|---|---|
| Age (years), mean ± SD | 10·4 ± 0·4 |
| Sex | |
| Male | 217 (61·5) |
| Female | 136 (38·5) |
| Race/ethnicity | |
| White | 267 (75·6) |
| Hispanic | 56 (15·9) |
| Asian | 17 (4·8) |
| African American | 12 (3·4) |
| Native American | 1 (0·3) |
| Skin colour | |
| Very fair or fair | 248 (70·3) |
| Light olive | 27 (7·6) |
| Dark olive, brown, black | 78 (22·1) |
| Hair colour | |
| Blonde | 22 (6·2) |
| Blonde/light brown | 38 (10·8) |
| Light brown | 86 (24·4) |
| Medium brown | 101 (28·6) |
| Red | 12 (3·4) |
| Dark brown | 56 (15·9) |
| Black | 38 (10·8) |
| Freckles | |
| None | 283 (80·2) |
| Mild | 55 (15·6) |
| Moderate/severe | 13 (3·7) |
| Missing data | 2 (0·6) |
| Naevus count | |
| Average ± SD | 9·2 ± 11·2 |
| Median (IQR) | 6 (9) |
| Sunburn propensity | |
| Yes | 124 (35·1) |
| No | 229 (64·9) |
| Tanning response | |
| Yes, deep | 103 (29·2) |
| Yes, moderate | 133 (37·7) |
| Occasional, mild | 60 (17·0) |
| No, not able to tan | 19 (5·4) |
| Unknown | 25 (7·1) |
| Missing data | 13 (3·7) |
| Sun exposure per day (summer prior to enrolment) | |
| Low (< 3 h) | 107 (30·3) |
| Medium (3–4 h) | 139 (39·4) |
| High (> 4 h) | 107 (30·3) |
| Sun Sensitivity Index | |
| Range | 0 (high) – 3 (low) |
| Mean ± SD | 1·57 ± 0·77 |
IQR, interquartile range.
n (%) unless stated otherwise.
Sequencing of the MC1R gene identified a total of 30 variants in 272 (77·1%) children, including polymorphisms linked to red hair colour – commonly termed ‘R’ (D84E, R142H, R151C, I155T, R160W and D294H)32 in 44 children; other MC1R variants in 189 children; or both R and non-R variants (termed ‘r’) in 39 children. The characteristics of the MC1R variants found are displayed in Table S4 (see Supporting Information).
The average call rate for 85 Sequenom-genotyped SNPs was 99·4% (range 95–100%), and the MAF ranged from 0·3% to 50%. For most of the candidate SNPs tested, the MAF in SONIC was similar to the MAF reported in dbSNP for white populations (Table S2; see Supporting Information). Five SNPs showed significant departure from the Hardy–Weinberg equilibrium (rs1129038, rs16891982, rs28777, rs12913832 and rs1426654; P-value < 0·001). However, as we selected our candidate SNPs based on their known or anticipated association with naevogenesis or melanomagenesis, these SNPs were not categorically eliminated from the analyses based on departure from the Hardy–Weinberg equilibrium.
Association between polymorphisms and log naevus count
Results of the analysis of individual SNPs are shown in Table 2. In multivariate analyses (Table 3), the minor alleles of IRF4 (rs12203592), PARP1 (rs3219090), CDK6 (rs2079147) and PLA2G6 (rs738322) were significantly associated with either increased (rs12203592) or decreased (rs3219090, rs2079147, rs738322) naevus count in at least one of the multivariate methods considered, and two SNPs, in PARP1 and in APEX1, displayed borderline significance.
Table 2.
Associations between individual genetic variants and log naevus count in the SONIC cohort
| SNP | MA | Gene | Pathway | RR (95% CI) | P-value |
|---|---|---|---|---|---|
| rs12203592 | T | IRF4 | Pigmentary traits; immune; other | 1·67 (1·40–1·98) | < 0·001 |
| rs2079147 | G | CDK6 | Cell cycle | 0·80 (0·66–0·96) | 0·016 |
| rs1800407 | A | OCA2 | Pigmentation | 1·29 (1·03–1·62) | 0·027 |
| rs872071 | A | IRF4 | Pigmentary traits; immune; other | 0·81 (0·67–0·98) | 0·028 |
| rs1129038 | G | HERC2 | Pigmentation | 1·23 (1·01–1·50) | 0·041 |
| rs17132382 | T | POLN | DNA repair | 0·82 (0·67–0·99) | 0·046 |
| rs12913832 | A | HERC2 | Pigmentation | 1·22 (1·00–1·49) | 0·047 |
| rs4150314 | T | ERCC5 (XPG) | DNA repair | 1·56 (0·99–2·42) | 0·052 |
| rs28777 | C | SLC45A2 | Pigmentation | 0·81 (0·65–1·00) | 0·054 |
| rs16891982 | C | SLC45A2 | Pigmentation | 0·82 (0·65–1·02) | 0·075 |
| rs1760944 | A | APEX1 (APE1) | DNA repair | 0·86 (0·73–1·02) | 0·082 |
| rs1042602 | A | TYR | Pigmentation | 1·15 (0·98–1·36) | 0·096 |
| rs2237570 | T | CDK6 | Cell cycle | 1·21 (0·97–1·51) | 0·098 |
SNP, single-nucleotide polymorphism; MA, minor allele; RR, relative risk; CI, confidence interval. Analysis adjusted for sex, race/ethnicity and Sun Sensitivity Index (linear and quadratic). Analysis included all 353 children. P ≤ 0·05 is significant.
Table 3.
Associations between single-nucleotide polymorphism (SNPs) and log naevus count determined by standard and shrinkage-based multivariate regression in 353 children
| SNP | Gene | MA | MAF | Multivariate analysisa |
Multivariate analysisb |
Multivariate analysisc |
|||
|---|---|---|---|---|---|---|---|---|---|
| RR (95% CI) | P-value | RR (95% CI) | P-value | RR (95% CI) | P-value | ||||
| rs12203592 | IRF4 | T | 0·18 | 1·56 (1·27–1·93) | < 0·001 | 1·50 (1·24–1·80) | < 0·001 | 1·49 (1·25–1·79) | < 0·001 |
| rs3219090 | PARP1 | A | 0·35 | 0·45 (0·23–0·87) | 0·022 | 0·77 (0·61–0·98) | 0·033 | 0·77 (0·61–0·98) | 0·037 |
| rs2079147 | CDK6 | G | 0·48 | 0·81 (0·65–0·99) | 0·049 | 0·82 (0·68–0·97) | 0·026 | 0·81 (0·68–0·96) | 0·017 |
| rs738322 | PLA2G6 | A | 0·50 | 0·55 (0·30–0·99) | 0·049 | 0·83 (0·66–1·05) | 0·120 | 0·84 (0·70–1·05) | 0·12 |
| rs2695238 | PARP1 | C | 0·36 | 1·61 (0·88–2·94) | 0·12 | 1·24 (1·00–1·55) | 0·054 | 1·23 (0·99–1·53) | 0·059 |
| rs1760944 | APEX1 | A | 0·40 | 0·84 (0·70–1·01) | 0·072 | 0·86 (0·73–1·01) | 0·061 | 0·86 (0·74–1·01) | 0·068 |
| rs1042602 | TYR | A | 0·32 | 1·20 (0·98–1·47) | 0·080 | 1·16 (0·98–1·36) | 0·082 | 1·15 (0·98–1·35) | 0·087 |
| rs1129038 | HERC2 | G | 0·46 | 1·58 (0·30–8·25) | 0·59 | 1·12 (0·98–1·29) | 0·093 | 1·12 (0·98–1·29) | 0·097 |
MA, minor allele; MAF, overall MA frequency in SONIC/this study; RR, relative risk; CI, confidence interval.
Standard multivariate analysis;
Shrinkage estimation using pathway information;
Shrinkage estimation using pathway information considering MAF.
Adjusted for sex, race/ethnicity and Sun Sensitivity Index (linear and quadratic terms). P ≤ 0·05 is significant.
Interaction with sun exposure
The top SNP from the analysis described above, IRF4 rs12203592, was included in an analysis of interaction between genetics and sun exposure in relation to log naevus count at baseline. We found a borderline significant interaction (anova P = 0·057). As depicted in Figure1, among all 353 children (top left), those with the reference allele C presented average log naevus counts that increase in a dose–response manner as outdoor sun exposure (defined as the self-reported time spent outdoors in a typical day in the past summer) increases from low (< 3 h) to medium (3–4 h) to high (> 4 h). In the presence of one or two variant T alleles, the mean log back naevus count is higher even among those who reported low levels of sun exposure. The naevus count continues to rise as sun exposure increases from low to medium, but remains unchanged with higher levels of exposure. Similar patterns are observed among non-Hispanic white children (top right), regardless of sex (bottom panels).
Fig 1.
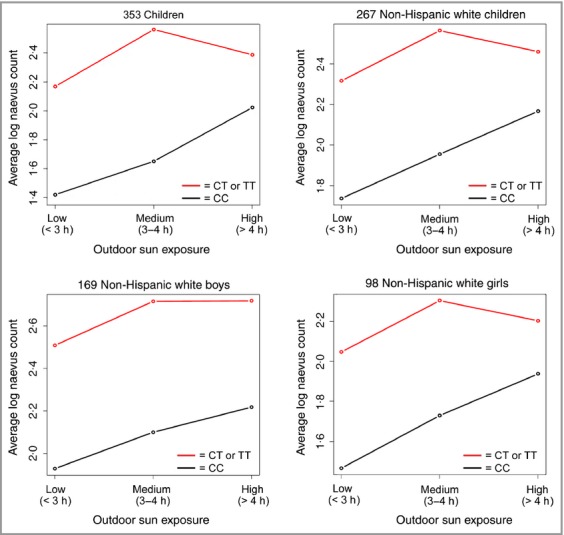
Average baseline log count of back naevi in relation to sun exposure among children according to IRF4 rs12203592 genotypes.
Associations between polymorphisms and dermoscopic patterns
We identified five significant associations (P < 0·05; Table 4): SNPs in IRF4 and TERT showed significant associations with globular patterns, while SNPs in CDKN1B, MTAP and PARP1 showed significant associations with reticular-patterned naevi (compared with homogeneous-patterned naevi). An SNP in CDK6 showed borderline significance with reticular-patterned naevi.
Table 4.
Associations between single-nucleotide polymorphism (SNPs) and reticular and globular dermoscopic patterns in relation to homogeneous patterns in 712 naevi from 231 non-Hispanic white children
| SNP | Gene | Pathway | MA | MAF | RR – globular vs. homogeneous pattern (95% CI) | P-value | RR – reticular vs. homogeneous pattern (95% CI) | P-value |
|---|---|---|---|---|---|---|---|---|
| rs12203592 | IRF4 | Pigmentary traits; immune; other | T | 0·18 | 0·59 (0·38–0·84) | 0·014 | 0·91 (0·41–1·89) | 0·82 |
| rs2853676 | TERT | Telomere; senescence; repair | A | 0·30 | 1·65 (1·09–2·65) | 0·025 | 1·76 (0·88–4·90) | 0·19 |
| rs7330 | CDKN1B | Cell cycle | C | 0·50 | 0·71 (0·45–1·12) | 0·15 | 0·42 (0·21–0·67) | 0·011 |
| rs7023329 | MTAP | Pigmentary traits | A | 0·49 | 0·75 (0·43–1·14) | 0·26 | 0·39 (0·17–0·72) | 0·017 |
| rs2695238 | PARP1 | DNA repair | C | 0·36 | 1·09 (0·77–1·62) | 0·68 | 0·47 (0·20–0·94) | 0·050 |
| rs2285332 | CDK6 | Cell cycle | C | 0·26 | 1·15 (0·75–1·91) | 0·58 | 2·28 (1·09–5·66) | 0·055 |
| rs12913832 | HERC2 | Pigmentation | A | 0·46 | 1·43 (0·98–2·16) | 0·078 | 1·20 (0·53–2·50) | 0·64 |
| Any r | MC1R | Pigmentation | – | 0·50 | 1·48 (0·86–2·68) | 0·16 | 1·69 (0·78–4·04) | 0·22 |
| rs26722 | SLC45A2 | Pigmentation | T | 0·07 | 1·53 (0·71–2·65) | 0·16 | 2·26 (0·48–7·44) | 0·23 |
| rs251796 | TERF2 | Telomere; senescence; repair | G | 0·31 | 1·40 (0·88–2·11) | 0·15 | 1·37 (0·65–3·02) | 0·42 |
| rs4785763 | AFG3L1P | Pigmentary traits | A | 0·29 | 1·22 (0·83–1·87) | 0·32 | 0·73 (0·33–1·49) | 0·47 |
| Any R | MC1R | Pigmentation | – | 0·10 | 1·16 (0·64–2·35) | 0·64 | 0·79 (0·17–2·60) | 0·74 |
| rs2736108 | TERT | Telomere; senescence; repair | A | 0·32 | 1·37 (0·92–2·07) | 0·13 | 1·08 (0·49–2·50) | 0·86 |
MA, minor allele; MAF, overall MA frequency in the full SONIC cohort/this study; RR, relative risk; CI, confidence interval. Analysis did not include adjustment for sex or Sun Sensitivity Index due to sparsity of data. P ≤ 0·05 is significant.
Discussion
The Study of Naevi in Children (SONIC) is the first to document the clinical and dermoscopic evolution of individual naevi over time during adolescence. Here, we provide results to support the hypothesis that naevi distinguished by their dermoscopic pattern might represent distinct biological subsets. Additionally, we substantiate evidence that host genetic markers are associated with back naevus counts at age 10–11 years.
In this cohort, the IRF4 rs12203952 polymorphism was very strongly associated with naevus count (Table 3; P < 0·001), in agreement with previous reports.15,33 Also, the rs12203952 T allele has been associated with increased counts of flat naevi and decreased counts of raised naevi;15 this is also consistent with the inverse association between the rs12203952 T allele and globular naevi (Table 4), which are mostly raised naevi. This SNP is known to disrupt a conserved melanocyte enhancer34 within intron 4 of the interferon regulatory factor (IRF)4 gene (IRF4; previously reported as MUM1), a gene strongly expressed in melanoma and in junctional and compound naevi35 that has potential antisurveillance or procarcinogenic activity.36 We also demonstrate a modifying effect by sun exposure on back naevus count among those carrying rs12203952 T (Fig.1). Carriage of T alleles, compared with C, is linked to increased naevus count at any level of sun exposure; however, increased sun exposure from low-to-moderate levels contributes to additional naevi, suggesting that sun avoidance/protective measures may still have a valuable role in modulating melanoma risk in patients with T alleles. In vitro studies demonstrate a repressive effect of the allele C on the promoter activity; conversely, the T allele increases IRF4 expression when IRF4 is induced.37 Praetorius et al., on the other hand, found lower IRF4 expression in foreskin melanocytes of subjects with the T allele compared with those with the C allele.34 The rs12203952 T allele has a protective effect on melanoma in children and adolescents,33 but the opposite effect has been reported for adults.38,39
Poly (ADP-ribose) polymerase (PARP)1 is a key DNA repair enzyme involved in senescence,40 cell death,41 inflammation and immunity,42,43 and is strongly expressed in naevi.44 PARP1 rs3219090 is intronic, maps to a conserved region and is a likely candidate for a regulatory role. In our study, rs3219090 A is inversely associated with naevus count. This allele is also protective for melanoma.45,46 We observed that another SNP (PARP1 rs2695238) was associated with naevus count with marginal significance (P < 0·06) and displayed an inverse association (P = 0·05) with reticular-patterned naevi. This SNP has been linked to melanoma risk by others.45
The cell-cycle regulator CDK6 was recently reported as the top gene associated with dysplastic naevi in melanoma-prone families.16 In SONIC, the rs2079147 variant G is inversely associated with naevus count (P < 0·05, Table 3), and – with a marginal significance – with reticular-patterned naevi (P = 0·055). A number of SNPs were associated with dermoscopic pattern independent of naevus number (Table 4). The TERT rs2853676 A allele was associated with globular-patterned naevi; it was reported by others as a melanoma susceptibility variant,47 and might be associated with telomere length.48 We also found negative associations between SNPs in CDKN1B and MTAP with reticular-patterned naevi. CDKN1B was recently linked to dysplastic naevi in melanoma families;16 it encodes the cell-cycle regulator p27, and its function is progressively lost in the transition from benign naevi to primary and metastatic melanomas. CDKN1B rs7330 is a tag SNP with unknown function; however, its location in the 3′ untranslated region may implicate a regulatory function. Other studies on MTAP rs7023329 show a strong association between the variant and the number of naevi and large naevi. Although reports do not fully agree on the directionality of the effect,49,50 associations have been reported between this SNP and melanoma.49,51–53
To our knowledge, this is the first population-based study on genetics in relation to naevus count and dermoscopic patterns in children. One recent study correlated genetics and dermoscopic features of melanocytic naevi in patients with multiple melanoma54 and reported that among 62 naevi from 27 cases, vessels were more frequently observed among CDKN2A G101W mutation carriers, and atypia was more common among those carrying any MC1R variant. In our study in children we did not find significant associations between carriage of MC1R ‘R+’ or ‘r+’ variants and naevus counts. Another study evaluated phenotypic characteristics in 168 patients with melanoma and 126 unaffected individuals, and reported higher total naevus counts and a predominant reticular dermoscopic pattern among five of six individuals who were carriers of the rare MITF E318K germline mutation.55
In this study, we used a shrinkage estimation approach to shrink the effects of the seemingly null SNPs towards 0, as the proportion of null SNPs required to calculate the false discovery rate cannot be reliably estimated from our candidate SNP data. Previous work has established that the shrinkage estimation approach provides excellent false discovery control. We recognize that this study is limited by a modest number of study subjects and that naevus count and imaging were limited to the back. We focused on this anatomical site for logistical (examinations conducted in school during mandatory scoliosis checks) and epidemiological considerations (efficiency and imaging quality on flat skin surfaces).4,56 We were unable to adjust the analysis of SNPs and dermoscopic patterns for sex or sun sensitivity due to data sparseness. Similarly, the relatively small number of subjects limits the investigation of several SNPs in the nonwhite groups; therefore, we limited the investigation to white children. Our analyses will need to be reproduced with larger, independent cohorts. Finally, we recognize that in some instances the dermoscopic pattern might change during the development of naevi,57 and this could potentially contribute to some statistical instability. However, most patterns remain stable during preadolescence.18
In conclusion, we show here that genetics are associated with both dermoscopic pattern and number of naevi in children of preadolescent age. Additional analyses in larger cohorts are warranted to confirm and extend our findings. Identification of potentially distinct biological melanocytic pathways will, in time, improve the current knowledge of naevogenesis and melanomagenesis. Recognition of distinct subsets of naevi might improve risk stratification with the potential to impact the biopsy threshold and surveillance frequency for high-risk phenotypes.
Acknowledgments
We thank Alan Geller (Harvard School of Public Health, Society, Human Development, and Health) for his continued collaboration on this project. We thank Marilyn Bishop, the teachers and staff in the Framingham School System, and the parents and students for participating in this study. We thank Youming Xu for his assistance with genetics data management and Joseph Kanik for assistance with graphics.
Supporting Information
Additional Supporting Information may be found in the online version of this article at the publisher's website:
Table S1. Primer sequences and assay conditions for the testing of genetic variants in SONIC.
Table S2. Genomic position, genomic context, and minor allele frequencies of SNPs included in the study of host genetics in relation to nevus count and nevus patterns.
Table S3. Distribution of genotype frequencies according to dermoscopic patterns, race/ethnicity, and gender.
Table S4. Type and frequency of MC1R variants found in the SONIC cohort, overall and by race/ethnicity.
Data S1. Supplementary methods: MC1R sequencing.
Data S2. Supplementary methods: statistical analyses.
References
- 1.Gandini S, Sera F, Cattaruzza MS, et al. Meta-analysis of risk factors for cutaneous melanoma: I. Common and atypical naevi. Eur J Cancer. 2005;41:28–44. doi: 10.1016/j.ejca.2004.10.015. [DOI] [PubMed] [Google Scholar]
- 2.Bauer J, Buttner P, Wiecker TS, et al. Risk factors of incident melanocytic nevi: a longitudinal study in a cohort of 1,232 young German children. Int J Cancer. 2005;115:121–6. doi: 10.1002/ijc.20812. [DOI] [PubMed] [Google Scholar]
- 3.English DR, Milne E, Simpson JA. Ultraviolet radiation at places of residence and the development of melanocytic nevi in children (Australia) Cancer Causes Control. 2006;17:103–7. doi: 10.1007/s10552-005-0425-0. [DOI] [PubMed] [Google Scholar]
- 4.Oliveria SA, Satagopan JM, Geller AC, et al. Study of Nevi in Children (SONIC): baseline findings and predictors of nevus count. Am J Epidemiol. 2009;169:41–53. doi: 10.1093/aje/kwn289. [DOI] [PMC free article] [PubMed] [Google Scholar]
- 5.Scope A, Marghoob AA, Dusza SW, et al. Dermoscopic patterns of naevi in fifth grade children of the Framingham school system. Br J Dermatol. 2008;158:1041–9. doi: 10.1111/j.1365-2133.2008.08510.x. [DOI] [PubMed] [Google Scholar]
- 6.English DR, Armstrong BK. Melanocytic nevi in children. I. Anatomic sites and demographic and host factors. Am J Epidemiol. 1994;139:390–401. doi: 10.1093/oxfordjournals.aje.a117011. [DOI] [PubMed] [Google Scholar]
- 7.Bataille V, Snieder H, MacGregor AJ, et al. Genetics of risk factors for melanoma: an adult twin study of nevi and freckles. J Natl Cancer Inst. 2000;92:457–63. doi: 10.1093/jnci/92.6.457. [DOI] [PubMed] [Google Scholar]
- 8.Easton DF, Cox GM, Macdonald AM, Ponder BA. Genetic susceptibility to naevi – a twin study. Br J Cancer. 1991;64:1164–7. doi: 10.1038/bjc.1991.483. [DOI] [PMC free article] [PubMed] [Google Scholar]
- 9.Zhu G, Duffy DL, Eldridge A, et al. A major quantitative-trait locus for mole density is linked to the familial melanoma gene CDKN2A: a maximum-likelihood combined linkage and association analysis in twins and their sibs. Am J Hum Genet. 1999;65:483–92. doi: 10.1086/302494. [DOI] [PMC free article] [PubMed] [Google Scholar]
- 10.Barrett JH, Iles MM, Harland M, et al. Genome-wide association study identifies three new melanoma susceptibility loci. Nat Genet. 2011;43:1108–13. doi: 10.1038/ng.959. [DOI] [PMC free article] [PubMed] [Google Scholar]
- 11.Duffy DL, Box NF, Chen W, et al. Interactive effects of MC1R and OCA2 on melanoma risk phenotypes. Hum Mol Genet. 2004;13:447–61. doi: 10.1093/hmg/ddh043. [DOI] [PubMed] [Google Scholar]
- 12.Barrett EL, Burke TA, Hammers M, et al. Telomere length and dynamics predict mortality in a wild longitudinal study. Mol Ecol. 2013;22:249–59. doi: 10.1111/mec.12110. [DOI] [PubMed] [Google Scholar]
- 13.Bodelon C, Pfeiffer RM, Bollati V, et al. On the interplay of telomeres, nevi and the risk of melanoma. PLoS One. 2012;7:e52466. doi: 10.1371/journal.pone.0052466. [DOI] [PMC free article] [PubMed] [Google Scholar]
- 14.Nan H, Qureshi AA, Prescott J, et al. Genetic variants in telomere-maintaining genes and skin cancer risk. Hum Genet. 2011;129:247–53. doi: 10.1007/s00439-010-0921-5. [DOI] [PMC free article] [PubMed] [Google Scholar]
- 15.Duffy DL, Zhao ZZ, Sturm RA, et al. Multiple pigmentation gene polymorphisms account for a substantial proportion of risk of cutaneous malignant melanoma. J Invest Dermatol. 2010;130:520–8. doi: 10.1038/jid.2009.258. [DOI] [PMC free article] [PubMed] [Google Scholar]
- 16.Liang X, Pfeiffer RM, Li WQ, et al. Association of genetic variants in CDK6 and XRCC1 with the risk of dysplastic nevi in melanoma-prone families. J Invest Dermatol. 2014;134:481–7. doi: 10.1038/jid.2013.316. [DOI] [PMC free article] [PubMed] [Google Scholar]
- 17.Argenziano G, Zalaudek I, Ferrara G, et al. Proposal of a new classification system for melanocytic naevi. Br J Dermatol. 2007;157:217–27. doi: 10.1111/j.1365-2133.2007.07972.x. [DOI] [PubMed] [Google Scholar]
- 18.Scope A, Dusza SW, Marghoob AA, et al. Clinical and dermoscopic stability and volatility of melanocytic nevi in a population-based cohort of children in Framingham school system. J Invest Dermatol. 2011;131:1615–21. doi: 10.1038/jid.2011.107. [DOI] [PMC free article] [PubMed] [Google Scholar]
- 19.Scope A, Marghoob AA, Chen CS, et al. Dermoscopic patterns and subclinical melanocytic nests in normal-appearing skin. Br J Dermatol. 2009;160:1318–21. doi: 10.1111/j.1365-2133.2009.09073.x. [DOI] [PMC free article] [PubMed] [Google Scholar]
- 20.Piliouras P, Gilmore S, Wurm EM, et al. New insights in naevogenesis: number, distribution and dermoscopic patterns of naevi in the elderly. Australas J Dermatol. 2011;52:254–8. doi: 10.1111/j.1440-0960.2011.00794.x. [DOI] [PubMed] [Google Scholar]
- 21.Zalaudek I, Argenziano G, Mordente I, et al. Nevus type in dermoscopy is related to skin type in white persons. Arch Dermatol. 2007;143:351–6. doi: 10.1001/archderm.143.3.351. [DOI] [PubMed] [Google Scholar]
- 22.Zalaudek I, Grinschgl S, Argenziano G, et al. Age-related prevalence of dermoscopy patterns in acquired melanocytic naevi. Br J Dermatol. 2006;154:299–304. doi: 10.1111/j.1365-2133.2005.06973.x. [DOI] [PubMed] [Google Scholar]
- 23.Zalaudek I, Schmid K, Marghoob AA, et al. Frequency of dermoscopic nevus subtypes by age and body site: a cross-sectional study. Arch Dermatol. 2011;147:663–70. doi: 10.1001/archdermatol.2011.149. [DOI] [PubMed] [Google Scholar]
- 24.Zalaudek I, Ferrara G, Argenziano G. Dermoscopy insights into nevogenesis: ‘Abtropfung’ versus ‘Hochsteigerung’. Arch Dermatol. 2007;143:284. doi: 10.1001/archderm.143.2.284. [DOI] [PubMed] [Google Scholar]
- 25.Zalaudek I, Hofmann-Wellenhof R, Kittler H, et al. A dual concept of nevogenesis: theoretical considerations based on dermoscopic features of melanocytic nevi. J Dtsch Dermatol Ges. 2007;5:985–92. doi: 10.1111/j.1610-0387.2007.06384.x. [DOI] [PubMed] [Google Scholar]
- 26.Geller AC, Oliveria SA, Bishop M, et al. Study of health outcomes in school children: key challenges and lessons learned from the Framingham Schools' Natural History of Nevi Study. J Sch Health. 2007;77:312–18. doi: 10.1111/j.1746-1561.2007.00212.x. [DOI] [PubMed] [Google Scholar]
- 27.Hofmann-Wellenhof R, Blum A, Wolf IH, et al. Dermoscopic classification of atypical melanocytic nevi (Clark nevi) Arch Dermatol. 2001;137:1575–80. doi: 10.1001/archderm.137.12.1575. [DOI] [PubMed] [Google Scholar]
- 28.O'Brien KM, Orlow I, Antonescu CR, et al. Gastrointestinal stromal tumors, somatic mutations and candidate genetic risk variants. PLoS One. 2013;8:e62119. doi: 10.1371/journal.pone.0062119. [DOI] [PMC free article] [PubMed] [Google Scholar]
- 29.Orlow I, Roy P, Reiner AS, et al. Vitamin D receptor polymorphisms in patients with cutaneous melanoma. Int J Cancer. 2012;130:405–18. doi: 10.1002/ijc.26023. [DOI] [PMC free article] [PubMed] [Google Scholar]
- 30.Satagopan JM, Zhou Q, Oliveria SA, et al. Properties of preliminary test estimators and shrinkage estimators for evaluating multiple exposures – application to questionnaire data from the SONIC study. J R Stat Soc Ser C Appl Stat. 2011;60:619–32. doi: 10.1111/j.1467-9876.2011.00762.x. [DOI] [PMC free article] [PubMed] [Google Scholar]
- 31.Efron B, Tibshirani RJ. An Introduction to the Bootstrap. New York: Chapman & Hall; 1993. [Google Scholar]
- 32.Sturm RA, Larsson M. Genetics of human iris colour and patterns. Pigment Cell Melanoma Res. 2009;22:544–62. doi: 10.1111/j.1755-148X.2009.00606.x. [DOI] [PubMed] [Google Scholar]
- 33.Kvaskoff M, Whiteman DC, Zhao ZZ, et al. Polymorphisms in nevus-associated genes MTAP PLA2G6, and IRF4 and the risk of invasive cutaneous melanoma. Twin Res Hum Genet. 2011;14:422–32. doi: 10.1375/twin.14.5.422. [DOI] [PMC free article] [PubMed] [Google Scholar]
- 34.Praetorius C, Grill C, Stacey SN, et al. A polymorphism in IRF4 affects human pigmentation through a tyrosinase-dependent MITF/TFAP2A pathway. Cell. 2013;155:1022–33. doi: 10.1016/j.cell.2013.10.022. [DOI] [PMC free article] [PubMed] [Google Scholar]
- 35.Sundram U, Harvell JD, Rouse RV, Natkunam Y. Expression of the B-cell proliferation marker MUM1 by melanocytic lesions and comparison with S100, gp100 (HMB45), and MelanA. Mod Pathol. 2003;16:802–10. doi: 10.1097/01.MP.0000081726.49886.CF. [DOI] [PubMed] [Google Scholar]
- 36.Tanaka N, Taniguchi T. The interferon regulatory factors and oncogenesis. Semin Cancer Biol. 2000;10:73–81. doi: 10.1006/scbi.2000.0310. [DOI] [PubMed] [Google Scholar]
- 37.Do TN, Ucisik-Akkaya E, Davis CF, et al. An intronic polymorphism of IRF4 gene influences gene transcription in vitro and shows a risk association with childhood acute lymphoblastic leukemia in males. Biochim Biophys Acta. 2010;1802:292–300. doi: 10.1016/j.bbadis.2009.10.015. [DOI] [PubMed] [Google Scholar]
- 38.Han J, Qureshi AA, Nan H, et al. A germline variant in the interferon regulatory factor 4 gene as a novel skin cancer risk locus. Cancer Res. 2011;71:1533–9. doi: 10.1158/0008-5472.CAN-10-1818. [DOI] [PMC free article] [PubMed] [Google Scholar]
- 39.Zhang M, Song F, Liang L, et al. Genome-wide association studies identify several new loci associated with pigmentation traits and skin cancer risk in European Americans. Hum Mol Genet. 2013;22:2948–59. doi: 10.1093/hmg/ddt142. [DOI] [PMC free article] [PubMed] [Google Scholar]
- 40.Wesierska-Gadek J, Ranftler C, Schmid G. Physiological ageing: role of p53 and PARP-1 tumor suppressors in the regulation of terminal senescence. J Physiol Pharmacol. 2005;56(Suppl. 2):77–88. [PubMed] [Google Scholar]
- 41.Bouchard VJ, Rouleau M, Poirier GG. PARP-1, a determinant of cell survival in response to DNA damage. Exp Hematol. 2003;31:446–54. doi: 10.1016/s0301-472x(03)00083-3. [DOI] [PubMed] [Google Scholar]
- 42.Luo X, Kraus WL. On PAR with PARP: cellular stress signaling through poly(ADP-ribose) and PARP-1. Genes Dev. 2012;26:417–32. doi: 10.1101/gad.183509.111. [DOI] [PMC free article] [PubMed] [Google Scholar]
- 43.Rosado MM, Bennici E, Novelli F, Pioli C. Beyond DNA repair, the immunological role of PARP-1 and its siblings. Immunology. 2013;139:428–37. doi: 10.1111/imm.12099. [DOI] [PMC free article] [PubMed] [Google Scholar]
- 44.Staibano S, Pepe S, Lo Muzio L, et al. Poly(adenosine diphosphate-ribose) polymerase 1 expression in malignant melanomas from photoexposed areas of the head and neck region. Hum Pathol. 2005;36:724–31. doi: 10.1016/j.humpath.2005.04.017. [DOI] [PubMed] [Google Scholar]
- 45.Macgregor S, Montgomery GW, Liu JZ, et al. Genome-wide association study identifies a new melanoma susceptibility locus at 1q21.3. Nat Genet. 2011;43:1114–18. doi: 10.1038/ng.958. [DOI] [PMC free article] [PubMed] [Google Scholar]
- 46.Pena-Chilet M, Blanquer-Maceiras M, Ibarrola-Villava M, et al. Genetic variants in PARP1 (rs3219090) and IRF4 (rs12203592) genes associated with melanoma susceptibility in a Spanish population. BMC Cancer. 2013;13:160. doi: 10.1186/1471-2407-13-160. [DOI] [PMC free article] [PubMed] [Google Scholar]
- 47.Nan H, Xu M, Zhang J, et al. Genome-wide association study identifies nidogen 1 (NID1) as a susceptibility locus to cutaneous nevi and melanoma risk. Hum Mol Genet. 2011;20:2673–9. doi: 10.1093/hmg/ddr154. [DOI] [PMC free article] [PubMed] [Google Scholar]
- 48.Melin BS, Nordfjall K, Andersson U, Roos G. hTERT cancer risk genotypes are associated with telomere length. Genet Epidemiol. 2012;36:368–72. doi: 10.1002/gepi.21630. [DOI] [PubMed] [Google Scholar]
- 49.Newton-Bishop JA, Chang YM, Iles MM, et al. Melanocytic nevi, nevus genes, and melanoma risk in a large case–control study in the United Kingdom. Cancer Epidemiol Biomarkers Prev. 2010;19:2043–54. doi: 10.1158/1055-9965.EPI-10-0233. [DOI] [PMC free article] [PubMed] [Google Scholar]
- 50.Yang XR, Liang X, Pfeiffer RM, et al. Associations of 9p21 variants with cutaneous malignant melanoma, nevi, and pigmentation phenotypes in melanoma-prone families with and without CDKN2A mutations. Fam Cancer. 2010;9:625–33. doi: 10.1007/s10689-010-9356-3. [DOI] [PMC free article] [PubMed] [Google Scholar]
- 51.Bishop DT, Demenais F, Iles MM, et al. Genome-wide association study identifies three loci associated with melanoma risk. Nat Genet. 2009;41:920–5. doi: 10.1038/ng.411. [DOI] [PMC free article] [PubMed] [Google Scholar]
- 52.Falchi M, Bataille V, Hayward NK, et al. Genome-wide association study identifies variants at 9p21 and 22q13 associated with development of cutaneous nevi. Nat Genet. 2009;41:915–19. doi: 10.1038/ng.410. [DOI] [PMC free article] [PubMed] [Google Scholar]
- 53.Gerstenblith MR, Shi J, Landi MT. Genome-wide association studies of pigmentation and skin cancer: a review and meta-analysis. Pigment Cell Melanoma Res. 2010;23:587–606. doi: 10.1111/j.1755-148X.2010.00730.x. [DOI] [PMC free article] [PubMed] [Google Scholar]
- 54.Bassoli S, Maurichi A, Rodolfo M, et al. CDKN2A and MC1R variants influence dermoscopic and confocal features of benign melanocytic lesions in multiple melanoma patients. Exp Dermatol. 2013;22:411–16. doi: 10.1111/exd.12168. [DOI] [PubMed] [Google Scholar]
- 55.Sturm RA, Fox C, McClenahan P, et al. Phenotypic characterization of nevus and tumor patterns in MITF E318K mutation carrier melanoma patients. J Invest Dermatol. 2014;134:141–9. doi: 10.1038/jid.2013.272. [DOI] [PubMed] [Google Scholar]
- 56.Oliveria SA, Geller AC, Dusza SW, et al. The Framingham school nevus study: a pilot study. Arch Dermatol. 2004;140:545–51. doi: 10.1001/archderm.140.5.545. [DOI] [PubMed] [Google Scholar]
- 57.Pellacani G, Scope A, Ferrari B, et al. New insights into nevogenesis: in vivo characterization and follow-up of melanocytic nevi by reflectance confocal microscopy. J Am Acad Dermatol. 2009;61:1001–13. doi: 10.1016/j.jaad.2009.04.018. [DOI] [PubMed] [Google Scholar]
Associated Data
This section collects any data citations, data availability statements, or supplementary materials included in this article.
Supplementary Materials
Table S1. Primer sequences and assay conditions for the testing of genetic variants in SONIC.
Table S2. Genomic position, genomic context, and minor allele frequencies of SNPs included in the study of host genetics in relation to nevus count and nevus patterns.
Table S3. Distribution of genotype frequencies according to dermoscopic patterns, race/ethnicity, and gender.
Table S4. Type and frequency of MC1R variants found in the SONIC cohort, overall and by race/ethnicity.
Data S1. Supplementary methods: MC1R sequencing.
Data S2. Supplementary methods: statistical analyses.