

Abstract
Tacrolimus and Sirolimus are commonly used maintenance immunesuppressants in kidney transplantation. Since their effects on immune cells and allograft molecular profiles have not been elucidated, we characterized the effects of Tacrolimus to Sirolimus conversion on frequency and function of T cells, and on graft molecular profiles. Samples from renal transplant patients in a randomized trial of 18 patients with late Sirolimus conversion and 12 on Tacrolimus maintenance were utilized. Peripheral blood was collected at 0, 6, 12 and 24-months post-randomization with T cell subpopulations analyzed by flow cytometry and T cell alloreactivity tested by IFN-γ ELISPOT. Graft biopsy samples obtained 24-months post-randomization were used for gene expression analysis. Sirolimus conversion led to an increase in CD4+25+++Foxp3+ regulatory T cells. While Tacrolimus-maintained patients showed a decrease in indirect alloreactivity over time post-transplant, Sirolimus conversion increased indirect alloreactive T cell frequencies compared to Tacrolimus-maintained patients. No histological differences were found in graft biopsies, but molecular profiles showed activation of the antigen presentation, IL-12 signaling, oxidative stress, macrophage-derived production pathways, and increased inflammatory and immune response in Sirolimus-converted patients. Thus, chronic immune alterations are induced after Sirolimus conversion. Despite the molecular profile being favorable to calcineurin inhibitor-based regimen, there was no impact in renal function over 30 months of follow-up.
Keywords: kidney transplantation, allo-reactivity, regulatory T cells, gene expression, Sirolimus, Tacrolimus, mTOR inhibitors
INTRODUCTION
Standard maintenance immunosuppression and attempts on minimization strategies are largely based upon “perceived” immunological risk and not upon knowledge about exact effects of immunosuppressive drugs on the immune system. While recent combinations of immunosuppressive agents have markedly reduced acute rejection rates, the optimal regimen to promote long-term renal allograft function has yet to be determined.1, 2 Furthermore, the decrease in acute rejection rates has not translated to improved long-term allograft survival due to persistent chronic allograft dysfunction (CAD).1–3 Primary immune mediators of CAD are uncontrolled T and B cell responses against the allograft while Calcineurin inhibitor (CNI) nephrotoxicity remains one of the main non-immune causes.4–6 CNI withdrawal and CNI to mTOR inhibitors conversion trials were designed to eliminate chronic CNI nephrotoxicity with the goal of improving CAD.7 The immune effects of such elimination or conversion from CNI remain uncertain. Furthermore, CNI to mTOR inhibitors conversion trials have failed to consistently result in improved CAD rates.8–12 In the Spare the Nephron trial,12 one of the largest multicenter prospective randomized trials of CNI conversion to Sirolimus (SRL), recipients converted to SRL demonstrated a significant improvement in renal function compared with the recipients remaining on CNI at one year post-randomization (GFR increase from baseline, 24.4% vs. 5.2%, p=0.010), but at 2 years, the differences were no longer significant for SRL converted patients (GFR increase, 8.6% vs. 3.4%, p=0.054). In the ZEUS multicentre trial,9 over 500 kidney transplant (KT) recipients maintained on cyclosporine, mycophenolate sodium, and corticosteroids were randomized at 4.5 months to continue cyclosporine or to convert to Everolimus. At 12-months post-randomization, the Everolimus regimen was associated with a significant improvement in GFR vs. the cyclosporine regimen, but the rates of biopsy-proven acute rejection were higher in the Everolimus group after randomization (10% of 154 vs. 3% of 146; p=0.04). The dissimilar outcomes of these studies emphasize the need for better understanding of the immunological and non-immunological consequences of Tacrolimus (TAC) and SRL, thereby facilitating their future effective therapeutic use with the ultimate goal of improving graft survival and preventing CAD.
To address these questions, we utilized samples obtained from patients enrolled in a prospective, randomized clinical trial in KT recipients on maintenance immunosuppression comparing TAC maintenance vs. TAC to SRL conversion at 12-months post-transplantation after identical induction therapy (Alemtuzumab and rapid steroid elimination). Specifically, the present study was designed to evaluate the immunologic effects of converting from TAC to SRL on peripheral T cell subpopulations, direct and indirect alloreactivity, and to discern the concomitant allograft molecular profiles of biopsies obtained at 24-months post-randomization.
RESULTS
Patients
KT recipient and donor baseline characteristics are summarized in Table 1. Briefly, there were no significant differences between the two groups at baseline when comparing recipient age, gender, ethnicity, need for pre-transplant dialysis, and time on dialysis before transplantation. Other characteristics which were similar were: donor age, gender and donor type, incidence of delayed graft function, HLA mismatches, and panel reactive antibody titers prior to transplant (Table 1).
Table 1.
Donor and recipient characteristics
| Study group | TAC (n=12) | SRL (n=18) | p-value |
|---|---|---|---|
| Donor | |||
| Age (years) – mean ±SD | 43 ± 10 | 38 ± 12 | 0.217 |
| Male Gender –n (%) | 6 (50) | 11 (65) | 0.471 |
| Donor type | |||
| Deceased –n (%) | 3 (25) | 5 (28) | 0.808 |
| Living related –n (%) | 5 (42) | 5 (28) | |
| Living unrelated –n (%) | 4 (33) | 8 (44) | |
| HLA mismatch – mean ±SD | 3.6 ± 1.7 | 3.3 ± 2.0 | 0.641 |
| Recipient | |||
| Age (years) – mean ±SD | 50 ± 10 | 45 ± 11 | 0.278 |
| Male Gender -n (%) | 10 (83) | 9 (50) | 0.121 |
| Ethnicity | 0.373 | ||
| White –n (%) | 6 (50) | 10 (56) | |
| African-American –n (%) | 3 (25) | 2 (11) | |
| Hispanic -n (%) | 3 (25) | 3 (17) | |
| Other -n (%) | 0 | 3 (17) | |
| Switch to SRL (months post-Tx) -mean ±SD | - | 12± 2.2 | |
| Pre transplant dialysis –n (%) | 10 (83) | 11 (61) | 0.249 |
| Time on dialysis (months) -mean ± SD | 20 ± 16 | 25 ± 27 | 0.610 |
| PRA positive –n (%) | 1 (8) | 1 (6) | 1.000 |
| DGF –n (%) | 0 (0) | 2 (11) | 0.503 |
Comparisons were performed using unpaired t-test, Fisher’s exact or Chi-square test. PRA: Panel Reactive Antibody; DGF: Delayed Graft Function.
Post-transplant outcomes
Patient and graft survival rates and incidence of ACR at 42 months post-transplant were not significantly different between the patients maintained on TAC compared to patients converted to SRL (patient survival: 100% vs. 100%, p=1.0; graft loss: 8.3% vs. 0%, p=0.40; rejection rate: 8.3% vs. 0%, p=0.40) (Table 2). At the time of randomization (12-months post-transplantation), eGFR was not statistically different between the two groups (55.5 ml/min/1.73m2 (TAC) compared to 58.2 ml/min/1.73m2 (SRL), p=0.75) (Figure 1). At different time points, post-randomization eGFR was equally maintained between the study groups (Figure 1). De-novo donor specific antibodies (DSA) was detected in 1 patient (8.3%) (class I) in TAC group whereas the SRL group had 4 patients (22.2%) tested positive for DSA, of which 3 of 4 are class II DSA (75%), at 24-months post-randomization (p=0.38) (Table 2)
Table 2.
Post-transplant outcomes at 42 months
| Study group | TAC (n=12) | SRL (n=18) | p-value |
|---|---|---|---|
| Death -n, (%) | 0 (0) | 0 (0) | 1.000 |
| Graft loss -n, (%) | 1 (8) | 0 (0) | 0.400 |
| Rejection -n, (%) | 1 (8) | 0 (0) | 0.400 |
| De novo DSA –n(%) | 1 (8) | 4 (22) | 0.378 |
| Class I | 1 (8) | 1 (6) | 0.400 |
| Class II | 0 (0) | 3 (17) | 0.070 |
Comparisons were performed using Fisher’s test.
Figure 1.
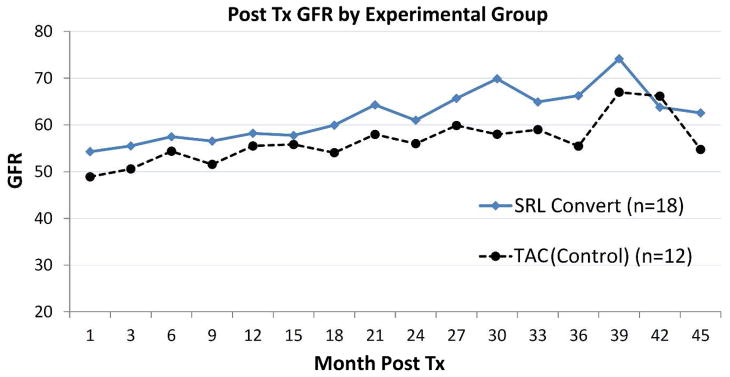
Estimated glomerular filtration rate according to treatment groups: TAC maintained vs. SRL converted group. GFR, Glomerular filtration rate; TAC, Tacrolimus maintained group; SRL Sirolimus converted group; Tx, transplant.
Histopathology
There were no significant differences in interstitial fibrosis/tubular atrophy(IF/TA), transplant glomerulopathy, arteriosclerosis or arteriolar hyalinosis between the two groups at 24-months post-randomization (Table 3). We further characterized the biopsies by looking at tubulitis in atrophic and non atrophic tubules in areas of IF/TA. 5 cases (27.8%) in SRL group compared to 1 case (8.3%) in TAC group had ≥ t2 tubulitis in atrophic tubules (p=0.06) (Table 3). Immunohistochemical staining for CD68 (marker for macrophages) in kidney tissue 24-months post-randomization showed area of modest to numerous CD68+ cells in 10 patients (55.6%) in SRL group compared to 4 patients (33.3%) in TAC group (p=0.23) (Table 3).
Table 3.
Histologic characteristics of the allograft at 24 months following randomization by treatment group: TAC maintenance vs. SRL conversion
| Study groups | TAC (n=12) | SRL (n=18) | p-value |
|---|---|---|---|
| Transplant glomerulopathy (cg) – n (%) | |||
| cg0 | 11 (91.6) | 16 (88.0) | 0.950 |
| cg1 | 1 (8.3) | 1 (5.5) | |
| cg2 | 0 (0) | 1 (5.5) | |
| cg3 | 0 (0) | 0 (0) | |
| Interstitial fibrosis and tubular atrophy (IF/TA) – n (%) | |||
| None | 2 (16.6) | 3 (16.6) | 0.930 |
| Mild (<25%) | 9 (75.0) | 13 (72.2) | |
| Moderate (26–25%) | 1 (8.0) | 1 (5.0) | |
| Severe (>50%) | 0 (0) | 1 (5.0) | |
| Arteriosclerosis (cv) – n (%) | |||
| cv0 | 6 (50.0) | 8 (44.4) | 0.940 |
| cv1 | 5 (41.6) | 7 (38.8) | |
| cv2 | 1 (8.3) | 3 (16.6) | |
| cv3 | 0 (0) | 0 (0) | |
| Arteriolar Hyalinosis (ah) – n (%) | |||
| ah0 | 8 (66.6) | 10 (55.5) | 0.890 |
| ah1 | 4 (33.3) | 6 (33.3) | |
| ah2 | 0 (0) | 2 (11.0) | |
| ah3 | 0 (0) | 0 (0) | |
| Tubulitis in IF/TA – n (%) | |||
| in atrophic tubules, >t2* | 1 (8.3) | 5 (27.8) | 0.06 |
| in non atrophic tubules, >t2* | 3 (25) | 2 (11.1) | 0.32 |
| Area of CD68+ Cells – n (%) | |||
| None | 3 (25) | 4 (22.2) | 0.86 |
| Mild (<30 cells/HPF) | 4 (33.3) | 5 (27.8) | 0.74 |
| Modest to numerous (> 30–50 cells/HPF) | 4 (33.3) | 10 (55.6) | 0.23 |
HPF, high-power field
tubulitis was scored according to the standard Banff classification scheme, tubulitis in the atrophic tubules was assessed in the same manner as for nonatrophic ones.
SRL leads to an expansion of regulatory T cells (Treg) without affecting other T cell subpopulations
Frequency of total CD3+, CD4+, CD8+, CD4+CD25−, naïve(CD4+CD45RA+) and memory(CD4+CD45RO+) CD4 T cells, naïve(CD8+CD45RA+) and memory(CD8+CD45RO+) CD8 T cells and Treg (CD4+CD25+++FOXP3+) in peripheral blood were analyzed by flow cytometry. Changes in T cells subpopulations and Treg were compared over time from baseline to 6-, 12- and 24-months post-randomization within each group and between TAC and SRL groups. As shown in Figure 2A, frequencies and absolute numbers (cells/μl of blood) of Treg increased in the SRL group over time from baseline to 24-months post-randomization (0.41±0.20 (TAC) vs 0.32±0.28 (SRL) CD4+CD25+++FOXP3+ cells/ul of blood at baseline (p=0.89) compared to 0.60±0.18 (TAC) vs 1.33±0.28 (SRL) CD4+CD25+++FOXP3+ cells/ul of blood at 24-months (p=0.01). However the frequencies of CD4+, CD8+, CD4+CD25− T cells, naïve and memory CD4 and CD8 T cells remained unchanged (Figure 3).
Figure 2.

(A) Frequencies of regulatory T cells (CD4+CD25+++FOXP3+ T cells) at baseline, 6 months, 12 months and 24 months post-randomization comparing between TAC maintained and SRL converted group shown in absolute number of cells (Mean ± SD) per microliters of PBMC (Left panel) or percentage of cells (Mean ± SD) within the CD4 T cells (Right panel). (B) Gating strategy and median fluorescent intensity of FOXP3 in CD4+CD25+++FOXP3+ T cells at baseline, 6 months, 12 months and 24 months post-randomization comparing between TAC maintained and SRL converted group. TAC, Tacrolimus maintained group; SRL Sirolimus converted group; Tregs, regulatory T cells; PBMC. Peripheral Blood Mononuclear Cell; MFI, median fluorescent intensity.
Figure 3.

Percentage of CD3 T cells, CD4 T cells, CD8 T cells, effector CD4 T cells (CD4+CD25−), naïve CD4 T cells (CD4+CD45RA+), memory CD4 T cells (CD4+CD45RO+), naïve CD8 T cells (CD8+CD45RA+) and memory CD8 T cells (CD8+CD45RO+) in PBMC (Mean ± SD) at baseline, 6 months, 12 months and 24 months post-randomization comparing between TAC maintained and SRL converted group. SRL conversion did not result in changes of these T cell subpopulations. TAC, Tacrolimus maintained group; SRL Sirolimus converted group.
To further evaluate the change in CD4+CD25+++FOXP3+ cells, we also measure the median fluorescent intensity (MFI) of Foxp3 in these cells and compare the MFI between the two groups. We found that the MFI of Foxp3 in CD4+25+++Foxp3+ T cells was comparable in both groups from baseline (105.8±14.3 (SRL group) vs. 112.1±25.8 (TAC group), p=0.82) to 24-months (75.0±7.1 (SRL group) vs. 98.1±10.8 (TAC group), p=0.07) post-conversion (Figure 2B).
Conversion from TAC to SRL leads to increased indirect donor T cell alloreactivity
We used PBMC samples from the same patient cohort to measure both direct (stimulation by irradiated donor cells) and indirect (stimulation with synthetic peptides derived from mismatched donor class I and class II MHC molecules 13 or donor cell membrane sonicates) donor alloreactivity by IFN-γ ELISPOT assay as previously described.13–15 We found that subjects converted to SRL demonstrated significantly increased frequencies of indirectly-primed donor alloreactive T cells, while direct alloreactivity was similar between the two groups at 12-months post-randomization (Figure 4). While IFN-γ production by PBMC incubated with PHA (control ELISPOT, Figure 4A) or irradiated donor cells (direct ELISPOT, Figure 4B) showed no difference in alloreactivity when compared between groups at 6- or 12-months, TAC-maintained patients showed a decrease in indirect alloreactivity over time post-transplant (Figure 4C, 4D). In contrast, SRL conversion increased the frequencies of indirect alloreactive T cells, measured by PBMC incubation with either donor’s cell membrane preparation or donor-specific HLA mismatched synthetic peptides and the difference between groups was found to be significant over time (p=0.009 and p=0.001, respectively) (Figure 4C, 4D).
Figure 4.

Direct and indirect donor T cell alloreactivity measured by IFN-γ ELISPOT at baseline, 6 months and 12 months post-randomization comparing between TAC maintained and SRL converted group. (A) IFN-γ production by PBMC incubated with PHA shows that cell viability was excellent in both groups. (B) IFN-γ production by PBMC incubated with irradiated donor cells showed no difference in direct T cell alloreactivity at 6- and 12-months. (p=0.082 for interaction group*time). (C and D) Indirect T cell alloreactivity, as measured by incubating PBMC either with a donors’ cell membrane preparation or donors’ HLA mismatched synthetic peptides, increased significantly over time in SRL group (p=0.009 and p=0.001 for interaction group*time, respectively). Results are expressed as mean ± SE for log-transformed ELISPOT counts. Analysis was performed using generalized estimating equations.
Differential gene expression between randomized patients receiving CNI or mTOR inhibitor
Gene expression analysis was conducted in kidney biopsy samples collected at 24-months post-randomization of KT recipients maintained with TAC (n=12) or converted to SRL (n=18). After statistical analysis, 1,025 probe sets (877 genes) were identified as significant and differentially expressed between TAC vs. SRL groups. Of those, 295 genes were found up-regulated while 582 genes down-regulated in SRL vs. TAC.
Core analysis was performed to interpret the data set in the context of biological processes, pathways and molecular networks. Cell death and survival (p-value range= 3.52E-11-1.59E-03, 310 genes); cellular growth and proliferation p-value range= 1.43E-14-1.44E-04, 294 genes); and molecular transport (p-value range = 7.51E-12-1.56E-03) were the top identified molecular and cellular functions associated with the differentially expressed genes. The analysis of top canonical pathways showed as top pathways xenobiotic metabolism signaling (p=7.33E-05), endothelin-1 signaling (p=7.63E-05) and production of nitric oxide and reactive oxygen species in macrophages (p=3.75E-04) (Table 4). The specific analysis of humoral and cellular mediated immune response showed differential regulation of pathways between both groups (Figure 5). Specifically, the sub-analysis of genes involved in humoral immune response showed in addition to up-regulation of antigen presentation signaling, also a higher percentage of genes up-regulated in the SRL group that associate with B cell development (IL7R), complement system (C1R, C1S, C4A/C4B), and IL-4 signaling (IL4R, INPP5D, IL13RA1) (Figure 5A). Additionally, from the analysis of cellular mediated immune response, it was observed a higher percentage of up-regulation of genes involved in antigen presentation (p=0.0008; up-regulated genes included HLA-B, HLA-DPB1, HLA-DRA, PSMB5, among others) cytotoxic T lymphocyte mediated apoptosis of target cells (with up-regulation of BCL2, CASP8, HLAG genes, among others) and allograft rejection signaling in the SRL conversion compared with TAC group (Figure 5B). In total, 65 significant altered molecular pathways were associated with this molecular profile (Supplementary Table S1). In order to validate the results from the microarray data, we also performed the qRT-PCR analysis of 4 genes associated with IL-12 signaling and Production in Macrophages, Antigen Presentation, and Allograft rejection (LYZ, TLR2, STAT1 and IRF8) and we found the up-regulations of these genes in the SRL group when compared to TAC group. (Supplemental information and supplemental Figure 1 and 2).
Table 4.
Top significant canonical pathways associated with SRL converted KT recipients
| Number | Ingenuity Canonical Pathways | p-value |
|---|---|---|
| 1 | Xenobiotic Metabolism Signaling | 0.0001 |
| 2 | Production of Nitric Oxide and Reactive Oxygen Species in Macrophages | 0.0003 |
| 3 | Synaptic Long Term Depression | 0.0006 |
| 4 | Estrogen Biosynthesis | 0.0007 |
| 5 | IL-12 Signaling and Production in Macrophages | 0.0007 |
| 6 | PXR/RXR Activation | 0.0008 |
| 7 | Antigen Presentation Pathway | 0.0008 |
| 8 | Endothelin-1 Signaling | 0.0009 |
| 9 | LXR/RXR Activation | 0.0009 |
| 10 | Bupropion Degradation | 0.0009 |
Figure 5.

Top canonical immunological pathways identified among differentially expressed genes between SRL and TAC groups. (A) Humoral mediated immune response, (B) Cellular mediated immune response. The Canonical Pathways that are involved in this analysis are displayed along the x-axis. As the default the y-axis displays the −log of p-value which is calculated by Fisher’s exact test right-tailed.
The orange points represent Ratio. The ratio is calculated as follows:
# of genes in a given pathway that meet cutoff criteria, divided by total # of genes that make up that pathway.
Additionally, we used IPA Upstream Regulator Analysis to identify the upstream regulators that may be responsible for gene expression changes observed in our experimental dataset. Specifically, IPA predicts which upstream regulators are activated or inhibited to explain the up-regulated and down-regulated genes observed in our dataset. As previously explained, IPA uses a z-score algorithm to make predictions. The z-score algorithm is designed to reduce the chance that random data will generate significant predictions. From the analysis of upstream regulators in resulting differentially expressed genes from the comparison of SRL vs. TAC, we identified IL6 (z-score= 2.60) and IFNG (z-score= 2.97) (Figure 6) as top predicted significant positive up-regulators that were simultaneously present as significant genes in our analysis (Table 5). In both cases, the predicted downstream effect involve TNF, NFκB complex, NFκB1, and IL1β activation concomitant with inhibition of NFκB inhibitor (NFκBIA), and Jun and Myc early transcription factors. It is important to clarify that activated predictions are made only if the value in the activation z-score is ≥2. (Inhibited predictions are made only if the value is ≤ 2. IPA does not assign predictions to any values between 2 and −2).
Figure 6.

Mechanistic networks for the 2 top significant upstream regulators identified as activated in SRL converted patients. The two panel picture represents predicted activity of downstream cascades regulated by (A) Left panel: Interferon gamma (IFNγ) and (B) Left panel: Interleukin-6 (IL6). Mechanistic networks enable to discover plausible sets of connected upstream regulators that can work together to elicit the gene expression changes observed in our dataset to discover plausible sets of connected upstream regulators that can work together to elicit the gene expression changes observed in a dataset. (A and B) right panels: Network generated by IPA from the 2 top predicted upstream regulators and target genes present of differentially expressed genes when comparing SRL to TAC samples. Upstream Regulator Analysis is based on expected causal effects between Upstream regulators and targets; the expected causal effects are derived from the literature compiled in the Ingenuity® Knowledge Base. The analysis examined the known targets of each upstream regulator in our dataset, compares the targets’ actual direction of change to expectations derived from the literature, then issues a prediction for each upstream regulator.
Table 5.
Significantly activated and inhibited upstream regulators
| Upstream Regulator | Predicted Activation State | Activation z-score | p-value |
|---|---|---|---|
| IFNG | Activated | 2.940 | 0.000005 |
| IL6 | Activated | 2.862 | 0.0000004 |
| IFN alpha/beta | Activated | 2.828 | 0.021 |
| NFkB (complex) | Activated | 2.501 | 0.005 |
| IL27 | Activated | 2.327 | 0.031 |
| SNAI2 | Activated | 2.236 | 0.0326 |
| EBI3 | Activated | 2.186 | 0.0357 |
| CTCF | Activated | 2.000 | 0.0124 |
| NPPB | Activated | 2.000 | 0.0377 |
| Creb | Inhibited | −2.000 | 0.009 |
| mir-21 | Inhibited | −2.043 | 0.011 |
| RXRA | Inhibited | −2.046 | 0.019 |
| ESR2 | Inhibited | −2.060 | 0.001 |
| NR1I3 | Inhibited | −2.064 | 0.004 |
| FGFR2 | Inhibited | −2.178 | 0.049 |
| CREM | Inhibited | −2.183 | 0.019 |
| USF2 | Inhibited | −2.206 | 0.0002 |
| CREB1 | Inhibited | −2.214 | 0.001 |
| TFEB | Inhibited | −2.216 | 0.006 |
| TNFSF11 | Inhibited | −2.232 | 0.006 |
| NR3C1 | Inhibited | −2.320 | 0.001 |
| SREBF2 | Inhibited | −2.401 | 0.010 |
| FOXA2 | Inhibited | −2.404 | 0.006 |
| TSC2 | Inhibited | −2.433 | 0.001 |
| NR1I2 | Inhibited | −2.483 | 0.001 |
| EIF4E | Inhibited | −2.530 | 0.032 |
| MAP2K1 | Inhibited | −2.608 | 0.035 |
| SREBF1 | Inhibited | −2.744 | 0.018 |
| TCR | Inhibited | −2.776 | 0.016 |
| PPARA | Inhibited | −2.813 | 0.0006 |
| HNF1A | Inhibited | −3.046 | 0.000002 |
| HNF4A | Inhibited | −3.834 | 2.08E-13 |
DISCUSSION
In the last fifteen years, the effect of SRL on the cells of the immune system has been increasingly recognized as complex and sometimes counterintuitive. A strong immunosuppressive effect of SRL on adaptive immune response has been suggested initially from in vitro experiment.16 More specifically, numerous in vivo and in vitro studies in animal models and humans demonstrated that this immunosuppressant drug leads to a regulatory T cell expansion.17–19 In addition to the effect of SRL on the adaptive immunity, there are also emerging data demonstrating that mTOR may modulate innate immune cells through the TLR signaling pathway and the inflammatory syndromes associated with SRL, such as pneumonitis and glomerulonephritis, are believed to be due to this innate immune cell activation.16 Therefore, there is some evidence that the effect of SRL on the immune system involves in addition to the adaptive also the innate immune system, and thus the SRL-induced inflammatory state might counterbalance the immunosuppressive effects observed on T cells in vitro.20
Chronic CNI nephrotoxicity has been recognized as the main non-immune mechanism of CAD and this has provided the rationale for CNI withdrawal and CNI to mTOR inhibitors conversion trials.8–12 However, CNI to mTOR inhibitors conversion trials are not consistent in showing improved CAD over a 2-year follow-up. Furthermore an increased rate of acute rejection episodes has been reported in patients converted from CNI to mTOR inhibitors.9, 11 The present study was not designed to evaluate clinical outcomes (as these were already reported earlier in our large clinical trial21) but it was aimed at investigating the immunomodulatory consequences associated with the conversion of TAC to SRL. Even if unpowered to detect clinical outcomes, the present study confirmed the findings reported in our previous trial. 21
In this study we found that conversion to SRL led to an increase in CD4+25+++Foxp3+ Treg in peripheral blood in accordance with previous reports demonstrating increased peripheral Treg in patients on SRL immunosuppressant regimen.22, 23 Since the levels of Foxp3 in Treg might reflect their functional status in transplantation 24, we also measured the MFI of Foxp3 in the CD4+25+++Foxp3+ Treg. No significant differences in MFI expression in the SRL converted group were identified, indicating the true increase in CD4+25+++Foxp3+ Treg in this group. Given the increased number in CD4+25+++Foxp3+ Treg, we were anticipating an overall decrease in T cells alloreactivity measured with IFN–γ ELISPOT assay. Intriguingly, SRL-induced Treg had no effects on the frequencies of alloreactive T cells. In fact, notwithstanding increased Treg frequency in SRL converted patients, accompanied with unvaried CD4 memory T cell frequencies between both groups, suggesting that conversion to SRL tips the balance between CD4 memory T cell and Treg towards regulation, our functional studies with IFN-γ ELISPOT assay showed that conversion to SRL favors indirect donor T cell alloreactivity.
Next we conducted suitable histological and molecular analyses of graft tissues two years after randomization. Interestingly, histopathological examination of kidney graft biopsy samples at 24-months post-randomization did not reveal significant histological differences between recipients maintained on TAC and those converted to SRL, although we found a trend of increasing tubulitis in the SRL-converted group. This finding might have important prognostic implications for renal allograft survival as tubulitis in areas of atrophy was found to be associated with allograft failure 25.
Gene expression analyses conducted in graft tissue samples at 24 months post-randomization using microarray technology identified a differential molecular profile between both study groups. It has been previously demonstrated that molecular changes precede histological changes as well as graft function.26 More interestingly, the biological analysis associated this differentially expressed gene expression profile with inflammation, the production of nitric oxide, reactive oxygen species and IL-12 in macrophages and molecular pathways involved in activation of the adaptive immune response. In this regard, we also found a trend of increasing macrophage infiltration in renal allograft biopsies stained with anti-CD68 in SRL-converted patients suggesting a higher inflammatory milieu.
Further gene expression analysis showed that antigen processing and presentation pathway resulted positively regulated in SRL converted patient predominantly through activation of the MHC class II receptor and triggering antigen presentation to T helper CD4+ lymphocytes. These findings are in agreement with the results obtained after analysis of PBMC, suggesting indirect allograft antigen presentation. A recent finding showed that switching from cyclosporine to mTor-inhibitor might induce the development of de-novo donor specific antibodies after conversion 27. This finding might in part be explained by our observation of the up-regulation of genes involved in the pathways of chronic humoral immune activation. Although we also observed more class II DSA development at 24-months post-conversion in the SRL converted patients, the finding did not reach statistical significant. Longer-term follow up with more patients is still underway.
The molecular profile biological analysis also suggested an increased inflammatory scenario with predicted up-regulation of IL-6, as top upstream regulator, and concomitant TNF, NFκB1, and IL-1β positive regulation. Recent experimental data suggested that SRL might activate monocytes, which in turn polarize T cells to a Th1 and Th17 phenotype and promote pro-inflammatory cytokines production via NFκB and induce IL-10 releasing blockade via STAT3.28, 29 In addition, in vivo inhibitory studies of mTOR signaling showed increment in activated IL-1β level in LPS stimulated mice as consequence of absent mTOR repression on caspase-1 which allows active IL-1β releasing.30 As shown in Figure 6, predicted upstream regulator cascades from identified differential molecular expression profiles clearly concur with those in vivo study results. Consistent with these findings, a previous study has reported an increase in Th17 cells in KT recipients treated with Alemtuzumab induction and SRL maintenance.31 Further, the paradoxical findings of expansion of Treg in the periphery and at the same time an inflammatory gene expression profile in graft tissue in our study might be due to dysfunctional Treg as described in humans with colon cancer.32 Therefore, conversion from TAC to SRL immunosuppressant regimens might induce a chronic inflammatory state that precedes histological and clinical manifestations. Longer follow-up time and evaluation of these findings in large cohorts are needed for further confirmation of these initial results.
To conclude, experimental data generated from this well-selected cohort of patients suggest differential immune alterations in KT recipients who underwent CNI (TAC) to mTOR inhibitor (SRL) conversion. Importantly, those immune alterations have been further observed and coincided at the peripheral level through circulating cell population analysis as well as at graft tissue level by distinct immune molecular signatures. Even if CNI to mTOR inhibitor conversion benefited KT recipients through avoidance of CNI toxicity involved in chronic kidney graft impairment, our patients switched to SRL showed an increase in indirect alloreactivity when compared to patients maintained on TAC and at the molecular level, in tissue biopsies using gene expression microarray technology, activation of the adaptive immune response. However, due to the limited sample size and follow up period in this study, it is difficult to identify any clinical consequences based on the immunological findings in this study and longer follow up period is necessary to evaluate the clinical impact of these immune alterations in patients converted to SRL from TAC.
MATERIALS AND METHODS
Patients’ cohort
Thirty patients (12 from TAC-maintenance group and 18 patients from SRL-converted group) were randomly selected from a cohort of 275 patients enrolled in an open-label, single-center, randomized study (Clinical Trial ID: NCT00866879) in which de novo renal allograft recipients were randomly assigned to undergo conversion from TAC to SRL at 12-months post-transplantation or to continue on TAC. The Institutional Review Board of Northwestern University, Chicago, IL, approved the study. KT recipients, older than 18 years, were assessed for eligibility. Patients with ESRD secondary to primary FSGS, severe proteinuria (>0.5g/day), estimated GFR (eGFR) by abbreviated Modification of Diet in Renal Disease (MDRD) equation < 40 ml/min, history of more than 2 episodes of acute cellular rejection (ACR) post-transplantation, or with a history of more than grade 1 ACR by Banff classification within 3-months prior to randomization, were excluded from the study.
Immunosuppression and randomization
All patients were induced with Alemtuzumab and methylprednisolone, with rapid steroid elimination. All patients were maintained on a steroid-free regimen with TAC and MMF. At 12-months post-transplantation, eligible patients who consented to be in the study were randomized in a 2:1 ratio to convert to SRL/MMF or to continue on TAC/MMF.
Target 12-hour trough levels for TAC were 8–10 ng/mL during the first three months, 7–9 ng/mL from four to six months post-transplant, and 6–8 ng/mL thereafter. MMF was started postoperatively at a dose of 2,000 mg/day and were adjusted as indicated for leukopenia. At the time of conversion, SRL was started at 2 mg/day to achieve a target 24-hour trough level for SRL between 5–8 ng/mL during the post-transplant period. During the first two weeks of conversion, TAC dosage was decreased by 50% and then stopped.
Renal Allograft Function Measurement and Histopathology
GFR was estimated at different time points (1, 3, 6, and every 3 months thereafter) using the abbreviated MDRD equation.33 Kidney biopsy was performed at 24-months post-randomization and also if clinical and/or laboratory signs indicated rejection. The histopathology was blindly evaluated by a renal pathologist following Banff 2005 criteria.34 Immunohistochemical stains for CD68 was done to evaluate the macrophage infiltration. (Anti-human CD68; Dako, Carpinteria, CA)
Phenotypic characterization of T cell subsets
T cell subpopulations from peripheral blood samples were identified at randomization (baseline) and at 6-, 12-, and 24-months post-randomization by multicolor flow cytometry and were analyzed as described previously.35, 36
For T cell subtype analysis, the fresh whole blood was stained with CD45-FITC(BD Biosciences, San Jose, CA), CD3-ECD(Beckman Coulter, Brea CA), CD45RA-FITC(BD Biosciences), CD45RO-FITC(BD Biosciences), CD4-PE(BD), CD25-PE(BD Biosciences), CD28-PE(BD Biosciences), CD8-APC(BD Biosciences). After incubation, the whole blood lysing reagent kit (Beckman Coulter) was used. The percentages of cells were analyzed by Cytomics FC500 flow cytometer and CXP software (Beckman Coulter). Changes in frequencies and absolute numbers of each subpopulation were assessed over time and compared between TAC vs. SRL and to baseline values.
For intracellular FOXP3 staining, PBMC were isolated by Ficoll-Hypaque gradient centrifugation. The freshly isolated PBMC were labeled with CD4-FITC(eBioscience, San Diego, CA), CD25-APC(eBioscience), and CD45-PerCP(BD Biosciences). After incubation and washing, the cells were fixed and permeabilized and then incubated with FOXP3-PE(eBioscience). We analyzed the percentage of cells by FACSCalibur flow cytometer(BD Biosciences). Treg were identified as CD4+CD25+++FoxP3+ and the number of cells per cubic millimeter of blood was calculated. Median fluorescent intensity (MFI) of Foxp3 was measured by Flowjo software v.10 (Tree Star, Ashland, OR).
Elispot assay
Donor-specific alloreactivity was measured in an IFN-γ ELISPOT assay after 48-hours incubation with irradiated donor cells for direct alloreactivity. To evaluate the indirect alloreactivity, we tested all PBMC samples with both donor cell-membrane sonicates and a mixture of synthetic mismatched HLA class I and class II donor-specific peptides. The detailed methodology for both methods was described previously.13, 14 PHA stimulation was used as a positive control. The resulting spots were counted with a computer-assisted ELISAspot image analyzer (Cellular Technology, Cleveland, OH)
Statistical analysis
Descriptive statistics (means and standard deviation for continuous variable; frequency and count for categorical variables) was used to analyze the data. Chi-square test or exact Fisher tests were used to compare categorical variables. Two-sample t-test or Mann-Whitney U test were used for continuous variables. All analyses were conducted using SAS 9.2 (SAS, Cary, NC). All p-values were two-sided, and a p-value <0.05 was considered statistically significant.
Kidney biopsy samples and RNA isolation
Graft biopsy samples at 24 months post-randomization were collected in RNAlater™ reagent (Ambion, Austin, TX) and stored at −80°C until use. Total RNA was isolated using Trizol (Life Technologies, Carlsbad, CA) following the guidelines and recommendations in the Affymetrix GeneChip® Expression Analysis Manual (Affymetrix, Santa Clara, CA). RNA quality control was evaluated following previous established parameters for microarray hybridization.37
Gene expression microarray hybridization and analysis
Total RNA were reverse transcribed and used for in vitro transcription to generate labeled cDNA using Affymetrix™ 3′ IVT Express Kit® (Affymetrix) following manufacturer protocol and recommendations. Affymetrix™ HG-U133A v2.0 GeneChip® microarrays for gene expression(n = 30) were hybridized and scanned on an Affymetrix GeneChip® Scanner 3000 G7. Quality control and normalization were performed as reported previously.38 Probe sets raw intensities were stored in electronic files (.DAT and .CEL formats) by the GeneChip® Operating Software(GCOS). Statistical analyses were performed over all probesets (n=22,277) on each GeneChip® microarray including control probesets to discard significant differences. A two-sample t-test was fit for TAC vs. SRL comparison in the R programming environment.39 A p-value <0.05 was considered significant for differentially expressed genes. Differential gene expression was illustrated using fold-changes.
Interaction networks, functional analysis, and upstream regulators
Gene ontology analyses were performed using Ingenuity Pathways Analysis (IPA; www.ingenuity.com). Spreadsheet lists containing probeset IDs, Gene IDs, and fold-changes were uploaded to IPA. For these analyses, p-values <0.05 were considered significant. Molecular pathway activity was interpreted using activation z-score(z) generated by IPA. Briefly, z-score estimates the behavior and relationship among several scores to the calculated mean. Zero z-score value indicates similar statistical behavior while positive or negative values indicate shifted trend to activation or inhibition, respectively.
Supplementary Material
Acknowledgments
This research study was funded in part by a National Institute of Diabetes and Digestive and Kidney Diseases (NIDDK) grant, R01DK080074.
ABBREVIATIONS
- ACR
acute cellular rejection
- CAD
chronic allograft dysfunction
- CNI
Calcineurin inhibitors
- DGF
Delayed graft function
- eGFR
Estimated glomerular filtration rate
- KT
kidney transplant
- MDRD
Modification of diet in renal disease
- MFI
Median fluorescent intensity
- MMF
Mycophenolate mofetil
- PBMC
Peripheral blood mononuclear cells
- PRA
Panel reactive antibody
- PHA
phytohemagglutinin
- mTOR
Mammalian target of rapamycin
- ROS
Reactive oxygen species
- SD
Standard deviation
- SRL
Sirolimus
- TAC
Tacrolimus
- Treg
Regulatory T cells
- Tx
Transplantation
Footnotes
DISCLOSURE
The authors do not have any conflicts of interest to disclose.
Additional Supporting Information may be found in the online version of this article.
Supplemental Table S1: All significant molecular pathways between SRL vs. TAC groups.
Supplemental information and supplemental Figures 1 and 2: Validation of microarray results for 4 genes up-regulated in the SRL group when compared to TAC group using RT-qPCR reactions
References
- 1.Meier-Kriesche HU, Schold JD, Srinivas TR, et al. Lack of improvement in renal allograft survival despite a marked decrease in acute rejection rates over the most recent era. American journal of transplantation : official journal of the American Society of Transplantation and the American Society of Transplant Surgeons. 2004;4:378–383. doi: 10.1111/j.1600-6143.2004.00332.x. [DOI] [PubMed] [Google Scholar]
- 2.Grinyo JM, Bestard O, Torras J, et al. Optimal immunosuppression to prevent chronic allograft dysfunction. Kidney Int Suppl. 2010:S66–70. doi: 10.1038/ki.2010.426. [DOI] [PubMed]
- 3.Chhabra D, Skaro AI, Leventhal JR, et al. Long-term kidney allograft function and survival in prednisone-free regimens: tacrolimus/mycophenolate mofetil versus tacrolimus/sirolimus. Clin J Am Soc Nephrol. 2012;7:504–512. doi: 10.2215/CJN.06940711. [DOI] [PMC free article] [PubMed] [Google Scholar]
- 4.Mannon RB. Therapeutic targets in the treatment of allograft fibrosis. American journal of transplantation : official journal of the American Society of Transplantation and the American Society of Transplant Surgeons. 2006;6:867–875. doi: 10.1111/j.1600-6143.2006.01261.x. [DOI] [PubMed] [Google Scholar]
- 5.Racusen LC, Solez K, Colvin RB, et al. The Banff 97 working classification of renal allograft pathology. Kidney Int. 1999;55:713–723. doi: 10.1046/j.1523-1755.1999.00299.x. [DOI] [PubMed] [Google Scholar]
- 6.Solez K, Colvin RB, Racusen LC, et al. Banff 07 classification of renal allograft pathology: updates and future directions. American journal of transplantation : official journal of the American Society of Transplantation and the American Society of Transplant Surgeons. 2008;8:753–760. doi: 10.1111/j.1600-6143.2008.02159.x. [DOI] [PubMed] [Google Scholar]
- 7.Helal I, Chan L. Steroid and calcineurin inhibitor-sparing protocols in kidney transplantation. Transplant Proc. 2011;43:472–477. doi: 10.1016/j.transproceed.2011.01.054. [DOI] [PubMed] [Google Scholar]
- 8.Blydt-Hansen TD, Gibson IW, Birk PE. Histological progression of chronic renal allograft injury comparing sirolimus and mycophenolate mofetil-based protocols. A single-center, prospective, randomized, controlled study. Pediatr Transplant. 2010;14:909–918. doi: 10.1111/j.1399-3046.2010.01374.x. [DOI] [PubMed] [Google Scholar]
- 9.Budde K, Becker T, Arns W, et al. Everolimus-based, calcineurin-inhibitor-free regimen in recipients of de-novo kidney transplants: an open-label, randomised, controlled trial. Lancet. 2011;377:837–847. doi: 10.1016/S0140-6736(10)62318-5. [DOI] [PubMed] [Google Scholar]
- 10.Lebranchu Y, Thierry A, Toupance O, et al. Efficacy on renal function of early conversion from cyclosporine to sirolimus 3 months after renal transplantation: concept study. American journal of transplantation : official journal of the American Society of Transplantation and the American Society of Transplant Surgeons. 2009;9:1115–1123. doi: 10.1111/j.1600-6143.2009.02615.x. [DOI] [PubMed] [Google Scholar]
- 11.Schena FP, Pascoe MD, Alberu J, et al. Conversion from calcineurin inhibitors to sirolimus maintenance therapy in renal allograft recipients: 24-month efficacy and safety results from the CONVERT trial. Transplantation. 2009;87:233–242. doi: 10.1097/TP.0b013e3181927a41. [DOI] [PubMed] [Google Scholar]
- 12.Weir MR, Mulgaonkar S, Chan L, et al. Mycophenolate mofetil-based immunosuppression with sirolimus in renal transplantation: a randomized, controlled Spare-the-Nephron trial. Kidney Int. 2011;79:897–907. doi: 10.1038/ki.2010.492. [DOI] [PubMed] [Google Scholar]
- 13.Najafian N, Salama AD, Fedoseyeva EV, et al. Enzyme-linked immunosorbent spot assay analysis of peripheral blood lymphocyte reactivity to donor HLA-DR peptides: potential novel assay for prediction of outcomes for renal transplant recipients. Journal of the American Society of Nephrology : JASN. 2002;13:252–259. doi: 10.1681/ASN.V131252. [DOI] [PubMed] [Google Scholar]
- 14.Augustine JJ, Siu DS, Clemente MJ, et al. Pre-transplant IFN-gamma ELISPOTs are associated with post-transplant renal function in African American renal transplant recipients. American journal of transplantation : official journal of the American Society of Transplantation and the American Society of Transplant Surgeons. 2005;5:1971–1975. doi: 10.1111/j.1600-6143.2005.00958.x. [DOI] [PubMed] [Google Scholar]
- 15.Salama AD, Najafian N, Clarkson MR, et al. Regulatory CD25+ T cells in human kidney transplant recipients. Journal of the American Society of Nephrology : JASN. 2003;14:1643–1651. doi: 10.1097/01.asn.0000057540.98231.c1. [DOI] [PubMed] [Google Scholar]
- 16.Saemann MD, Haidinger M, Hecking M, et al. The multifunctional role of mTOR in innate immunity: implications for transplant immunity. American journal of transplantation : official journal of the American Society of Transplantation and the American Society of Transplant Surgeons. 2009;9:2655–2661. doi: 10.1111/j.1600-6143.2009.02832.x. [DOI] [PubMed] [Google Scholar]
- 17.De Serres SA, Yeung MY, Mfarrej BG, et al. Effect of biologic agents on regulatory T cells. Transplant Rev (Orlando) 2011;25:110–116. doi: 10.1016/j.trre.2010.11.002. [DOI] [PubMed] [Google Scholar]
- 18.Turnquist HR, Raimondi G, Zahorchak AF, et al. Rapamycin-conditioned dendritic cells are poor stimulators of allogeneic CD4+ T cells, but enrich for antigen-specific Foxp3+ T regulatory cells and promote organ transplant tolerance. Journal of immunology. 2007;178:7018–7031. doi: 10.4049/jimmunol.178.11.7018. [DOI] [PubMed] [Google Scholar]
- 19.Valmori D, Tosello V, Souleimanian NE, et al. Rapamycin-mediated enrichment of T cells with regulatory activity in stimulated CD4+ T cell cultures is not due to the selective expansion of naturally occurring regulatory T cells but to the induction of regulatory functions in conventional CD4+ T cells. Journal of immunology. 2006;177:944–949. doi: 10.4049/jimmunol.177.2.944. [DOI] [PubMed] [Google Scholar]
- 20.Ohtani M, Nagai S, Kondo S, et al. Mammalian target of rapamycin and glycogen synthase kinase 3 differentially regulate lipopolysaccharide-induced interleukin-12 production in dendritic cells. Blood. 2008;112:635–643. doi: 10.1182/blood-2008-02-137430. [DOI] [PMC free article] [PubMed] [Google Scholar]
- 21.Chhabra D, Alvarado A, Dalal P, et al. Impact of calcineurin-inhibitor conversion to mTOR inhibitor on renal allograft function in a prednisone-free regimen. American journal of transplantation : official journal of the American Society of Transplantation and the American Society of Transplant Surgeons. 2013;13:2902–2911. doi: 10.1111/ajt.12437. [DOI] [PubMed] [Google Scholar]
- 22.Zhao T, Yang C, Qiu Y, et al. Comparison of regulatory T cells and FoxP3-positive T-cell subsets in the peripheral blood of renal transplant recipients with sirolimus versus cyclosporine: a preliminary study. Transplant Proc. 2013;45:148–152. doi: 10.1016/j.transproceed.2012.06.067. [DOI] [PubMed] [Google Scholar]
- 23.Hendrikx TK, Velthuis JH, Klepper M, et al. Monotherapy rapamycin allows an increase of CD4 CD25 FoxP3 T cells in renal recipients. Transpl Int. 2009;22:884–891. doi: 10.1111/j.1432-2277.2009.00890.x. [DOI] [PubMed] [Google Scholar]
- 24.Chauhan SK, Saban DR, Lee HK, et al. Levels of Foxp3 in regulatory T cells reflect their functional status in transplantation. Journal of immunology. 2009;182:148–153. doi: 10.4049/jimmunol.182.1.148. [DOI] [PMC free article] [PubMed] [Google Scholar]
- 25.Mannon RB, Matas AJ, Grande J, et al. Inflammation in areas of tubular atrophy in kidney allograft biopsies: a potent predictor of allograft failure. American journal of transplantation : official journal of the American Society of Transplantation and the American Society of Transplant Surgeons. 2010;10:2066–2073. doi: 10.1111/j.1600-6143.2010.03240.x. [DOI] [PMC free article] [PubMed] [Google Scholar]
- 26.Hartono C, Muthukumar T, Suthanthiran M. Noninvasive diagnosis of acute rejection of renal allografts. Current opinion in organ transplantation. 2010;15:35–41. doi: 10.1097/MOT.0b013e3283342728. [DOI] [PMC free article] [PubMed] [Google Scholar]
- 27.Liefeldt L, Brakemeier S, Glander P, et al. Donor-specific HLA antibodies in a cohort comparing everolimus with cyclosporine after kidney transplantation. American journal of transplantation : official journal of the American Society of Transplantation and the American Society of Transplant Surgeons. 2012;12:1192–1198. doi: 10.1111/j.1600-6143.2011.03961.x. [DOI] [PubMed] [Google Scholar]
- 28.O’Garra A, Murphy KM. From IL-10 to IL-12: how pathogens and their products stimulate APCs to induce T(H)1 development. Nat Immunol. 2009;10:929–932. doi: 10.1038/ni0909-929. [DOI] [PubMed] [Google Scholar]
- 29.Weichhart T, Costantino G, Poglitsch M, et al. The TSC-mTOR signaling pathway regulates the innate inflammatory response. Immunity. 2008;29:565–577. doi: 10.1016/j.immuni.2008.08.012. [DOI] [PubMed] [Google Scholar]
- 30.Schmitz F, Heit A, Dreher S, et al. Mammalian target of rapamycin (mTOR) orchestrates the defense program of innate immune cells. Eur J Immunol. 2008;38:2981–2992. doi: 10.1002/eji.200838761. [DOI] [PubMed] [Google Scholar]
- 31.Hester J, Mills N, Shankar S, et al. Th17 cells in alemtuzumab-treated patients: the effect of long-term maintenance immunosuppressive therapy. Transplantation. 2011;91:744–750. doi: 10.1097/TP.0b013e31820c85dc. [DOI] [PMC free article] [PubMed] [Google Scholar]
- 32.Blatner NR, Mulcahy MF, Dennis KL, et al. Expression of RORgammat marks a pathogenic regulatory T cell subset in human colon cancer. Sci Transl Med. 2012;4:164ra159. doi: 10.1126/scitranslmed.3004566. [DOI] [PMC free article] [PubMed] [Google Scholar]
- 33.Gaspari F, Ferrari S, Stucchi N, et al. Performance of different prediction equations for estimating renal function in kidney transplantation. American journal of transplantation : official journal of the American Society of Transplantation and the American Society of Transplant Surgeons. 2004;4:1826–1835. doi: 10.1111/j.1600-6143.2004.00579.x. [DOI] [PubMed] [Google Scholar]
- 34.Solez K, Colvin RB, Racusen LC, et al. Banff ‘05 Meeting Report: differential diagnosis of chronic allograft injury and elimination of chronic allograft nephropathy (‘CAN’) American journal of transplantation : official journal of the American Society of Transplantation and the American Society of Transplant Surgeons. 2007;7:518–526. doi: 10.1111/j.1600-6143.2006.01688.x. [DOI] [PubMed] [Google Scholar]
- 35.De Serres SA, Mfarrej BG, Magee CN, et al. Immune profile of pediatric renal transplant recipients following alemtuzumab induction. Journal of the American Society of Nephrology : JASN. 2012;23:174–182. doi: 10.1681/ASN.2011040360. [DOI] [PMC free article] [PubMed] [Google Scholar]
- 36.van de Berg PJ, Hoevenaars EC, Yong SL, et al. Circulating lymphocyte subsets in different clinical situations after renal transplantation. Immunology. 2012;136:198–207. doi: 10.1111/j.1365-2567.2012.03570.x. [DOI] [PMC free article] [PubMed] [Google Scholar]
- 37.Dumur CI, Nasim S, Best AM, et al. Evaluation of quality-control criteria for microarray gene expression analysis. Clin Chem. 2004;50:1994–2002. doi: 10.1373/clinchem.2004.033225. [DOI] [PubMed] [Google Scholar]
- 38.Mas VR, Maluf DG, Stravitz R, et al. Hepatocellular carcinoma in HCV-infected patients awaiting liver transplantation: genes involved in tumor progression. Liver Transpl. 2004;10:607–620. doi: 10.1002/lt.20118. [DOI] [PubMed] [Google Scholar]
- 39.Team RDC. R: A Language and Environment for Statistical Computing. R Foundation for Statistical Computing; 2005. [Google Scholar]
Associated Data
This section collects any data citations, data availability statements, or supplementary materials included in this article.