

Abstract
Vascular inflammation is a major contributor to the severity of acute kidney injury. In the context of vasospasm-independent reperfusion injury we studied the potential anti-inflammatory role of the Gα-related RGS protein, RGS4. Transgenic RGS4 mice were resistant to 25 minute injury, although post-ischemic renal arteriolar diameter was equal to the wild type early after injury. A 10 minute unilateral injury was performed to study reperfusion without vasospasm. Eighteen hours after injury blood flow was decreased in the inner cortex of wild type mice with preservation of tubular architecture. Angiotensin II levels in the kidneys of wild type and transgenic mice were elevated in a sub-vasoconstrictive range 12 and 18 hours after injury. Angiotensin II stimulated pre-glomerular vascular smooth muscle cells (VSMC) to secrete the macrophage chemoattractant, RANTES; a process decreased by angiotensin II R2 (AT2) inhibition. However, RANTES increased when RGS4 expression was suppressed implicating Gα protein activation in an AT2-RGS4-dependent pathway. RGS4 function, specific to VSMC, was tested in a conditional VSMC-specific RGS4 knockout showing high macrophage density by T2 MRI compared to transgenic and non-transgenic mice after the 10 minute injury. Arteriolar diameter of this knockout was unchanged at successive time points after injury. Thus, RGS4 expression, specific to renal VSMC, inhibits angiotensin II-mediated cytokine signaling and macrophage recruitment during reperfusion, distinct from vasomotor regulation.
Keywords: acute kidney injury, renin angiotensin system, ischemia reperfusion
Regulators of G protein signaling (RGS) proteins are key components in the vascular function of the kidney (1, 2). They have also been attributed anti-inflammatory properties in disease states such as atherosclerosis and diabetic cardiomyopathy (3–5). The regulators of G protein signaling (RGS) are GTPase activating proteins (GAPs) that bind to heterotrimeric Gαβγ proteins and inactivate the α subunit. RGS4 is subcategorized as a vascular-associated RGS protein with GAP function for Gq and Gi family members (6, 7). In addition to modulating vascular tone (2) RGS4 is upregulated in vascular smooth muscle cells (VSMC) susceptible to atherosclerosis (3). RGS4 also contributes to a decrease in angiotensin-dependent superoxide production (8), prevents vascular oxidation (5) and may be involved in the inhibition of cell signaling through CXC-motif chemokine receptors (9).
The alpha subunit in Gα-containing receptors (GαR) is a well-known RGS4 binding partner (10). We have previously shown RGS4 to inactivate the endothelin-1, Gα-associated, receptor in the kidney. In the absence of RGS4, acute ischemic injury is prolonged. However the activity of RGS4 on AngII signaling in the context of reperfusion is unclear. AngII can activate local cytokine signaling in the VSMC (11), initiate TGF-β signaling in tubular epithelial cells (12), provoke activation of the coagulation cascade on the surface of the endothelial cell (13), induce leukocyte adhesion in arterioles (14) and induce endothelial cell senescence (15) independent of its vasconstrictive action.
Activation of G protein coupled receptors (GPCRs) in the renal microvasculature by endothelin-1 and angiotensin-II (AngII) is central to the progress of ischemia/reperfusion injury (IRI) (16–19). AngII generation is stimulated by hypoperfusion initially, but may be perpetuated by endothelial injury and localized production of angiotensin converting enzyme (ACE) in monocytes (20) independent of ischemic conditions. In turn it has been recognized that leukocyte binding in the renal microvasculature during reperfusion is not dependent on arterial vasoconstriction (21). By discriminating between the vasoactive and non-vasoactive effect of RGS4-monitored GPCR signaling one can better understand the inciting events leading to microvasculature injury in the kidney. Contrasting our earlier work which focused on the ischemic component of IRI, we report on the anti-inflammatory function of RGS4 that is distinct from the modulation of arterial vasoconstriction. By specifically enhancing RGS4 expression in an animal model we demonstrate that RGS4 is a critical agent in the prevention of reperfusion injury.
Results
Enhanced RGS4 expression in the microvasculature prevents acute kidney injury
RGS4 expression has been identified in arteries of the kidney with a β-galactosidase (βgal) gene knock-in reporter system (RGS4 LacZ) (2). We compared the RGS4 LacZ RGS4 reporter system with a second model that incorporates multiple copies of a bacterial artificial chromosome (BAC). The RGS4 LacZ construct has been described previously. The BAC transgene contains the RGS4 coding region and an IRES-eGFP construct inserted into the 3′ UTR of the RGS4 locus (22, 23). We further used the RGS4-eGFP transgenic mouse (Tg) as a relative overexpressor (22) to contrast our previous description of the rgs4 null mouse (2, 24).
At baseline, RGS4-promoter-driven βgal in the RGS4 LacZ is expressed in afferent and efferent arterioles (Figure 1A) and peritubular capillaries. In Tg animals RGS4 co-localizes with smooth muscle myosin heavy chain positive (MHC+) cells in the kidney consistent with small vascular structures of the inner cortex and outer medulla (Figure 1B). This was demonstrated by histology and quantified by FACS analysis where RGS4+ cells were found to be a subset of SMMHC+ cells (Figure 1C).
Figure 1.

RGS4 expression in the kidney of β-gal knock-in and eGFP transgenic reporter systems. (A) Composite images were analyzed for baseline RGS4-driven β-gal expression (scale bar 500μ). β-gal is expressed in the outer cortex of the afferent and efferent arterioles of glomeruli (G) and in peritubular capillaries (scale bar 25μ). (B) RGS4 expression in the eGFP transgenic reporter system is present in arterioles and capillaries adjacent to tubules (t) (top row) (scale bar 25μ). Mid-sized vessels express RGS4 in SMMHC+ cells in the medial wall adjacent to PECAM+ cells in the intimal lining (bottom row) with no apparent co-localization (scale bar, 25μ). (C) Flow cytometry of kidney digest from Tg, first permeabilized then probed with monoclonal antibodies to SMMHC and RGS4. 48.5%±3.2 of SMMHC+ cells were also RGS4+/SMMHC+ (n=4).
Four hours after the initiation of kidney reperfusion the endogenous RGS4 promoter was more readily bound by RNA polymerase and tissue levels of RGS4 protein increased. Binding of the RGS4 promoter resulting in RGS4 mRNA transcription is directly correlated to β-galactosidase expression in the RGS4 LacZ animal model as previously reported (7). Congenic controls displayed an increased amount of RGS4 protein in kidney tissue at the same four hour time point (Figure 2A, B). RGS4 protein levels rapidly declined at later time points in wild-type (WT) animals. This was consistent with βgal expression in the corticomedullary junction of RGS4 LacZ animals (Figure 2A) and with RGS4 protein levels in the same region of WT (Figure 2B). We therefore hypothesized that increased RGS4 protein expression in the kidneys of Tg mice is protective in the setting of ischemia-reperfusion injury and contrasts the phenotype of rgs4 null mice (2). After 25BI, renal function in Tg was preserved in comparison to littermate controls (Figure 3A) and corresponded with a reduction in tubular injury after 24 hours (Figure 3B) when Tg animals expressed maintained levels of RGS4 compared to WT+IRI (Figure 3C).
Figure 2.
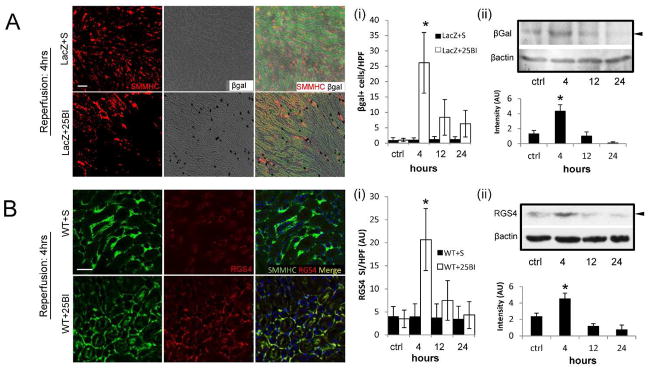
RGS4 expression in renal tissue before and after standard ischemic injury and RGS4 overexpression. (A) RGS4-LacZ reporter mice express SMMHC (red) consistent with typical histologic location of microvasculature adjacent to epithelial tubular cells (green epifluorescence) in animals undergoing sham ischemic kidney injury (scale bar 50μ) (top row). (i) RGS4-LacZ animals express β-galactosidase (black, bright field) after 25 minute bilateral injury (LacZ+25BI) (26±10 cells/hpf) (n=10) most accentuated 4 hours after ischemia (bottom row) compared to 12 hours (8±6) (n=9) (*, p=3.4×10⁻¹⁰). (ii) Representative luminescent intensity in arbitrary units (AU) from an immunoblot of RGS4-LacZ kidney tissue after 25BI, probed with anti-beta Galactosidase (βgal) antibody and developed with horseradish peroxidase (n=6,6,6,6 per group) control (1.37±0.39) vs 4 hours after ischemia (4.38±0.81) (*, p=0.01). (B) A similar expression pattern is identified in non-transgenic animals analyzed with anti-RGS4 monoclonal antibody (red). (i) RGS4-specific binding was quantified by cy3 signal intensity per high power field (SI/HPF). Structures consistent with arterioles and peritubular capillaries contained both SMMHC and RGS4 in shams (top row) and 4 hours after 25BI (bottom row) (scale bar 50μ). WT+25BI at 4 hrs (20.7±6.7) (n=8) vs 12 hrs (7.5±4.3) (n=8) (*, p=1.8×10⁻⁹). (ii) Representative luminescent intensity in arbitrary units (AU) from an immunoblot of RGS4 in WT kidney tissue after 25 minute ischemic injury, probed with anti-RGS4 monoclonal antibody and developed with horseradish peroxidase (n=8,8,8,8 per group), control (2.39±0.4) vs 4 hours after ischemia (4.56±0.65) (*, p=0.002).
Figure 3.

RGS4 overexpression prevents acute kidney injury. (A) 24 hours after injury, blood urea nitrogen (BUN) (mg/dL) in control (n=6) animals increased to 40.9±4. vs 31.1±6.0 in Tg (n=6) (*, p=0.004); after 48 hours, 62.6±16.8 (n=6) vs 31.1±6.0 (n=6) respectively (**, p=2.56×10⁻⁵); after 72 hours, 33.4±6.0 (n=6) vs 24.3±1.3 (n=6) (p=NS). 24 hours after injury, serum creatinine (sCr, mg/dL) in control animals increased to 1.12±0.09 (n=6) vs Tg 0.43±0.07 (n=6) (*, p=6.26×10⁻⁵); after 48 hours, 1.68±0.20 (n=6) vs 0.60±0.10 (n=6) respectively (**, p=5.09×10⁻¹⁰); after 72 hours, 0.85±0.18 (n=6) vs 0.24±0.03 (n=6) respectively (ƚ, p=0.004); after 96 hours, 0.25±0.04 vs 0.17±0.07 (p=NS). (B) Kidney tissue from littermate controls and Tg animals, were stained with hematoxylin and eosin to evaluate cellular structures for damage. To calculate a tubular injury score, kidney sections were processed after 24 hrs of reperfusion and were evaluated for tubule flattening, necrosis, apoptosis, or presence of casts as a percentage of total number of tubular epithelial cells per high power field. WT+25BI (27.8±8.3%) (n=7) vs Tg+25BI (8.2±2.4%) (n=7), vs respectively (*, p=0.002) (scale bar, 50μ). (C) RGS4 protein levels were measured by immunoblot technique at corresponding time points after injury in wild-type controls and RGS4 overexpressor animals (Tg) respectively at baseline 0.286± 0.032 (n=8) vs 1.98± 0.736 (n=8) (*, p=1.94×10⁻⁹), 24 hours, 0.298± 0.0613 (n=8) vs 1.58± 0.353(n=8) (**, p=2.42×10⁻⁹), 48 hours 0.196± 0.031 (n=8) vs 1.85± 0.451(n=8) (ƚ, p=4.93×10⁻¹³); 72 hours, 0.0964± 0.0123 (n=8) vs 1.89± 0.509(n=8) (ƚƚ, p=2.59×10⁻¹⁴); 96 hours, 0.153± 0.0241(n=8) vs 1.87± 0.518 (n=8) (^, p=1.17×10⁻¹³).
RGS4 prevents reperfusion injury in a non-vasoconstricted state
Experiments above showed RGS4 is expressed in vascular smooth muscle cells of the kidney. Although we also observed baseline blood pressure in Tg animals equivalent to congenic controls (Suppl. Figure 1), we had previously described prolonged vasospasm in rgs4 null mice after endothelin-1 challenge (2). We therefore evaluated if the preservation of renal function in RGS4 transgenic mice was due to an abrogation of vasospasm. We tested this hypothesis by performing a series of experiments involving in vivo 2-photon microscopy. Unexpectedly, we found after 25BI, cross sectional renal arteriolar diameter of injured Tg was equivalent to injured WT after 0.5, 1, 6, 18 and 24 hours (Figure 4A). Because RGS4 has been independently associated with the modulation of macrophage transit (3, 4) we probed tissue with ED1 monoclonal antibody. ED1+ cell density was decreased in TG animals compared to injured controls 18 hrs after 25BI (Figure 4B). These results left the etiology of the RGS4 renoprotective effect unresolved as vasomodulatory or immunomodulatory in nature. To isolate the influence of VSMC in the microvasculature without implicating prolonged vasospasm and the sequela of tubular injury, we performed 10-minute unilateral ischemia (10UI) and evaluated vasoactive parameters at late successive time points in the injured kidney. Tubular injury scores indicated no presence of acute tubular necrosis 18 hours after microvascular clamp release (data not shown). Immunohistologic probe for KIM-1, a sensitive biomarker of tubular epithelial injury, was not detected in a density greater than shams (Figure 5A, B). In vivo renal arteriolar diameters in Tg+10UI and WT+10UI were unchanged after 0.5, 1, 6, 18 and 24 hours of reperfusion compared to no injury (Figure 5C).
Figure 4.

Small renal vessel response to reperfusion in RGS4 Tg after 25 minute bilateral ischemic injury (25BI). (A) Cutaneous regions proximate to the hilum exposed a confluence of (1) superficial cortical (2) and deeper structures. (B) Real-time small vessel diameter (red circle) from regions representative of deep kidney structures was measured with 2-photon microscopy (low power, left panels; high power, right panels, scale=60 μ). Three-dimensional images were re-constructed at successive time points after 25 minute bilateral renal microvascular clamp injury. (C) Cross sectional areas of vessels (μ2) of wild type vs. RGS4 transgenic animals were compared at baseline (n=4 animals per group) (324±21 vs 339±17), 0.5 hr (104±19 vs 122±17), 1 hr (179±21 vs 186±21), 6 hr (242±18 vs 230±16), 18 hr (321±20 vs 322±19), and 24 hr (329±17 vs 326±18), respectively. WT 0.5 hr vs WT 1 hr, *, p=3.9×10⁻⁷; Tg0.5 hr vs Tg 1 hr, **, p=3.8×10⁻⁶. (D) 18 hours after bilateral microvascular clamps were released, kidney tissue was procured from RGS4 transgenics and wild-type controls. Frozen sections were probed with ED1 monoclonal antibody, WT+S (2.5±0.7 cells/hpf) (n=5) vs WT+25BI (17.8±6.1) (n=6), p= 4.8×10⁻⁵; Tg+25BI (4.7±0.4) (n=6) vs WT+25BI, **, p=6.1×10⁻¹⁰, (scale=50 μ).
Figure 5.

Vascular changes after 10 minute unilateral microvascular clamping, (A) Kidney tissue from wild-type mice 18 hrs after 10UI and 25BI probed for thrombomodulin and KIM-1. (scale bar, 100μ) (B) Signal intensity (SI) (red) was normalized to pixel area (PA) per condition (n=5 per group) (*, p<0.001, 25BI vs WT 10UI). (C) Small vessel diameter (μ2) by 2-photon microscopy in kidneys of WT and Tg, respectively, undergoing 10UI, at baseline (BL) (332±21 [n=6] vs 338±26 [n=6]), 0.5 hr (329±24 [n=6] vs 337±24 [n=6]), 1 hr 342±25 [n=6] vs 336±28 [n=6]), 1 hr (342±25 [n=6] vs 336±28 [n=6]), 6 hr (343±34 [n=6] vs 348±41 [n=6]), 18 hr (352±31 [n=6] vs 333±22 [n=6]), 24 hr (334±27 [n=6] vs 335±32 [n=6]). (D) Dynamic MR imaging of the kidney after 10UI. Kidney distribution of gadolinium contrast 18 hours after 10UI in RGS4 Tg (first window) and wild type (second window). Blood flow was measured by change in gadolinium contrast intensity in individual pixel areas of the outer cortex (OC), inner cortex (IC) and medulla (M) in the coronal plane. (E) Regional perfusion in RGS4 overexpressor (Tg) (n=5) was compared to matched littermate shams (WT) (n=5) 18 hours after reperfusion. IC perfusion, WT+10UI (0.24±0.6) vs Tg+10UI (0.75±0.04) (*, p= 2.4×10⁻¹⁴) of, and medullary perfusion, WT+10UI (0.22±0.04) vs Tg+10UI (0.33±0.06) (**, p= 0.002).
18 hours after 10UI we evaluated in vivo renal blood flow by MRI. Fast imaging with steady-state precession (FISP) is a form of dynamic magnetic resonance imaging capable of measuring small alterations in blood flow. We adapted FISP MR imaging techniques to analyze in vivo renal blood flow (Figure 5D). Use of local arterial input function avoided the need for deconvolution of a global arterial input function (see Methods). Rate change of contrast inflow (α) correlated closely with rate change of contrast outflow (β) whereas renal blood flow measures did not correlate directly with either α or β (Suppl. Figure 2). Small regions of interest were analyzed with a computational algorithm using Bayesian analytic techniques (25) which demonstrated a difference in blood flow most apparent at the junction of the inner cortex and outer medulla (Suppl. movies 1,2,3). We observed a reduction in flow after 18 hours of reperfusion in littermate controls while Tg animals maintained perfusion equivalent to those observed in shams (Figure 5E). The disturbance in blood flow occurred in conditions where renal microvascular cross-sectional area, tubular injury scores, and KIM-1 expression, were equivalent to shams.
RGS4 inhibits Angiotensin-II-dependent RANTES synthesis in human aorta-derived vascular smooth muscle cells
Angiotensin-II (AngII) may contribute to reperfusion injury through activation of Gα-containing AngII receptors without affecting vasomotor tone (14). Ex vivo kidneys were prepared as we previously described (2) from littermate controls and Tg animals. Kidneys were perfused with 10pg·min−1 of AngII. Rate change in pressure per unit time (+Δp/Δt) after 40pg·min−1 of AngII for 20 minutes in isolated WT kidneys was 1.55 mmHg (n=6) versus no change in WT infused with 10pg·min−1 (n=6). +Δp/Δt in Tg infused with 40pg·min−1 of AngII (n=6) was 1.33 mmHg versus no change in Tg infused with 10pg·min−1 (n=6) (Figure 6A). Hence, there was no increase in perfusion pressure at the lower dose of AngII but ex vivo kidney tissue levels were comparable to elevated tissue levels from kidneys procured after 12 and 18 hours of reperfusion post-10UI (Figure 6B).
Figure 6.

Angiotensin II tissue levels increase after ex vivo AngII infusion in a sub-vasoconstrictive range and after 10 minute unilateral microvascular clamping. (A) Kidneys were isolated from wild-type (WT) or RGS4 transgenic overexpressor (TG) and placed on a perfusion apparatus and infused with 40pg·min−1 for 20 minutes. Baseline WT perfusion pressure 90.36±0.44 (n=6) vs 91.94±0.43 (n=6) after WT, 20 minutes of AngII infusion, 40pg·min−1 (*, p=2.3×10⁻⁷) vs 20 minutes of AngII infusion, 10pg·min−1, 90.39±0.23 mmHg (n=6) (p=NS). Baseline Tg perfusion pressure (mmHg) 90.47±0.38 (n=6) vs 91.77±0.39 (n=6) after 20 minutes of AngII infusion, 40pg·min−1 (**, p=8.7×10⁻⁷), vs 20 minutes of AngII infusion, 10pg·min−1, 90.44±0.38 mmHg (n=6) (p=NS). (B) Injured kidneys were procured after 1 hr, 12 hrs, and 18 hrs of reperfusion subsequent to 10 minute unilateral microvascular clamping. AngII kidney tissue [g] levels (pmol/mL per g of kidney) in WT BL (0.43±0.05) (n=6) vs WT 10pg/min (1.10±0.16) (n=6), (*, p=5.1×10⁻⁵); Tg BL (0.43±0.08) (n=6) vs Tg 10pg/min (1.04±0.15) (n=6), (**, p=4.5×10⁻⁵); WT 40pg/min (2.38±0.16) (n=6) vs WT 1 hr post-injury (1.20±0.19) (n=6), (ƚ, 1.46×10⁻⁸); Tg 40pg/min (2.61±0.20) (n=6) vs Tg 1 hr post-injury(1.13±0.20) (n=6), (ƚƚ, p=1.57×10⁻⁸); WT12 hr post-injury (0.80±0.06) (n=6) vs WT 10pg/min (NS); Tg (0.92±0.21) (n=6) vs TG 10pg/min (NS); WT 18 hr post-injury (0.78±12) (n=6) vs WT 10pg/min (^, p=0.001); Tg 18 hr post-injury (0.76±0.10) vs Tg 10pg/min (NS)
We evaluated possible cytokine signals that could be modulated by VSMC-dependent RGS4 expression. Primary human arterial VSMC cells were cultured and stimulated with AngII. VSMC supernatant was screened for 18 signaling cytokines (Figure 7A). RANTES, a monocyte chemoattractant secreted by VSMC (26), was elevated. Other cytokines known to be expressed by VSMC were also detected including MCP-1, IP-10, and VEGF. Levels of RANTES increased in response to AngII in a time-dependent fashion (Figure 7A inset). Secretion was exacerbated by RGS4 knockdown and was inhibited by pre-treatment with PD123319 (1μM), a specific inhibitor of the angiotensin II type 2 receptor. Pre-treatment with losartan (1μM) had no antagonistic effect (Figure 7B).
Figure 7.

RGS4 inhibits VSMC-derived RANTES expression after AngII stimulation (A) After AngII stimulation (100nM), human VSMC cytokine expression was analyzed by a Luminex-based assay containing microspheres specific to an array of cytokines (pg/mL): RANTES, MCP-1, IP-10, VEGF, TNFα, IL-4, IL-6, IL-5, IL-7, IL-1β, IL-10, IL-12 (p70), IL-17, IFN-γ, M-CSF, G-CSF, MIP-1β, MIP-2. Each cytokine level from AngII-stimulated cells compared to vehicle (saline)-stimulated cells reported as a ratio. RANTES levels in stimulated cells (n=8) compared to unstimulated cells (n=8) was 1.56±0.55(*, p<0.001 by Student’s t-test). Right inset (red box): 3, 6 and 12 hrs after AngII stimulation (10nM) compared to unstimulated controls. 3 hrs (3.10±0.92) (n=7) vs 6 hrs(11.41±1.93) (n=7) (*, p=8.3×10⁻¹¹). (B) RANTES expression after RGS4 inhibition and selective AT1R and AT2R inhibition. Scrambled siRNA (scr)+AngII (8.52±2.39) (n=6) vs RGS4-specific siRNA (siR4) (19.22±3.03) (n=6), (*, p=1×10⁻⁴); siR4+AngII+PD123319 (2.51±1.48) (n=7) vs siR4+AngII+losartan (15.73±4.43) (n=6), (**, p=2.6×10⁻⁹). (C) Ratio of mouse-derived pre-glomerular arteriolar diameter post- compared to pre- AngII stimulation. WT+1×10⁻⁸M AngII (0.90±0.04) (n=5) vs WT+1×10⁻⁷M AngII (0.78±0.09) (n=5), (*, p=0.003); Tg+1×10⁻⁸M AngII (0.89±0.07) vs Tg+1×10⁻⁷M AngII (0.75±0.06), (**, p=0.003). (D) RANTES (pg/mL) levels in supernatant of pre-glomerular arteriole-derived (mouse) VSMC in culture after AngII stimulation. WT+1×10⁻⁹M AngII (6.3±1.0) (n=5) vs Tg+1×10⁻⁹M AngII (2.8±1.0) (n=5), (*, p=1.4×10⁻⁶); WT+1×10⁻⁸M AngII (7.8±1.4) (n=6) vs Tg+1×10⁻⁸M AngII(2.9±0.7) (n=6), (**, p=1.2×10⁻⁸); WT+1×10⁻⁷M AngII (10.6±1.3) (n=6) vs Tg+1×10⁻⁷M (4.2±1.1) (n=6), (***, p=8.2×10⁻⁸).
Murine pre-glomerular vascular smooth muscle cells (PGVSMC) were then interrogated to determine if RANTES expression was modified by RGS4 expression in the above animal models. Isolation of PGVSMC was performed using an established technique (27). In brief, intra-arterial injection of iron oxide nanoparticles allowed for isolation of pre-glomerular arterioles by positive paramagnetic selection. Intact microvascular structures were then exposed to escalating doses of AngII. Vessel diameter was unchanged at low concentrations (1×10⁻⁹M) (Figure 7C). PGVSMC were also isolated and cultured. After exposure to AngII (1×10⁻⁹M), RANTES levels in the supernatant were elevated 125% in WT (6.3±1.0pg/mL) compared to R4Tg-derived (2.8±1.0) (p=1.4×10⁻⁶) (Figure 7D). RANTES levels were also elevated in WT compared to R4Tg after exposure to 1×10⁻⁸M and 1×10⁻⁷M AngII.
RGS4 expressed in SMMHC+ cells in the kidney compartment protects against macrophage localization in reperfusion injury
To determine the isolated function of RGS4 in VSMC in an animal model we employed a vascular smooth muscle cell-specific, RGS4 knockout animal model. A conditional RGS4 null mouse was created using a smooth muscle cell myosin heavy chain-11 (SMHHC) promoter to drive expression of Cre recombinase (28). The myosin heavy chain-11 promoter was used to select for differentiated cells with contractile function, avoiding Cre expression in poorly differentiated fibroblasts or myofibroblasts (29, 30). The SMMHC-Cre animal was crossed to the floxed animal, rgs4fl/fl generating a conditional knockout mouse, SMHHC-Cre rgs4fl/fl (CKO) (Figure 8). Cumulative survival after 25BI was decreased compared to SMMHC-Cre (Cre) controls undergoing the same 25BI procedure (Figure 9A). 24 hours after 25BI, CKO tubular injury scores were elevated compared to Cre controls undergoing 25BI (Figure 9B). 48 hours after 25BI, CKO serum creatinine was elevated 88% greater than Cre controls undergoing 25BI (Figure 9C). However, after 10UI, in vivo cross-sectional arteriolar diameter of the injured kidney was unchanged compared to SMMHC-Cre controls (Figure 9D). Ex vivo CKO kidneys responded similarly to SMMHC-Cre and Tg animals after AngII infusion. Kidneys from CKO animals placed on perfusion apparatus were infused with 40pg·min−1 for 10 minutes with sustained change in pressure per unit time (+Δp/Δt); 1.47 mmHg after 20 minutes (p<0.001) versus no change in CKO infused with 10pg·min−1 (Figure 9E). Kidneys perfused with AngII at a rate of 10pg/min−1 contained elevated levels of tissue AngII similar to that found at the 12 hour and 18 hour reperfusion time points after 10UI (Figure 9F).
Figure 8.

Vascular smooth muscle cell-specific deletion of RGS4 in an animal model. RGS4 floxed design (left), RGS4 transcript (middle) and RGS4 protein expression in the adrenal gland (zona glomerulosa cells), brain (neurons), and kidney (vascular smooth muscle cells) of SMMHC-Cre rgs4fl/fl animals after tamoxifen induction.
Figure 9.

SMMHC-Cre rgs4fl/fl response to ischemia/reperfusion injury. (A) 14 day survival in SMMHC-Cre controls (Cre) (n=8) and SMMHC-RGS4 knockout animals (CKO) (n=8) after 25 minute bilateral renal ischemia (Mantel–Cox log rank test p < 0.001). (B) Tubular injury score injury score after 24 hours (Cre+25BI [26.7±5.8%] [n=7] vs CKO+25BI [40.5±4.9%] [n=7], *, p=7.6×10⁻⁷) (C) Serum creatinine after 48 hours (Cre+25BI [1.26±0.13] [n=6] vs CKO+25BI [1.92±0.21] [n=5],*, p=5.2×10⁻⁷. (D) Vessel area after 10UI in Cre and CKO at baseline (BL), 0.5, 1, 6, 18, and 24 hours after microvascular clamp release. (E) Baseline Cre perfusion pressure 90.42±0.35 (n=6) vs 91.90±0.39 (n=6) Cre after 20 minutes of AngII infusion, 40pg·min−1 (*, p=1.2×10⁻⁷); baseline Cre vs 20 minutes of AngII infusion, 10pg·min−1, 90.36±0.37 mmHg (n=6) (p=NS). Baseline CKO perfusion pressure 90.44±0.37 (n=6) vs 91.85±0.38 (n=6) CKO after 20 minutes of AngII infusion, 40pg·min−1 (**, p=2.7×10⁻⁷); baseline CKO vs 20 minutes of AngII infusion, 10pg·min−1, 90.38±0.35 mmHg (n=6) (p=NS). (F) AngII kidney tissue levels. Kidneys were isolated and infused with 40pg·min−1, and 40pg·min−1. Injured kidneys were procured after 1 hrs, 12 hrs, and 18 hrs of reperfusion subsequent to 10 minute unilateral microvascular clamping. AngII kidney levels (pmol/ml per g of kidney) in Cre undergoing sham injury (0.45±0.03) (n=6) vs Cre 10pg/min (1.15±0.16) (n=6), (*, p=1.1×10⁻⁴); CKO BL (0.40±0.02) (n=6) vs CKO 10pg/min (1.03±0.12) (n=6), (**, p=7.5×10⁻⁴); Cre 40pg/min (2.51±0.21) (n=6) vs Cre 1 hr post-injury (1.32±0.12) (n=6), (ƚ, 1.26×10⁻⁷); CKO 40pg/min (2.33±0.32) (n=6) vs CKO 1 hr post-injury(1.31±0.12) (n=6), (ƚƚ, p=7.14×10⁻⁷); Cre 18 hr post-injury (0.82±0.15) (n=6) vs, Cre 10pg/min (NS); CKO 18 hr post-injury (0.0.89±0.10) (n=6) vs, CKO 10pg/min (NS).
We inferred that RGS4 depletion in VSMC would exacerbate AngII-induced monocyte localization because of the above findings including decreased ED1+ cell density in RGS4 overexpressors and RGS4-dependent modulation of RANTES secretion. Therefore we injected monocrystalline iron oxide nanoparticles (MION-47) intravenously to localize phagocytic cells, primarily macrophages (31), in live animals. Using 10 minute unilateral kidney injury (10UI) we then measured macrophage localization in the late reperfusion period (i.e. 18 hours of reperfusion). In vivo MR imaging of the injured kidney identified nanoparticles in CKO kidneys 18 hours after 10UI. Particle density was greater in CKO kidneys after 10UI than Cre controls undergoing the same procedure (Figure 10A). Injured Tg animals had less nanoparticle density compared to injured Cre controls (Figure 10B). CKO animals treated with PD123319 followed by 10UI had reduced nanoparticle density approaching that of Tg+10UI (Figure 10B). Increased density of ED1+ cells (Figure 11A, C) and Prussian blue + cells (Figure 11B, C) was coincident with a shorter normalized T2 relaxation time in CKO (Figure 10B). ED1 probing and Prussian blue staining were also decreased in CKO treated with PD123319.
Figure 10.
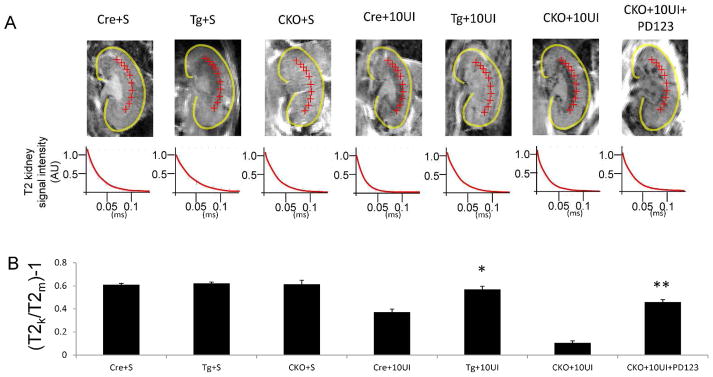
T2 imaging of injured kidneys in the coronal plane 18 hours after MION-47 injection and 10 minute unilateral ischemia injury. (A) SMMHC-Cre undergoing sham procedure (Cre+S), RGS4 overexpressor undergoing sham procedure (Tg+S), SMMHC-Cre rgs4 null undergoing sham procedure (CKO+S), SMMHC-Cre undergoing 10 minute unilateral ischemia (Cre+10UI), RGS4 overexpressor undergoing 10 minute unilateral ischemia (Tg+10UI), SMMHC-Cre rgs4 null undergoing 10 minute unilateral ischemia (CKO+10UI), SMMHC-Cre rgs4 null treated with PD123319 undergoing 10 minute unilateral ischemia (CKO+10UI+PD123). (B) T2 signal decay curves were measured subsequent to 10 minute microvascular clamping and 18 hrs of reperfusion. Regions of interest selected at the corticomedullary junction (red crosshairs). Calculated T2 signal in kidney (T2k) was compared to calculated T2 signal in adjacent psoas muscle (T2m). Cre+10UI (0.37±0.03) (n=7) vs TG+10UI (0.57±0.03) (n=7) (*, p=1.2×10⁻⁶); CKO+10UI (0.11±0.02) (n=7) vs CKO+10UI+PD123319 (0.46±0.02) (n=7) (**, p=2.3×10⁻⁸).
Figure 11.

Histologic analysis of kidneys subsequent to 10 minute unilateral ischemia and MION-47 injection and 18 hours of reperfusion. (A, C) ED-1 positive cells (FITC) in SMMHC-Cre undergoing sham procedure (Cre+S), RGS4 overexpressor undergoing sham procedure (Tg+S), SMMHC-Cre rgs4 null undergoing sham procedure (CKO+S), SMMHC-Cre undergoing 10 minute unilateral ischemia (Cre+10UI), RGS4 overexpressor undergoing 10 minute unilateral ischemia (Tg+10UI), SMMHC-Cre rgs4 null undergoing 10 minute unilateral ischemia (CKO+10UI), SMMHC-Cre rgs4 null treated with PD123319 undergoing 10 minute unilateral ischemia (CKO+10UI+PD123). Cre+10UI (10±2 cells) (n=10) vs Tg+10UI (3±1) (n=10) (*, p=1.1×10⁻⁸); (CKO+10UI) (41±5) (n=10) vs (CKO+10UI+PD123) (9±1) (n=10) (**, p=1.0×10⁻¹⁰). Scale bar=50 μ (B, C) Prussian blue staining of above tissue. (scale bar =50μ). Cre+10UI (10±2 cells) (n=10) vs Tg+10UI (4±1) (n=10) (*, p=2.1×10⁻⁸); (CKO+10UI) (42±6) (n=10) vs (CKO+10UI+PD123) (8±1) (n=10) (**, p=3.2×10⁻¹¹) (Scale bar=50μ).
Discussion
Based on the above studies we identify a previously unknown anti-inflammatory function of vascular smooth muscle cells in late reperfusion injury of the kidney. In particular, expression of RGS4 in smooth muscle cell-containing microvasculature decreases inflammatory signals that are transmitted by AngII receptor activation. We found that RGS4-overexpressing animals were protected from 25 minute bilateral ischemic injury based on serum creatinine values and tubular injury scoring. Our earlier work showed that the RGS4 global knockout was sensitive to renal IRI, therefore the phenotype of the RGS4 overexpressor was not unexpected. However it was unclear if protection offered by RGS4 overexpression was exclusively due to vasoconstrictor blockade in this standard model. We observed RGS4 protein levels to be highest 4 hours after microvascular clamp removal in 25 minute bilateral ischemic renal injury while tissue Angiotensin II levels remained elevated for several hours afterward. Takata and colleagues showed that 2.5μg/kg infusion of AngII over 4 weeks up-regulates RGS4 in LDL receptor knockout mice (3). Dose infusion in their study was equivalent to 2480pg/min in a 25g mouse which likely explains the blood pressure increase over this period of time from at least 108.0±6.5(mmHg) to 155.6±11.6. Therefore, reported RGS4 levels after 4 weeks could not be uncoupled from a significant increase in systemic blood pressure and supraphysiologic dose of AngII.
We chose a model of 10 minute unilateral injury (10UI) to highlight the anti-inflammatory potential of RGS4 in the absence of protracted ischemia and resultant tubular epithelial damage. In this model, AngII tissue levels 18 hours after injury remained elevated 81.3% above sham levels. Low tubular injury scores and minimal KIM-1 expression indicated tubular epithelial cells tissue quickly recovered from 10UI. Microvascular diameter as measured by intravital microscopy demonstrated a non-vasoconstricted state compared to controls whereas Dynamic MR studies showed blood flow to be reduced 18 hours after 10UI. Pre-glomerular VSMC were exposed to 1×10⁻⁹M AngII which generated sufficient RANTES that could be measured in supernatant after 8 hours. At equivalent AngII levels, RGS4 transgenic PGVSMC consistently expressed less RANTES than congenic controls. A change in blood flow by MR studies 18 hrs after reperfusion was therefore consistent with leukocyte localization in a setting absent of vasospasm. This parallels findings by Sanz and colleagues who identified monocyte diapedesis at low AngII infusion rates (14), i.e. less than 100ng·kg−1·min−1 (29). They observed monocytes adhering to mesenteric arterioles 4 hrs after an injection of 5.2 ng (approximately 17 ng/kg) of AngII in Sprague Dawley rats. At this dose mesenteric arteriolar diameter did not change. The same investigators demonstrated this with intravital microscopy using a 1nM infusion of AngII. When titrated, 100nM caused a 40% aggregate vascular collapse. However the rate of infusion, and therefore ng/kg per unit time dose, was not clear from these studies (32). Our ex vivo studies compared 40pg·min−1 to 10pg·min−1 with a notable change in vascular resistance at the higher dose. Our work does not identify the source of AngII during reperfusion injury but it does emphasize that elevated levels of AngII are present for several hours after an ischemic insult.
We suggest that local AngII generation contributes to renal reperfusion injury in the kidney microvasculature by stimulating RANTES synthesis in VSMC. This signal appears to be initiated by Angiotensin II receptor type 2 (AT2R) activation. Despite the anti-inflammatory role attributed to AT2R activation, its role in renal pathology is well documented (33, 34). Only select cytokines are synthesized by VSMC (26), including RANTES, MCP-1, VEGF and IL-8. We found one such cytokine, Regulated And Normal T cell expressed and Secreted (RANTES), to be increased with AngII and more so in cells pretreated with RGS4 siRNA. RANTES is a chemokine found to play a central role in monocyte chemotaxis in the kidney (35) and the VSMC injury response (36). RANTES has also been identified as an output to AngII stimulation in VSMC (37). However, we are the first to describe the AngII input leading to RANTES secretion by VSMC, which can be manipulated by RGS4 expression. Treatment with AT2-specific inhibitor, PD123319, in distinction to losartan, confirmed that RANTES expression was dependent on AT2 receptor activation in isolated VSMC. RGS4 knock-down experiments showed that AT2 receptor signaling was modulated by RGS4. Wolf and colleagues previously identified a kidney-derived RANTES response to AngII but focused on expression in glomerular endothelial cells (35).
RGS4 animal reporter models and in vitro interrogation were suggestive of RGS4 function derived from the VSMC. To investigate these findings further we tested the function of a smooth muscle cell-specific RGS4 knockout under conditions of 10 minute unilateral ischemia (10UI). We used an in vivo assay for macrophage localization to show that blood flow alterations seen in dynamic MR were due to leukocyte adhesion in a non-vasoconstricted period of reperfusion. We took advantage of macrophage avidity for the monocrystalline iron oxide particle, MION-47. Iron oxide nanoparticles have been used to localize this cell type noninvasively using T2-weighted MRI in the development of macrophage-driven insulitis (31). Using this same technique we noninvasively showed an increase in macrophage density in the kidneys of conditional knockout animals 18 hours after 10 minute unilateral injury. This corresponded with elevated AngII tissue levels that did not induce vasoconstriction in isolated, perfused kidneys. Transgenic animals under the same 10UI conditions had a decrease in macrophage density compared to wild type animals and more so compared to conditional knockout animals.
We did not investigate thromboxane A2, prostaglandin E2, bradykinin, or norepinephrine activity; although these receptors incorporate the Gα subunit and have been implicated in the pathophysiology of IRI. Work by Snoeijs and colleagues described little evidence that thromboxane A2 receptor knockout animals are less susceptible to IRI (38). Prostaglandin E2 activity in respiratory epithelia appears to be moderated by RGS4 (39) however endogenous expression of RGS4 in respiratory tubular epithelial cells is inconsistent with the cell type identified by the rgs4 LacZ animal reporter model (40). Bradykinin is known to mitigate ischemia/reperfusion injury (41) however the bradykinin 2 receptor-dependent signaling does not appear to be modulated by RGS4 (42). Norepinephrine is generated during renal ischemic injury however RANTES induction and/or resultant macrophage chemotaxis have not been reported as effectors. Further, angiotensin II stimulation has been implicated in soluble guanylyl cyclase (sGC) inhibition and myosin light chain kinase (MLCK) activation with a common result of blood flow reduction. Such studies rely on the vasoconstrictive effect of angiotensin II while we have tried to show that angiotensin II can modulate blood flow independent of vessel diameter.
In our report, enhanced endogenous RGS4 expression was not durable after 12 hours of reperfusion. This left the renal vasculature exposed to cell signaling effects of ligands such as AngII. We demonstrated this expression pattern in β-gal-expressing animals and confirmed these findings with localization of monoclonal antibodies against RGS4 in wild type animals. Enhanced RGS4 expression in transgenic animals most likely offered the greatest protection during the first 12 hours of reperfusion. This coincides with the nascent stages of the inflammatory response. In contrast tissue in wild-type animals was exposed to prolonged GPCR signaling over the same time period. As a result, the wild type animal model and the genetically deficient RGS4 animals were both more susceptible to reperfusion injury than the transgenic overexpressor. Partial recovery was shown in conditional knockouts treated with an Angiotensin-II receptor type 2 antagonist. PPAR δ agonists have also been shown to up-regulate RGS4 expression and inhibit atherosclerotic plaque development (3). PPAR δ agonists may be protective in kidney reperfusion injury but have not yet been investigated in this model. Such targeted therapies are desirable to avoid the relative contraindication of Angiotensin-II receptor type 1 antagonists for the treatment of ischemia/reperfusion injury.
In conclusion GPCR signaling is modulated by RGS4 in two conditions of acute kidney injury: 1) early ischemia 2) extended reperfusion. During reperfusion injury RGS4 resists AngII receptor signaling in VSMCs thereby preventing the influx of macrophages triggered by cytokine release and cell damage (Figure 12). Our studies bring to focus both the receptor-ligand interaction and the cell type critical in the pathophysiology of nascent reperfusion injury.
Figure 12.
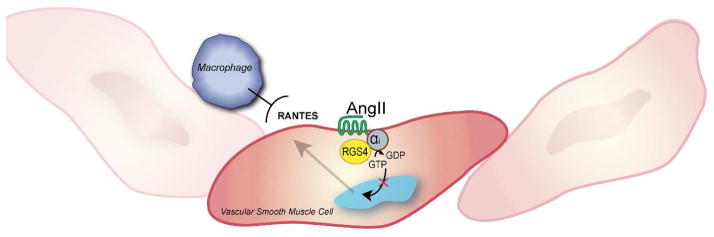
RGS4 function in kidney smooth muscle cells. During kidney reperfusion RGS4 dampens Angiotensin II-induced RANTES generation in vascular smooth muscle cells which is in turn responsible for macrophage localization and endothelial injury.
Supplementary Material
Acknowledgments
Sources of Funding: This work was supported by NIH grants R01 HL061567 (A.J.M.), P30 DK079333 (A.M.S. and A.J.M.), K08DK089002 (A.M.S), R37DK039773 (J.V.B.), RO1AI069259 (U.H.v.A.) and PO1AI078897 (U.H.v.A.), UAB/UCSD O’Brien Core Center for Acute Kidney Injury Research (NIH P30 DK 079337), and a Shared Instrumentation Grant S10 RR028792 at Beth Israel Deaconess Medical Center,
Methods (abbreviated)
- Serum creatinine and Urea measurements
Serum creatinine measurement was analyzed by HPLC at the University of Alabama in Birmingham core facility for Acute Kidney Injury Research as previously described (43). Urea Fluorometric Assay Kit (Cayman Chemical Co.) was used per the manufacturer’s recommendations
- Multiphoton Intra-vital microscopy
Animals underwent ischemia/reperfusion injury then were secured and interrogated on a multiphoton microscope platform (Bruker Corp.)
- Angiotensin II Immunoassay
Angiotensin II Immunoassay (Cayman Chemical Co.) was used to determine tissue angiotensin-II concentrations according to the manufacturer’s instructions
- Dynamic Magnetic Resonance Imaging
Data acquisition was processed using TopSpin 3.1 software (Bruker Biospin). All post-acquisition analysis was performed with Bayesian Analysis Software (Washington University in St. Louis)
- Flow Cytometry
Cells were collected and digested in collagenase in a 37°C water bath for 30 minutes and permeabilized for analysis on a BD Accuri C6 flow cytometer (BD Biosciences)
- Ex vivo kidney perfusion
Isolated kidneys were analyzed using a programmable peristaltic pump and in-line pressure monitor
- Human vascular smooth muscle cell culture
Cells were obtained (Sciencell, Inc.) and cultured in vascular smooth muscle cell (VSMC) media (Sciencell, Inc.)
- Pre-glomerular vascular smooth muscle cell culture
Kidney tissue was isolated following the technique of Dubey and colleagues (27)
- CCL5/RANTES Immunoassay
ELISA-based assay kit (R&D Systems) was used following the manufacturer’s specifications
- Magnetic microsphere-assisted Cytokine Immunoassay
Adult vascular smooth muscle cells (Sciencell) were processed. Multi-analyte microsphere-based fluorometric assay was performed using Luminex technology (Luminex Inc.) under the manufacturer’s specifications
- SMMHC-Cre x RGS4 flox design
The gene targeting vector included a neomycin resistance cassette to select for screened embryonic stem cells incorporating the target sequence. RGS4 flox were then crossed with SMMHC-Cre expressing animals for 10 generations
- In vivo imaging of monocrystalline nanoparticles
T2 signal decay patterns were generated using Rapid Acquisition with Relaxation Enhancement with variable repetition time [RAREVTR] protocol
Footnotes
Statistical techniques:
Sigmastat v3.1 (Systat Software, Inc.) software was used to calculate all statistics. Experimental conditions were evaluated for significance using analysis of variance (ANOVA) for pair-wise comparison among multiple groups using the Holm–Sidak method for multiple comparisons. Student’s T-test was used to evaluate for significance between two groups. One-way ANOVA calculations were used for all comparisons unless otherwise stated in the text. Log-rank testing (Mantel-Cox) was used to compare survival between two groups. All values represent a condition’s mean value ± standard deviation.
Disclosure:
The authors have no relationships with companies that may have a financial interest in the information contained in the manuscript.
References
- 1.Gurley SB, Griffiths RC, Mendelsohn ME, Karas RH, Coffman TM. Renal actions of RGS2 control blood pressure. Journal of the American Society of Nephrology: JASN. 2010;21(11):1847–1851. doi: 10.1681/ASN.2009121306. [DOI] [PMC free article] [PubMed] [Google Scholar]
- 2.Siedlecki AM, Jin X, Thomas W, Hruska KA, Muslin AJ. RGS4, a GTPase activator, improves renal function in ischemia-reperfusion injury. Kidney international. 2011;80(3):263–271. doi: 10.1038/ki.2011.63. [DOI] [PMC free article] [PubMed] [Google Scholar]
- 3.Takata Y, Liu J, Yin F, Collins AR, Lyon CJ, Lee CH, Atkins AR, Downes M, Barish GD, Evans RM, Hsueh WA, Tangirala RK. PPARdelta-mediated antiinflammatory mechanisms inhibit angiotensin II-accelerated atherosclerosis. Proceedings of the National Academy of Sciences of the United States of America. 2008;105(11):4277–4282. doi: 10.1073/pnas.0708647105. [DOI] [PMC free article] [PubMed] [Google Scholar]
- 4.Barish GD, Atkins AR, Downes M, Olson P, Chong LW, Nelson M, Zou Y, Hwang H, Kang H, Curtiss L, Evans RM, Lee CH. PPARdelta regulates multiple proinflammatory pathways to suppress atherosclerosis. Proceedings of the National Academy of Sciences of the United States of America. 2008;105(11):4271–4276. doi: 10.1073/pnas.0711875105. [DOI] [PMC free article] [PubMed] [Google Scholar]
- 5.Harris IS, Treskov I, Rowley MW, Heximer S, Kaltenbronn K, Finck BN, Gross RW, Kelly DP, Blumer KJ, Muslin AJ. G-protein signaling participates in the development of diabetic cardiomyopathy. Diabetes. 2004;53(12):3082–3090. doi: 10.2337/diabetes.53.12.3082. [DOI] [PubMed] [Google Scholar]
- 6.Heximer SP, Blumer KJ. RGS proteins: Swiss army knives in seven-transmembrane domain receptor signaling networks. Science’s STKE: signal transduction knowledge environment. 2007;2007(370):pe2. doi: 10.1126/stke.3702007pe2. [DOI] [PubMed] [Google Scholar]
- 7.Cifelli C, Rose RA, Zhang H, Voigtlaender-Bolz J, Bolz SS, Backx PH, Heximer SP. RGS4 regulates parasympathetic signaling and heart rate control in the sinoatrial node. Circulation research. 2008;103(5):527–535. doi: 10.1161/CIRCRESAHA.108.180984. [DOI] [PubMed] [Google Scholar]
- 8.Zarzuelo MJ, Jimenez R, Galindo P, Sanchez M, Nieto A, Romero M, Quintela AM, Lopez-Sepulveda R, Gomez-Guzman M, Bailon E, Rodriguez-Gomez I, Zarzuelo A, Galvez J, Tamargo J, Perez-Vizcaino F, Duarte J. Antihypertensive effects of peroxisome proliferator-activated receptor-beta activation in spontaneously hypertensive rats. Hypertension. 2011;58(4):733–743. doi: 10.1161/HYPERTENSIONAHA.111.174490. [DOI] [PubMed] [Google Scholar]
- 9.Kleemann P, Papa D, Vigil-Cruz S, Seifert R. Functional reconstitution of the human chemokine receptor CXCR4 with G(i)/G (o)-proteins in Sf9 insect cells. Naunyn-Schmiedeberg’s archives of pharmacology. 2008;378(3):261–274. doi: 10.1007/s00210-008-0313-8. [DOI] [PMC free article] [PubMed] [Google Scholar]
- 10.Tamirisa P, Blumer KJ, Muslin AJ. RGS4 inhibits G-protein signaling in cardiomyocytes. Circulation. 1999;99(3):441–447. doi: 10.1161/01.cir.99.3.441. [DOI] [PubMed] [Google Scholar]
- 11.Sprague AH, Khalil RA. Inflammatory cytokines in vascular dysfunction and vascular disease. Biochemical pharmacology. 2009;78(6):539–552. doi: 10.1016/j.bcp.2009.04.029. [DOI] [PMC free article] [PubMed] [Google Scholar]
- 12.Chen J, Chen JK, Nagai K, Plieth D, Tan M, Lee TC, Threadgill DW, Neilson EG, Harris RC. EGFR signaling promotes TGFbeta-dependent renal fibrosis. Journal of the American Society of Nephrology: JASN. 2012;23(2):215–224. doi: 10.1681/ASN.2011070645. [DOI] [PMC free article] [PubMed] [Google Scholar]
- 13.Adams GN, LaRusch GA, Stavrou E, Zhou Y, Nieman MT, Jacobs GH, Cui Y, Lu Y, Jain MK, Mahdi F, Shariat-Madar Z, Okada Y, D’Alecy LG, Schmaier AH. Murine prolylcarboxypeptidase depletion induces vascular dysfunction with hypertension and faster arterial thrombosis. Blood. 2011;117(14):3929–3937. doi: 10.1182/blood-2010-11-318527. [DOI] [PMC free article] [PubMed] [Google Scholar]
- 14.Alvarez A, Cerda-Nicolas M, Naim Abu Nabah Y, Mata M, Issekutz AC, Panes J, Lobb RR, Sanz MJ. Direct evidence of leukocyte adhesion in arterioles by angiotensin II. Blood. 2004;104(2):402–408. doi: 10.1182/blood-2003-08-2974. [DOI] [PubMed] [Google Scholar]
- 15.Zhou Z, Hu CP, Wang CJ, Li TT, Peng J, Li YJ. Calcitonin gene-related peptide inhibits angiotensin II-induced endothelial progenitor cells senescence through up-regulation of klotho expression. Atherosclerosis. 2010;213(1):92–101. doi: 10.1016/j.atherosclerosis.2010.08.050. [DOI] [PubMed] [Google Scholar]
- 16.Bonventre JV, Yang L. Cellular pathophysiology of ischemic acute kidney injury. The Journal of clinical investigation. 2011;121(11):4210–4221. doi: 10.1172/JCI45161. [DOI] [PMC free article] [PubMed] [Google Scholar]
- 17.Wilhelm SM, Simonson MS, Robinson AV, Stowe NT, Schulak JA. Endothelin up-regulation and localization following renal ischemia and reperfusion. Kidney international. 1999;55(3):1011–1018. doi: 10.1046/j.1523-1755.1999.0550031011.x. [DOI] [PubMed] [Google Scholar]
- 18.Arendshorst WJ, Brannstrom K, Ruan X. Actions of angiotensin II on the renal microvasculature. Journal of the American Society of Nephrology: JASN. 1999;10 (Suppl 11):S149–161. [PubMed] [Google Scholar]
- 19.Gulmen S, Kiris I, Narin C, Ceylan BG, Mermi B, Sutcu R, Meteoglu I. Tezosentan reduces the renal injury induced by abdominal aortic ischemia-reperfusion in rats. The Journal of surgical research. 2009;157(1):e7–e13. doi: 10.1016/j.jss.2008.08.011. [DOI] [PubMed] [Google Scholar]
- 20.Danilov SM, Sadovnikova E, Scharenborg N, Balyasnikova IV, Svinareva DA, Semikina EL, Parovichnikova EN, Savchenko VG, Adema GJ. Angiotensin-converting enzyme (CD143) is abundantly expressed by dendritic cells and discriminates human monocyte-derived dendritic cells from acute myeloid leukemia-derived dendritic cells. Experimental hematology. 2003;31(12):1301–1309. doi: 10.1016/j.exphem.2003.08.018. [DOI] [PubMed] [Google Scholar]
- 21.Komine N, Khang S, Wead LM, Blantz RC, Gabbai FB. Effect of combining an ACE inhibitor and an angiotensin II receptor blocker on plasma and kidney tissue angiotensin II levels. American journal of kidney diseases: the official journal of the National Kidney Foundation. 2002;39(1):159–164. doi: 10.1053/ajkd.2002.29909. [DOI] [PubMed] [Google Scholar]
- 22.Ding J, Guzman JN, Tkatch T, Chen S, Goldberg JA, Ebert PJ, Levitt P, Wilson CJ, Hamm HE, Surmeier DJ. RGS4-dependent attenuation of M4 autoreceptor function in striatal cholinergic interneurons following dopamine depletion. Nature neuroscience. 2006;9(6):832–842. doi: 10.1038/nn1700. [DOI] [PubMed] [Google Scholar]
- 23.Winden KD, Oldham MC, Mirnics K, Ebert PJ, Swan CH, Levitt P, Rubenstein JL, Horvath S, Geschwind DH. The organization of the transcriptional network in specific neuronal classes. Molecular systems biology. 2009;5:291. doi: 10.1038/msb.2009.46. [DOI] [PMC free article] [PubMed] [Google Scholar]
- 24.Siedlecki A, Anderson JR, Jin X, Garbow JR, Lupu TS, Muslin AJ. RGS4 controls renal blood flow and inhibits cyclosporine-mediated nephrotoxicity. American journal of transplantation: official journal of the American Society of Transplantation and the American Society of Transplant Surgeons. 2010;10(2):231–241. doi: 10.1111/j.1600-6143.2009.02930.x. [DOI] [PMC free article] [PubMed] [Google Scholar]
- 25.Lee JJ, Bretthorst GL, Derdeyn CP, Powers WJ, Videen TO, Snyder AZ, Markham J, Shimony JS. Dynamic susceptibility contrast MRI with localized arterial input functions. Magnetic resonance in medicine: official journal of the Society of Magnetic Resonance in Medicine/Society of Magnetic Resonance in Medicine. 2010;63(5):1305–1314. doi: 10.1002/mrm.22338. [DOI] [PMC free article] [PubMed] [Google Scholar]
- 26.Jordan NJ, Watson ML, Williams RJ, Roach AG, Yoshimura T, Westwick J. Chemokine production by human vascular smooth muscle cells: modulation by IL-13. British journal of pharmacology. 1997;122(4):749–757. doi: 10.1038/sj.bjp.0701433. [DOI] [PMC free article] [PubMed] [Google Scholar]
- 27.Dubey RK, Roy A, Overbeck HW. Culture of renal arteriolar smooth muscle cells. Mitogenic responses to angiotensin II Circulation research. 1992;71(5):1143–1152. doi: 10.1161/01.res.71.5.1143. [DOI] [PubMed] [Google Scholar]
- 28.Wirth A, Benyo Z, Lukasova M, Leutgeb B, Wettschureck N, Gorbey S, Orsy P, Horvath B, Maser-Gluth C, Greiner E, Lemmer B, Schutz G, Gutkind JS, Offermanns S. G12-G13-LARG-mediated signaling in vascular smooth muscle is required for salt-induced hypertension. Nature medicine. 2008;14(1):64–68. doi: 10.1038/nm1666. [DOI] [PubMed] [Google Scholar]
- 29.Basile DP, Leonard EC, Beal AG, Schleuter D, Friedrich J. Persistent oxidative stress following renal ischemia-reperfusion injury increases ANG II hemodynamic and fibrotic activity. American journal of physiology Renal physiology. 2012;302(11):F1494–1502. doi: 10.1152/ajprenal.00691.2011. [DOI] [PMC free article] [PubMed] [Google Scholar]
- 30.Rovner AS, Murphy RA, Owens GK. Expression of smooth muscle and nonmuscle myosin heavy chains in cultured vascular smooth muscle cells. The Journal of biological chemistry. 1986;261(31):14740–14745. [PubMed] [Google Scholar]
- 31.Fu W, Wojtkiewicz G, Weissleder R, Benoist C, Mathis D. Early window of diabetes determinism in NOD mice, dependent on the complement receptor CRIg, identified by noninvasive imaging. Nature immunology. 2012;13(4):361–368. doi: 10.1038/ni.2233. [DOI] [PMC free article] [PubMed] [Google Scholar]
- 32.Piqueras L, Kubes P, Alvarez A, O’Connor E, Issekutz AC, Esplugues JV, Sanz MJ. Angiotensin II induces leukocyte-endothelial cell interactions in vivo via AT(1) and AT(2) receptor-mediated P-selectin upregulation. Circulation. 2000;102(17):2118–2123. doi: 10.1161/01.cir.102.17.2118. [DOI] [PubMed] [Google Scholar]
- 33.Esteban V, Lorenzo O, Ruperez M, Suzuki Y, Mezzano S, Blanco J, Kretzler M, Sugaya T, Egido J, Ruiz-Ortega M. Angiotensin II, via AT1 and AT2 receptors and NF-kappaB pathway, regulates the inflammatory response in unilateral ureteral obstruction. Journal of the American Society of Nephrology: JASN. 2004;15(6):1514–1529. doi: 10.1097/01.asn.0000130564.75008.f5. [DOI] [PubMed] [Google Scholar]
- 34.Wolf G, Wenzel U, Burns KD, Harris RC, Stahl RA, Thaiss F. Angiotensin II activates nuclear transcription factor-kappaB through AT1 and AT2 receptors. Kidney international. 2002;61(6):1986–1995. doi: 10.1046/j.1523-1755.2002.00365.x. [DOI] [PubMed] [Google Scholar]
- 35.Wolf G, Ziyadeh FN, Thaiss F, Tomaszewski J, Caron RJ, Wenzel U, Zahner G, Helmchen U, Stahl RA. Angiotensin II stimulates expression of the chemokine RANTES in rat glomerular endothelial cells. Role of the angiotensin type 2 receptor The Journal of clinical investigation. 1997;100(5):1047–1058. doi: 10.1172/JCI119615. [DOI] [PMC free article] [PubMed] [Google Scholar]
- 36.Ullevig S, Zhao Q, Lee CF, Seok Kim H, Zamora D, Asmis R. NADPH oxidase 4 mediates monocyte priming and accelerated chemotaxis induced by metabolic stress. Arteriosclerosis, thrombosis, and vascular biology. 2012;32(2):415–426. doi: 10.1161/ATVBAHA.111.238899. [DOI] [PMC free article] [PubMed] [Google Scholar]
- 37.Guzik TJ, Hoch NE, Brown KA, McCann LA, Rahman A, Dikalov S, Goronzy J, Weyand C, Harrison DG. Role of the T cell in the genesis of angiotensin II induced hypertension and vascular dysfunction. The Journal of experimental medicine. 2007;204(10):2449–2460. doi: 10.1084/jem.20070657. [DOI] [PMC free article] [PubMed] [Google Scholar]
- 38.Snoeijs MG, Hoogland PR, Boonen B, Coffman TM, Peutz-Kootstra CJ, Buurman WA, van Heurn LW. Thromboxane receptor signalling in renal ischemia reperfusion injury. Free radical research. 2011;45(6):699–706. doi: 10.3109/10715762.2011.571686. [DOI] [PubMed] [Google Scholar]
- 39.Song KS, Choi YH, Kim JM, Lee H, Lee TJ, Yoon JH. Suppression of prostaglandin E2-induced MUC5AC overproduction by RGS4 in the airway. American journal of physiology Lung cellular and molecular physiology. 2009;296(4):L684–692. doi: 10.1152/ajplung.90396.2008. [DOI] [PubMed] [Google Scholar]
- 40.Eppig JT, Blake JA, Bult CJ, Kadin JA, Richardson JE. The Mouse Genome Database (MGD): comprehensive resource for genetics and genomics of the laboratory mouse. Nucleic acids research. 2012;40(Database issue):D881–886. doi: 10.1093/nar/gkr974. [DOI] [PMC free article] [PubMed] [Google Scholar]
- 41.Kakoki M, McGarrah RW, Kim HS, Smithies O. Bradykinin B1 and B2 receptors both have protective roles in renal ischemia/reperfusion injury. Proceedings of the National Academy of Sciences of the United States of America. 2007;104(18):7576–7581. doi: 10.1073/pnas.0701617104. [DOI] [PMC free article] [PubMed] [Google Scholar]
- 42.Wang Q, Traynor JR. Opioid-induced down-regulation of RGS4: role of ubiquitination and implications for receptor cross-talk. The Journal of biological chemistry. 2011;286(10):7854–7864. doi: 10.1074/jbc.M110.160911. [DOI] [PMC free article] [PubMed] [Google Scholar]
- 43.Young S, Struys E, Wood T. Quantification of creatine and guanidinoacetate using GC-MS and LC-MS/MS for the detection of cerebral creatine deficiency syndromes. In: Haines Jonathan L, et al., editors. Current protocols in human genetics/editorial board. Unit 17. Chapter 17. 2007. p. 13. [DOI] [PubMed] [Google Scholar]
Associated Data
This section collects any data citations, data availability statements, or supplementary materials included in this article.