Abstract
Background/Objectives
The zeta-1 family isoform of GST biotransforms the investigational drug dichloroacetate (DCA) and certain other halogenated carboxylic acids. Haplotype variability in GSTZ1 influences the kinetics and, possibly, the toxicity of DCA. DCA metabolism correlates with expression of the GSTZ1 protein, so it is important to document variables that affect expression. Following up a limited previous study, we tested the hypothesis that a coding SNP, the lysine (K) amino acid (E32>K) in GSTZ1 haplotypes linked to a promoter region SNP results in lower hepatic expression of GSTZ1.
Methods
The influence of K carrier and non-K carrier haplotypes on GSTZ1 expression was determined by analyzing 78 liver samples from subjects aged 7 to 84 years of various racial and ethnic backgrounds. GSTZ1 expression data were analyzed based on the presence or absence of lysine 32.
Results
GSTZ1 protein expression differed significantly between K carrier and non-K carrier haplotypes (p=0.001) in Caucasians, but not in African-Americans (p=0.277). We attribute this difference in GSTZ1 expression among K carrier haplotypes in Caucasians to the linkage disequilibrium (LD) between the K or A allele from the G>A SNP (rs7975), with the promoter G>A -1002 SNP (rs7160195) A allele. There is no LD between these two polymorphisms in African-Americans.
Conclusions
We conclude that the lower expression of GSTZ1 in Caucasians who possess the K carrier haplotype results in lower enzymatic activity and slower metabolism of DCA, compared to those who possess the non-K carrier haplotype. These results further define safe, genetics-based dosing regimens for chronic DCA administration.
Keywords: GSTZ1, Dichloroacetate (DCA), haplotype, Pharmacogenetic, linkage disequilibrium (LD)
Introduction
DCA is an investigational drug currently used to treat disorders of mitochondrial energetics, including congenital lactic acidosis [1] and is also a promising anti-cancer drug [2]. The drug is a prototypic inhibitor of mitochondrial pyruvate dehydrogenase kinase (PDK), which inactivates the pyruvate dehydrogenase complex (PDC) by reversible phosphorylation. PDC irreversibly decarboxylates pyruvate to acetyl CoA, thereby linking cytoplasmic glycolysis to the mitochondrial tricarboxylic acid cycle [3]. By stimulating PDC activity, DCA reduces cellular lactate formation and increases oxidative phosphorylation.
The only enzyme known to biotransform DCA is the zeta-1 family isoform of GST (GSTZ1); therefore, GSTZ1 activity towards DCA determines the pharmacokinetics of the drug. GSTZ1 also functions as maleylacetoacetate isomerase (MAAI), which catalyzes the penultimate step in tyrosine metabolism. During biotransformation of DCA, some of the GSTZ1 enzyme is inactivated following adduct formation in a dose-dependent manner [4, 5, 6].
In humans, 3 SNPs, rs7975 (E32K), rs7972 (G42R) and rs1046428 (T82M) give rise to five frequent GSTZ1 haplotypes, named here as EGT, KGT, EGM, KRT and KGM. EGT is the most frequent haplotype (~50%), followed by KGT (~30%), EGM (~15%), KRT (~5%) and KGM (0.4%). The influence of GSTZ1 haplotypes on DCA kinetics was examined in healthy adult subjects [7]. Carriers of at least one EGT allele generally showed faster DCA plasma clearance upon repeated doses and less build-up of the tyrosine catabolite maleylacetone, compared to individuals not carrying this haplotype [7-8].
Several factors may influence DCA clearance following repeated doses, including basal expression of GSTZ1, which may influence the steady state of GSTZ1 protein synthesis in the presence of continued exposure to DCA. SNPs in the promoter region of the GSTZ1 gene can affect its transcription [9]. In particular, SNPs -1002G>A and -289C>T regulated transcription of GSTZ1 in HepG2 cells. The A allele of -1002 SNP was shown to have a lower transcription level of GSTZ1 [9]. Our recent study of the ontogeny of GSTZ1 in human liver showed that individuals over the age of seven years had broadly similar GSTZ1 activity and expression [10]. Although there was considerable inter-individual variability in both parameters, expression correlated well with activity [10]. Samples from Li et al., 2012 study and additional human liver samples were used to test the hypothesis that the A allele of SNP G94>A (rs7975) which codes for a lysine (K) amino acid in the KGT, KRT and KGM haplotypes, that is linked to the A allele of the -1002 SNP and results in reduced expression of GSTZ1 protein, compared to samples with the G allele of SNP G94>A (rs7975) which results in glutamic acid (E) at position 32 of the protein.
Materials and Methods
Human liver samples
A total of 78 liver samples were obtained from banks of human livers obtained under an “exempt” protocol approved by the University of Florida Institutional Review Board. The data regarding age, ethnicity and gender for the liver samples are shown in supplemental table. DNA and cytosol were prepared from liver samples by standard methods [10].
GSTZ1 SNP Genotyping
DNA was isolated from liver tissue samples using QiaGen Tissue kit (QiaGen, MD, USA). Hepatic DNA was subjected to PCR followed by pyrosequencing [11], targeting the 3 known GSTZ1 non-synonymous SNPs, G94>A, Glu→Lys at amino acid position 32; G124>A, Gly→Arg at position 42; and C245>T, Thr→Met at position 82, and the promoter SNP: -1002 G>A (promoter region). Genotyping analysis was carried out using a PSQ HS 96 System (QiaGen, MD, USA). Haplotypes were inferred from the unphased data by computational methods (PHASE software version 2.0.2) [12].
GSTZ1 haplotype blocks
To define GSTZ1 haplotype blocks in different racial and ethnic groups, the genotype data for rs7160195 (-1002), rs7975 (E32K), rs7972 (G42R), and rs1046428 (T82M) was downloaded in the European and African, population groups from the 1,000 Genomes Project [13]. Pairwise linkage disequilibrium (LD) values for D’ and r2 were calculated and visualized using Haploview [14]. Haplotype blocks were defined using the Gabriel et al confidence interval method [15].
GSTZ1 activity with DCA
Conversion of 14C-DCA to 14C-glyoxylate, catalyzed by GSTZ1 in the presence of glutathione, was determined in liver cytosol samples under linear conditions of product formation as described previously [10]. The 14C-DCA was purchased from American Radiolabeled Chemicals, St. Louis, MO and the glutathione from Sigma-Aldrich, St. Louis, MO. Saturating concentrations of DCA (0.2 mM) and glutathione (1 mM) were used to ensure maximal rates of biotransformation.
GSTZ1 protein expression
To quantify GSTZ1 expression in human liver cytosol, samples were subjected to Western blotting using a rabbit antihuman GSTZ1 polyclonal primary antibody exactly as described by Li et al., 2012. A standard curve constructed with expressed, purified hGSTZ1C protein was used to calculate the GSTZ1 content of samples as ng GSTZ1 per μg cytosolic protein, and the gel to gel variability was controlled by loading 5 μg of a single sample of human liver cytosol on each gel as an internal standard[10].
GSTZ1 mRNA expression
Forty-eight of the original 78 samples that had enough tissue were used for total RNA isolation. Total RNA was isolated using RNeasy Mini Kit (QiaGen, MD, USA), and converted to cDNA using the High Capacity cDNA Reverse Transcription Kits (Applied Biosystems®, Life Technologies, CA, USA). GSTZ1 gene expression level was measured by Taqman Gene Expression Assays (TaqMan gene expression probes; Hs99999901_s1 for 18S, and Hs01041668_m1 for GSTZ1) on a Taqman 7900 Real Time PCR system (Applied Biosystems®, Life Technologies, Carlsbad, CA, USA). GSTZ1 gene expression levels were normalized to the reference gene 18S (ribosomal RNA). The 2−ΔCt method was used to assess relative gene expression differences between samples carrying different GSTZ1 haplotypes [16]. Samples were grouped as those who carried at least one copy of the K allele, and those who carried no copies of the K allele.
GSTZ1 Allele-specific mRNA quantification
Pyrosequencing can be used to quantify the expression of each allele of the mRNA transcript of a SNP. To determine whether the variant K carrier status results in changes at the transcriptional level, we quantified allele-specific mRNA transcripts from liver samples using pyrosequencing-based methodology [17-18]. The presence or absence of allelic expression imbalance was determined in a subset of RNA samples (n=24) that were heterozygous for both GSTZ1 promoter SNP (-1002 G>A) and coding SNP G94>A, E32K, polymorphisms.
Data analysis
The departure from Hardy Weinberg equilibrium (HWE) was tested for each SNP in each racial or ethnic group using chi-squared test with one degree of freedom. The T-test with Graph-Pad software (Prism v6.0), and the Mann Whitney U test were used to analyze GSTZ1 protein expression. The non-parametric Kruskal Wallis statistical test was used to compare the differences in GSTZ1 expression between the following diplotypes: EGT/EGT, EGT/EGM, EGT/KGT, KGT/KGT, KRT/EGM and KRT/EGT. Post hoc analysis using Dunn's test was performed to identify the GSTZ1 diplotypes associated with GSTZ1 expression levels that were statistically significantly different from the other diploptypes. Relative expression levels of GSTZ1 mRNA were compared between the haplotype groups using the Wilcoxon rank sum test. For the proportion of the major allele in DNA and cDNA in allelic expression imbalance analysis, P-values were calculated using Wilcoxon Signed Ranks Test. For all analyses, a p<0.05 was considered significant.
Results
GSTZ1 activity with DCA in Caucasian donors
Liver cytosol from donors that did not contain a lysine (K) in GSTZ1 at position 32 had mean activity of 0.63 ± 0.36 nmol glyxoylate/min/mg protein (Mean ± S.D., n=22). Samples that had at least one KGT or KGM haplotype had mean activity of 0.27 ± 0.10 (n=13), significantly lower that non-K-containing samples, p<0.002. Samples that expressed KRT haplotype were excluded from the K-containing group, as previous studies had shown that this haplotype was associated with high activity [10]. Consistent with this previous work, we found that the 7 liver samples expressing KRT haplotype had activity of 0.94 ± 0.31, significantly higher than those that did not express KRT.
GSTZ1 protein expression
We observed high variability in GSTZ1 protein expression among individuals. The expression of hepatic cytosolic GSTZ1 in K-carriers was lower than in non K-carriers for liver samples from all the donors (Figure 1A), as well as from the sub-set of Caucasian donors (Figure 1B). In African-American donors, the expression levels were not different when sorted by the presence or absence of lysine at position 32 (Figure 1C). In other words, the presence of lysine at position 32, coded by A at SNP G94>A (rs7975), resulted in lower expression of GSTZ1 protein compared to glutamic acid, coded by G at SNP G94>A (rs7975), unless the donor was African-American. The lower protein expression in K-carriers of non-African Americans was probably due to the presence of A at the promoter region SNP (-1002) rs7160195, which showed LD with SNP rs7975 (E32K) in these non-African populations (Figure 1). The expression of the hepatic cytosolic GSTZ1 protein expression was also analyzed among different diplotypes from all the samples. Diplotypes; EGT/EGT, EGT/EGM, EGT/KGT, KGT/KGT, KRT/EGM and KRT/EGT were analyzed and the results are shown in Figure 2. GSTZ1 protein expression differed significantly between EGT/EGT and KGT/KGT, EGT/EGT and KRT/EGM, EGT/EGM and KGT/KGT (Figure 2).
Figure 1.
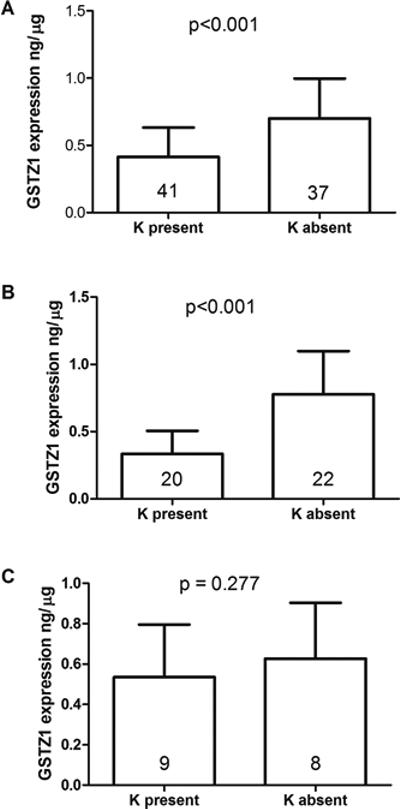
Expression of cytosolic GSTZ1 protein in human liver; (A) All samples (n=78), (B) Caucasians (n=42), (C) African-American (n=17)
Figure 2.
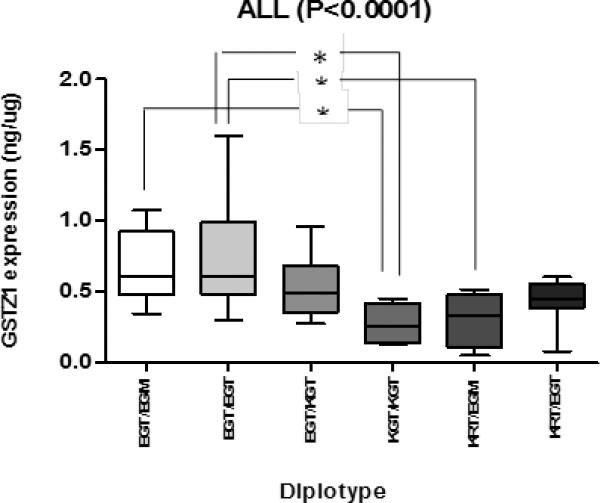
Box plot showing the expression level of GSTZ1 normalized to cytosolic protein for each diplotype. The lower and upper box borders represent the 25th and the 75th percentile respectively. The middle line in the box represents the median. The lower and upper whiskers represent the minimum and the maximum respectively. * indicates P-value < 0.05, using Dunn's post-hoc test.
GSTZ1 mRNA expression analysis
GSTZ1 mRNA expression levels were measured in liver samples and were very low compared with the reference, 18S RNA. The A allele of SNP G94>A rs7975 did not significantly influence GSTZ1 mRNA expression in the group as a whole (Figure 3A) or in the individuals from Caucasion (Figure 3B) or African-American (Figure 3C) populations. Expression levels were highly variable among Caucasian and African American samples.
Figure 3.
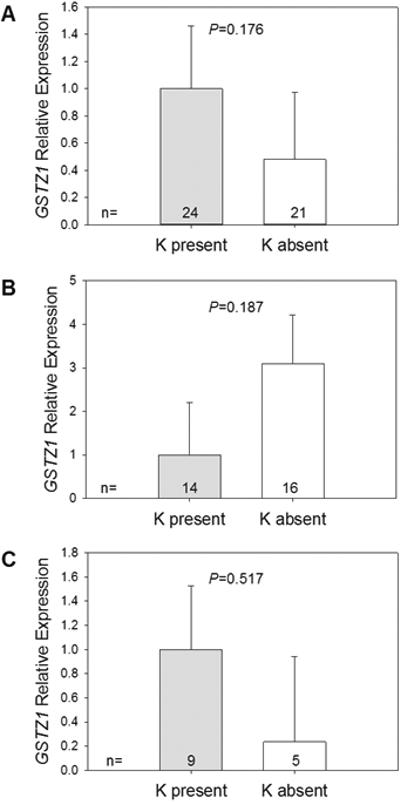
Relative GSTZ1 mRNA expression levels in (A) all samples (n=45), (B) Caucasians (n=30), (C) African-Americans (n=14). Expression levels were normalized to 18S ribosomal RNA.
GSTZ1 Allele-specific mRNA quantification
Figure 4 shows the results of GSTZ1 allele-specific mRNA quantification (allelic expression imbalance) from all samples (n=24), Caucasians (n=13), and African-Americans (n=9). There were no statistically significant differences in allele-specific expression between cDNA and DNA from liver samples that were heterozygous for both GSTZ1 promoter SNP (-1002 G>A) and coding SNP G94>A, E32K.
Figure 4.
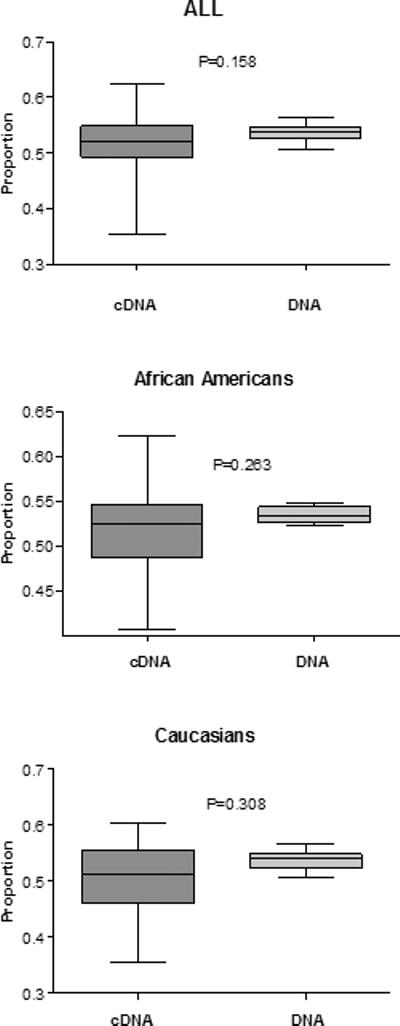
GSTZ1 allele-specific mRNA quantification (allelic expression imbalance); (A) All samples (n=24), (B) Caucaisans (n=13), (C) African-Americans (n=9), the proportion of the major allele in DNA and cDNA. The horizontal line within the box represents the median value; the limits of the box represent the 25th and 75th percentiles. The whiskers represent the minimum and maximum. P-values were calculated using Wilcoxon Signed Ranks Test.
GSTZ1 haplotypes and haplotype blocks
All the genotypes were in Hardy Weinberg equilibrium. Haplotypes for the 3 nonsynonymous SNPs in GSTZ1 (E32K, G42R, and T82M), were inferred from the unphased data by computational methods (PHASE software version 2.0.2). For LD analysis the pairwise LD was assessed between the GSTZ1 promoter SNP (-1002) and the 3 nonsynonymous SNPs in GSTZ1 (E32K, G42R, and T82M), in individuals of European ancestry and African ancestry from 1,000 Genomes (Figure 5). In individuals with European ancestry, the promoter SNP (-1002) was in high LD with E32K (r2=0.89) (Figure 4A). However, in individuals with African ancestry, the promoter SNP (-1002) was in low LD with E32K (r2=0.25) (Figure 4B).
Figure 5.
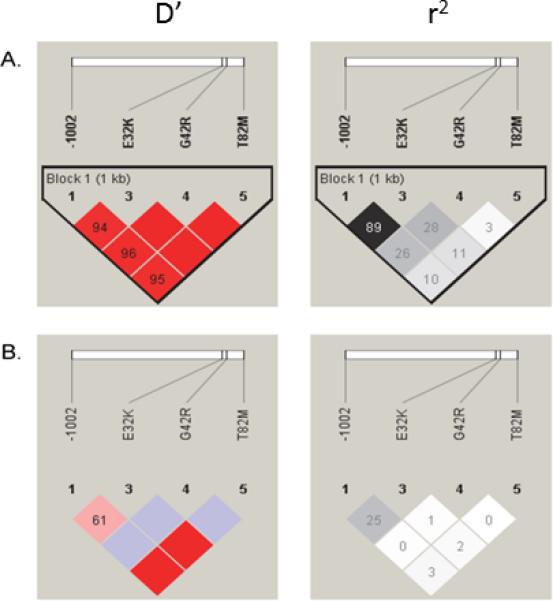
LD plot showing D’ (red color scale) and r2 (black and white color scale) values for, (A) Caucasians population, and (B) African population
GSTZ1 diplotypes frequency
The frequencies of different GSTZ1 diplotype for all the samples were determined and are shown in Figure 6. The EGT/EGT diplotype was the most common (34.30%) followed by EGT/KGT (25.70%), EGT/EGM (15.70%), KRT/EGT (10%), KGT/KGT (8.60%), and KRT/EGM (5.70%).
Figure 6.
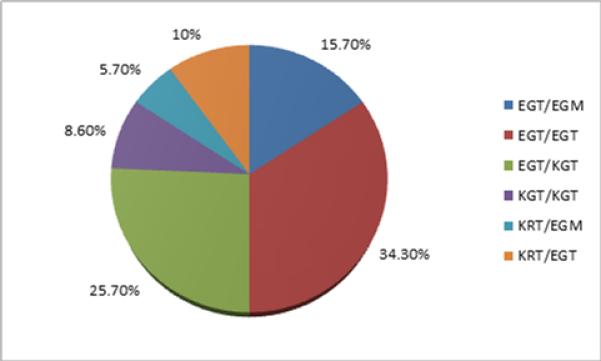
The frequencies of different GSTZ1 diplotypes in all samples.
Discussion
Hepatic GSTZ1 biotransforms DCA and certain other halogenated short chain carboxylic acids [19]. We have already shown the influence of GSTZ1 haplotypes on the pharmacokinetics of DCA in healthy subjects treated with DCA for 5 days [7], in children treated chronically with DCA [1,8] and adult patients [20]. In this study we sought to determine whether the presence of SNP 94G>A, coding for the lysine amino acid (K) in the KGT, KRT, and KGM haplotypes, reduces the expression of GSTZ1 in human liver, because it is linked with the promoter region SNP-1002G>A.
Examination of the GSTZ1 gene in humans, data from the 1000 Genomes Project, revealed linkage disequilibrium between the A allele from the G>A SNP (rs7975) with the promoter G>A -1002 SNP (rs7160195) A allele in Caucasians, Asians and Hispanics but not Africans. Additionally, we found significant differences in the expression of hepatic cytosolic GSTZ1 protein between K carrier and non-K carrier GSTZ1 haplotype and diplotype groups in all samples, regardless of donor race or ethnicity. When the data were analyzed by race or ethnicity in haplotype groups based on K carrier and non-K carrier status, the difference remained significant for Caucasians but not for African-Americans. We attribute this difference in GSTZ1 expression among K carrier haplotypes in Caucasians to the linkage disequilibrium (LD) between the K-coding or A allele from the G>A SNP (rs7975) with the promoter G>A -1002 SNP (rs7160195) A allele. Fang et al. [9] showed that the GSTZ1 promoter SNP -1002 G>A (rs7160195), which converts a V-Myb site to a S8 homeodomain (PrX2) site, causes a significant change in GSTZ1 promoter activity in HepG2 cells [9]. The pairwise LD results from the 1,000 Genomes Project data in individuals of European ancestry showed that the GSTZ1 promoter SNP (-1002) was in high LD with E32K. However, in Africans, these two SNPs were in low LD.
These results suggest that the promoter SNP may be the true functional variant and may also explain why there is a difference in GSTZ1 expression in non-African-Americans, based on the presence or absence of the K allele at E32K, compared to African-Americans.
In our GSTZ1 mRNA expression analysis, we observed no significant difference between K carrier and non-K carrier GSTZ1 haplotype groups, although there was a trend to lower expression for K carrier haplotypes in Caucasians. The lack of difference in allelic expression imbalance between gDNA and cDNA was in accord with our mRNA expression analysis. The lack of a statistically significant difference in GSTZ1 mRNA expression between K carrier and non-K carrier GSTZ1 haplotype groups may be due to the small sample sizes, low mRNA expression relative to the reference, high variability in expression or lower mRNA stability of one allele versus the other, perhaps from the influence of as yet unidentified microRNAs or epigenetic factors. The difference between GSTZ1 protein and mRNA expression may be due to GSTZ1 protein stability, mRNA translation efficiency or half-life of one allele over the other. Distinguishing among these possible mechanisms requires further study.
The lower expression of GSTZ1 protein in Caucasian samples with KGT or KGM haplotype was associated with lower ability to convert DCA to glyoxylate, compared with samples of the EGT or EGM haplotypes. Examination of the ratio of activity:expression showed that KGT or KGM-containing samples exhibited a ratio of 0.95 ± 0.35 (mean ± S.D., n=13) and those containing EGT or EGM a ratio of 0.81 ± 0.29 (n=22): these values were not significantly different. This confirms that the low expression of GSTZ1 in livers of persons with the SNP rs7975 (E32K) genotype will result in lower initial activity with DCA. The samples that contained KRT also showed low expression of GSTZ1, but because this haplotype is associated with high initial activity with DCA, the ratio of activity to expression, 3.00 ± 1.22 (n=7), was significantly higher than the other groups, p<0.0001 by ANOVA.
We conclude that the lower expression of GSTZ1 in Caucasians, Hispanic and Asians who possess the K carrier haplotypes results in lower enzymatic activity and slower metabolism of DCA compared to those who possess the non-K carrier haplotypes. This knowledge should be beneficial in personalizing doses of DCA to prevent or mitigate adverse side-effects.
Supplementary Material
Acknowledgements
This work was made possible in part by grants from the US Public Health Service ES07355, GM081344 and GM099871 and a College of Pharmacy studentship awarded to Wenjun Li.
Footnotes
Conflict of Interest
There are no conflicts of interest declared.
References
- 1.Abdelmalak M, Lew A, Ramezani R, Shroads AL, Coats BS, Langaee T, Shankar MN, Neiberger RE, Subramony SH, Stacpoole PW. Long-term safety of dichloroacetate in congenital lactic acidosis. Mol Genet Metab. 2013;109(2):139–43. doi: 10.1016/j.ymgme.2013.03.019. 2013. [DOI] [PMC free article] [PubMed] [Google Scholar]
- 2.Kankotia S, Stacpoole PW. Dichloroacetate and Cancer: New Home for an Orphan Drug? BBA Reviews on Cancer. 2014 doi: 10.1016/j.bbcan.2014.08.005. (accepted for publication) [DOI] [PubMed] [Google Scholar]
- 3.Stacpoole PW, Kurtz TL, Han Z, Langaee T. Role of dichloroacetate in the treatment of genetic mitochondrial diseases. Adv Drug Deliv Rev. 2008;60(13-14):1478–87. doi: 10.1016/j.addr.2008.02.014. [DOI] [PMC free article] [PubMed] [Google Scholar]
- 4.Anderson WB, Board P,G, Gargano B, Anders MW. Inactivation of glutathione transferase zeta by dichloroacetic acid and other fluorine-lacking α-haloalkanoic acids. Chem. Res. Toxicol. 1999;12:1144–1149. doi: 10.1021/tx990085l. [DOI] [PubMed] [Google Scholar]
- 5.Cornett R, James MO, Henderson GN, Stacpoole PW. Inhibition of glutathione-S-transferase-zeta and tyrosine metabolism by dichloroacetate: a potential unifying mechanism for its altered biotransformation and toxicity. Biochem. Biophys. Res. Commun. 1999;262:752–756. doi: 10.1006/bbrc.1999.1287. [DOI] [PubMed] [Google Scholar]
- 6.Guo X, Dixit VS, Liu H-P, Shroads AL, Henderson GN, James MO, Stacpoole PW. Inhibition and recovery of rat hepatic glutathione S-transferase zeta and alteration of tyrosine metabolism following dichloroacetate exposure and withdrawal. Drug Metabolism and Disposition. 2006;34:36–42. doi: 10.1124/dmd.105.003996. [DOI] [PubMed] [Google Scholar]
- 7.Shroads AL, Langaee T, Coats BS, Kurtz TL, Bullock JR, Weithorn D, Gong Y, Wagner DA, Ostrov DA, Johnson JA, Stacpoole PW. Human Polymorphisms in the Glutathione Transferase Zeta 1/Maleylacetoacetate Isomerase Gene Influence the Toxicokinetics of Dichloroacetate. J Clin Pharmacol. 2012;52(6):837–49. doi: 10.1177/0091270011405664. [DOI] [PMC free article] [PubMed] [Google Scholar]
- 8.Shroads AL, Coats BS, McDonough CW, Langaee T, Stacpoole PW. Haplotype variations in glutathione transferase zeta 1 influence the kinetics and dynamics of chronic dichloroacetate in children. J Clin Pharmacol. 2014 doi: 10.1002/jcph.371. [DOI] [PMC free article] [PubMed] [Google Scholar]
- 9.Fang Y-Y, Kashkarov U, Anders MW, Board PG. Polymorphisms in the human glutathione transferase zeta promoter. Pharmacogenetics and Genomics. 2006;16(5):307–313. doi: 10.1097/01.fpc.0000205000.07054.b3. [DOI] [PubMed] [Google Scholar]
- 10.Li W, Gu Y, James MO, Hines RN, Simpson P, Langaee T, Stacpoole PW. Prenatal and postnatal expression of glutathione transferase zeta 1 in human liver and the roles of haplotype and subject age in determining activity with dichloroacetate. Drug Metab. Disp. 2012;40:232–239. doi: 10.1124/dmd.111.041533. [DOI] [PMC free article] [PubMed] [Google Scholar]
- 11.Langaee T, Ronaghi M. Genetic variation analyses by Pyrosequencing. Mutat Res. 2005;573(1-2):96–102. doi: 10.1016/j.mrfmmm.2004.07.023. [DOI] [PubMed] [Google Scholar]
- 12.Stephens M, Smith NJ, Donnelly P. A new statistical method for haplotype reconstruction from population data. Am J Hum Genet. 2001;68(4):978–989. doi: 10.1086/319501. [DOI] [PMC free article] [PubMed] [Google Scholar]
- 13.Genomes Project Consortium (The 1000 Genomes Project Consortium), A map of human genome variation from population-scale sequencing. Nature. 2010;467(7319):1061–73. doi: 10.1038/nature09534. [DOI] [PMC free article] [PubMed] [Google Scholar]
- 14.Barrett JC, Fry B, Maller J, Daly MJ. Haploview: analysis and visualization of LD and haplotype maps. Bioinformatics. 2005;21(2):263–5. doi: 10.1093/bioinformatics/bth457. [DOI] [PubMed] [Google Scholar]
- 15.Gabriel SB, Schaffner SF, Nguyen H, Moore JM, Roy J, Blumenstiel B, et al. The structure of haplotype blocks in the human genome. Science. 2002;296(5576):2225–9. doi: 10.1126/science.1069424. [DOI] [PubMed] [Google Scholar]
- 16.Livak KJ, Schmittgen TD. Analysis of relative gene expression data using real-time quantitative PCR and the 2(-Delta Delta C(T)) Method. Methods. 2001;25(4):402–8. doi: 10.1006/meth.2001.1262. [DOI] [PubMed] [Google Scholar]
- 17.Sun A, Ge J, Siffert W, Frey UH. Quantification of allele-specific G-protein beta3 subunit mRNA transcripts in different human cells and tissues by Pyrosequencing. Eur J Hum Genet. 2005;13:361–369. doi: 10.1038/sj.ejhg.5201334. [DOI] [PubMed] [Google Scholar]
- 18.Gee F, Clubbs CF, Raine EV, Reynard LN, Loughlin J. Allelic expression analysis of the osteoarthritis susceptibility locus that maps to chromosome 3p21 reveals cis-acting eQTLs at GNL3 and SPCS1. BMC Med Genet. 2014;4;15:53. doi: 10.1186/1471-2350-15-53. [DOI] [PMC free article] [PubMed] [Google Scholar]
- 19.Tong Z, Board PG, Anders MW. Glutathione transferase zeta-catalyzed biotransformation of dichloroacetic acid and other α-halo acids. Chem. Res. Toxicol. 1998;11:1332–1338. doi: 10.1021/tx980144f. [DOI] [PubMed] [Google Scholar]
- 20.Dunbar EM, Coats BS, Shroads AL, Langaee T, Lew A, Forder JR, et al. Phase 1 trial of dichloroacetate (DCA) in adults with recurrent malignant brain tumors. Invest New Drugs. 2014;32(3):452–64. doi: 10.1007/s10637-013-0047-4. [DOI] [PMC free article] [PubMed] [Google Scholar]
Associated Data
This section collects any data citations, data availability statements, or supplementary materials included in this article.


