

Abstract
Mismatch negativity (MMN) and P3a are auditory event-related potential (ERP) components that show robust deficits in schizophrenia (SZ) patients and exhibit qualities of endophenotypes, including substantial heritability, test-retest reliability, and trait-like stability. These measures also fulfill criteria for use as cognition and function-linked biomarkers in outcome studies, but have not yet been validated for use in large-scale multi-site clinical studies. This study tested the feasibility of adding MMN and P3a to the ongoing Consortium on the Genetics of Schizophrenia (COGS) study. The extent to which demographic, clinical, cognitive, and functional characteristics contribute to variability in MMN and P3a amplitudes was also examined. Participants (HCS n=824, SZ n=966) underwent testing at 5 geographically distributed COGS laboratories. Valid ERP data was obtained from 91% of HCS and 91% of SZ patients. Highly significant MMN (d=0.96) and P3a (d=0.93) amplitude reductions were observed in SZ patients, comparable in magnitude to those observed in single-lab studies with no appreciable differences across laboratories. Demographic characteristics accounted for 26% and 18% of the variance in MMN and P3a amplitudes, respectively. Significant relationships were observed among demographically-adjusted MMN and P3a measures and medication status as well as several clinical, cognitive, and functional characteristics of the SZ patients. This study demonstrates that MMN and P3a ERP biomarkers can be feasibly used in multi-site clinical studies. As with many clinical tests of brain function, demographic factors contribute to MMN and P3a amplitudes and should be carefully considered in future biomarker-informed clinical studies.
Introduction
There is compelling evidence that sensory processing impairments contribute to the cognitive and psychosocial dysfunction affecting the majority of schizophrenia (SZ) patients (eg., Braff and Light, 2004; Javitt, 2009; Kirihara et al., 2012; Light et al., 2006). Mismatch negativity (MMN) and P3a are auditory event-related potential (ERP) components that have emerged as translational measures with promising applications for use as endophenotypes in genomic studies and as biomarkers in clinical outcome studies. These components are sequentially evoked as an ERP complex in response to unattended changes in background stimulation (Rissling et al., 2012; Rissling et al., in press; Takahashi et al., 2012). Since these measures require no overt behavioral response and can be elicited even in the absence of directed attention (e.g., Näätänen, 1990; Rissling et al., 2012; Rissling et al., 2013a), they are presumed to reflect a predominantly automatic or pre-conscious process of detecting a “mismatch” between the deviant stimulus and a sensory – memory trace (Naatanen, 1992; Naatanen et al., 1989).
Smaller amplitudes of MMN and P3a have been consistently identified in many studies of chronic (Michie, 2001; Shelley et al., 1991; Umbricht and Krljes, 2005), recent onset (Atkinson et al., 2012; Bodatsch et al., 2011; Brockhaus-Dumke et al., 2005; Hermens et al., 2010; Jahshan et al., 2012; Oades et al., 2006; Oknina et al., 2005; Salisbury et al., 2002; Umbricht et al., 2006) and unmedicated SZ patients (Catts et al., 1995; Kirino and Inoue, 1999; Rissling et al., 2012). Recently MMN has shown promise as a quantitative clinical biomarker for substantially improving the prediction of the development of psychosis in high risk populations (Atkinson et al., 2012; Bodatsch et al., 2011; Light and Näätänen, 2013; Nagai et al., 2013b; Perez et al., 2014a).
MMN and P3a are informative probes of the neural substrates of sensory processing abnormalities. These measures are supported by a distributed network of frontotemporal cortical sources underlying passive auditory sensory discrimination. Prominent SZ related deficits are evident in medial frontal brain regions (Rissling et al., in press; Takahashi et al., 2012). MMN is a sensitive index of N-methyl D-aspartate (Ehrlichman et al., 2008; Gil-da-Costa et al., 2013; Javitt et al., 1996; Lavoie et al., 2007; Nakamura et al., 2011; Umbricht et al., 2002; Umbricht et al., 2000) and nicotinic (Baldeweg et al., 2006; Dulude et al., 2010; Dunbar et al., 2007; Engeland et al., 2002; Inami et al., 2005; Inami et al., 2007; Martin et al., 2009; Preskorn et al., 2014) receptor functioning.
The temporal window of early information processing reflected by MMN and P3a appears to be a critical transitional zone from sensory-based processing to the engagement of higher attentional neural networks necessary for cognitive and psychosocial functioning (Rissling et al., 2013a). Indeed, previous studies have demonstrated that MMN and P3a are each significantly correlated with distinct domains of cognitive (Baldeweg et al. 2004; Naatanen et al. 2011; Light et al. 2007; Kawakubo et al. 2006) and psychosocial functioning (Light and Braff 2005a, b; Kawakubo et al. 2007; Wynn et al. 2010; Rasser et al. 2011). These components also exhibit utility as repeated measures over short and long (e.g., 12-month) retest intervals in both healthy subjects and SZ patients (Light et al. 2012; ICCs ≈0.90). Reliability coefficients and effect sizes of deficits in SZ for both MMN and P3a are comparable to or even exceed those obtained from standard neuropsychological tests commonly used in SZ research (Light et al. 2012; Light and Braff 2005b). This collection of attributes has contributed to the view of MMN as a “breakthrough biomarker” (Light and Naatanen 2013) that is “translatable” (Nagai et al. 2013) and potentially very important (Belger et al., 2012) in neuropsychiatry.
MMN also meets criteria for use as an endophenotype in genomic studies as it is highly heritable (Hall et al., 2009; Hall et al., 2006; Price et al., 2006), independent of fluctuations of clinical state and symptoms (Light et al., 2012; Shinozaki et al., 2002), and present in individuals at genetic risk for developing schizophrenia (Atkinson et al., 2012; Baker et al., 2005; Jessen et al., 2001; Michie et al., 2002; Schreiber et al., 1992). The NIMH Consortium on the Genetics of Schizophrenia (COGS) has pursued multi-site genetic studies of schizophrenia and related endophenotypes, first in a family study (Calkins et al., 2007; Light et al., 2014) of SZ probands, unaffected family members and healthy comparison subjects (HCS) and then more recently in a larger case-control study of SZ patients and unrelated HCS (COGS-2) described in this issue. Given the growing importance of MMN in schizophrenia research, this measure was added to COGS-2 in study years 2–4.
Sample size demands of genetic studies often require the use of multiple data collection sites. As we have previously noted (Swerdlow et al., 2014), this approach may present challenges for studies of complex phenotypes like MMN because of potential differences in laboratory conditions or sample characteristics across sites that introduce uncontrolled variance into experimental measures. On the other hand, by testing a more heterogeneous sample, multi-site studies increase the likelihood that findings will be generalizable rather than site-specific. Although there are now other consortium studies using ERPs in specialized academic laboratories with expertise in multi-sensor recordings (e.g., North American Prodromal Longitudinal Study, Bipolar & Schizophrenia Network), to our knowledge there are no published studies of the feasibility and fidelity of recording MMN and P3a using a simple, 2-channel system tested in laboratories that do not specialize in EEG acquisition. In this study, we first examined the “yield” of usable data obtained from the large cohort of participants tested across the COGS-2 laboratories. Second, we determined whether the data collected at 5 sites reproduce findings detected in large, single-site studies. Third, the large sample allows for the characterization of demographic factors associated with MMN and P3a amplitudes including age, sex, race, medication type, and smoking status. Lastly, we tested for significant bivariate relationships among MMN and P3a with measures of clinical, cognitive, and psychosocial functioning after accounting for identified demographic factors.
Methods
Participants
Participants included 1,790 (HCS n=824, SZ n=966) subjects that were recruited and tested at the 5 COGS-2 test sites: University of California San Diego (UCSD), University of California Los Angeles (UCLA), University of Washington (UW), University of Pennsylvania (PENN), and Mount Sinai School of Medicine (MSSM). All participants were assessed on their capacity to provide informed consent. After subjects were given a detailed description of their participation in the study, written consent was obtained via methods approved by the local human research protection committees at each testing site prior to participation (UCSD Protocol #:080435). Exclusionary factors included evidence of Axis I psychiatric and neurological disorders other than schizophrenia, head injury, stroke, substance abuse (except tobacco) or a history of psychotic disorders in first degree relatives of HCS as determined by the Family Interview for Genetic Studies (Maxwell, 1992). Urine toxicology screens were used to rule out recent drug use. Other study inclusion/exclusion criteria and assessment procedures are detailed in (Swerdlow et al., in press).
All participants were evaluated via the Structured Clinical Interview for DSM-IV (First et al., 1996). HCS were recruited through internet advertisements. SZ patients were recruited from community residential facilities and via clinician referral. Clinical symptoms were assessed with the Scale for the Assessment of Negative Symptoms (SANS; Andreasen, 1984) and the Scale for the Assessment of Positive Symptoms (SAPS; Andreasen, 1984). The Mini-Mental State Exam (MMSE) was used to quantify global cognition.
Stimuli and Procedures
A duration-deviant auditory oddball paradigm was employed following our established procedures (Kiang et al., 2009; Light and Braff, 2005; Light et al., 2007; Light et al., 2012; Light et al., 2010; Rissling et al., 2012; Rissling et al., 2010; Rissling et al., 2013a); see Figure 1. Subjects were presented with binaural tones (1-kHz, 85-dB, with 1-ms rise/fall, stimulus onset-to-onset asynchrony 500 ms) via insert earphones (Aearo Company Auditory Systems, Indianapolis, IN; Model 3A). Standard (P=0.90, 50-ms duration) and Deviant (P=0.10, 100-ms duration) tones were presented in pseudorandom order with a minimum of 6 Standard stimuli presented between each Deviant stimulus. During the approximately 20-min session, participants watched a silent cartoon video. Participants were instructed to attend to the video as they might be asked to answer questions about it at the end of the session.
Figure 1. MMN/P3a Paradigm and Group Averages.
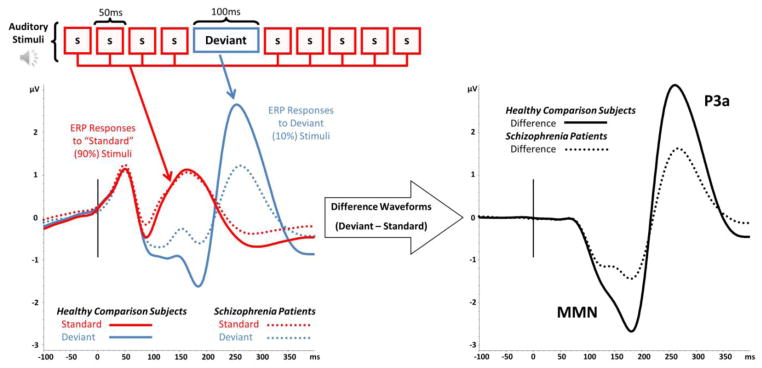
Participants are presented with stimuli consisting of frequently presented Standard stimuli (90% of trails, red box labeled “s”) interspersed with infrequent Deviant stimuli (10% of trials, blue box labeled “deviant”). ERP waves to Standard and Deviant stimuli are calculated by averaging EEG responses to each stimulus type. Deviant – Standard difference waves are generated for calculating MMN and P3a components (black lines). For all waveforms, solid lines represent Healthy Comparison Subjects (n=753) dotted lines are used for Schizophrenia Patients (n=877).
Electroencephalographic (EEG) Recording
A 2-channel EEG system with a pre-set MMN module was used for stimulus presentation and EEG recording (ERPlab, San Diego Instruments, San Diego, CA). One channel recorded EEG activity at the vertex (Cz) referenced to the left mastoid process (full scale setting 0.1, bandpass filter settings 0.5–100Hz). A second channel recorded eye movement (EOG) activity from electrodes placed mid superior and lateral to the right orbit (full scale setting 0.25, bandpass filter settings 0.5–100Hz). A ground electrode was placed on the right mastoid. All electrode impedances were below 5kΩ. Subjects were seated comfortably in front of a computer monitor and directed to fixate their gaze on the center of the screen. A hearing test was conducted to ensure <=40 dB hearing threshold bilaterally to 1000Hz tones.
EEG Data Processing
Continuous EEG data from all 5 COGS-2 sites were uploaded to a centralized database. Quality assurance data review and analysis was then conducted by a single investigator (GL) who was blind to all demographic and diagnostic information. EEG data were processed using Brain Vision Analyzer 2.0 (Brain Products GmbH). Data were digitally filtered between 0.1 and 30 Hz (24dB/oct) and eye movement artifact was removed using an automated correction algorithm. Intervals with additional EEG artifact (activity exceeding +/−50μV) at the Cz electrode were excluded from further analysis. Remaining trials were then sorted and combined to form separate average ERP waveforms for the deviant and standard tone conditions. MMN and P3a difference waveforms were generated by subtracting ERPs in response to standard tones from the ERPs generated in response to the deviant stimuli. These difference waves were baseline corrected relative to the 100ms pre-stimulus interval and visually inspected to determine the presence or absence of reliably identifiable ERP components. A highly conservative and stringent approach to data inclusion was employed. Data without an unambiguous response to the standard tone, or a reliably identifiable MMN or P3a response to the difference waves were excluded from further analyses. MMN and P3a amplitudes were respectively quantified as the mean amplitude from 135–205 ms and 250–300 ms time windows.
Assessment of Functional Capacity
Patients’ functional capacity was assessed with the abbreviated version of the UCSD Performance Based Skills Assessment (UPSA-B; Patterson et al., 2001). The UPSA directly measures functional skills, using standardized tasks that are commonly encountered in everyday situations and considered necessary for independent community living including: financial management and communication skills.
Assessment of Psychosocial Functional Status
The Scale of Functioning was used to assess psychosocial functional status in domains of independent living, social, and instrumental functioning (Rapaport et al., 1996). The Role Functioning Scale (RFS; McPheeters, 1984) assesses working productivity, independent living/self care, family network relationships, and immediate social network relationship (close friends, spouse).
Analyses
A series of multivariate linear regression models were separately applied using MMN and P3a as dependent variables. A strategy of comparing incremental fit of variables or variable sets was employed (Cohen et al., 2003). Four levels were defined as follows: 1) demographic variables (age, sex, and race); 2) group (patient status); 3) test site; and 4) group-by-site interaction. Each level was tested for significant improvement in model fit, in order, with an alpha set to .05 with the additional constraint that the step account for a minimum of additional 5% of variance in the dependent variable. Only variables in sets that led to significant and meaningful improvement in model fit were retained (although the interaction models tested always included all relevant main effects). Finally, we tested the significance of select regression parameters only for those variables in sets shown to significantly improve model fit. All analyses were conducted using R (R Development Core Team, 2011).
Results
The total number of included participants for whom ERP data were uploaded to the COGS-2 database was 1,790 (HCS n=824, SZ n=966); 91% of participants in each group (HCS n=753, SZ n=877) were deemed to have data of sufficient quality to permit further analysis. Consistent with previous studies conducted in single laboratories, significant large effect size deficits in MMN (d=0.96) and P3a (d=0.93) were observed in SZ patients. Individual data for each of the 1630 participants and group waveform averages are shown in Figure 2. Table 1 reports clinical and demographic characteristics of the current samples (for an expanded table of the complete sample broken down by site see Swerdlow et al. (in press). Significant group differences were detected in age (patients older than controls), sex (more male patients), self-identified racial composition, and smoking (more patients smoked). As expected, SZs and HCS also differed on education and Mini-Mental State Exam scores.
Figure 2. Individual subject and group averaged waveforms.

Individual subject Deviant-Standard difference wave averages (color coded by amplitude) are shown in the upper portion of the figure for Healthy Comparison Subjects (n=753) and Schizophrenia Patients (n=877). Group grandaverage waveforms are shown in the lower portion of the figure.
Table 1.
Clinical and Demographic Characteristics of Controls and Patients
| Controls (HCS) | Patients (SZ) | p | E.S. | |
|---|---|---|---|---|
| Sample Size | 753 | 877 | ||
| Age M (SD) | 38.63 (12.80) | 46.25 (11.23) | < .001 | .30 |
| Education M (SD) | 14.99 (2.20) | 12.63 (2.15) | < .001 | .48 |
| Male | 371 (49%) | 616 (70%) | < .001 | .21 |
| Race | n (% full sample) | n (% full sample) | < .001 | .19 |
| Caucasian | 438 (58%) | 380 (43%) | ||
| African American | 159 (21%) | 162 (18%) | ||
| Other | 156 (21%) | 335 (38%) | ||
| Smoker | 84 (11%) | 464 (53%) | < .001 | .44 |
| Site | .016 | .09 | ||
| UCSD | 179 (24%) | 252 (29%) | ||
| UCLA | 186 (25%) | 200 (23%) | ||
| UW | 159 (21%) | 138 (16%) | ||
| PENN | 153 (20%) | 202 (23%) | ||
| MSSM | 76 (10%) | 85 (10%) | ||
| MMSE M (SD) | 33.61 (1.69) | 31.12 (3.31) | < .001 | .42 |
| SAPS M (SD) | 6.88 (4.09) | |||
| SANS M (SD) | 11.64 (5.36) | |||
| Age of Onset M (SD) | 22.52 (7.23) |
Note. UCSD=University of California, San Diego; UCLA=University of California, Los Angeles; MSSM=Mount Sinai School of Medicine; PENN=University of Pennsylvania; UW=University of Washington; MMSE=Mini-Mental State Exam; SAPS=Scale for the Assessment of Positive Symptoms; SANS=Scale for the Assessment of Negative Symptoms. Effect sizes (E.S.) are reported as point-biserial correlation coefficients for continuous (x) variables and Cramer’s V (or simply phi) for categorical (x) variables.
For MMN, the demographic characteristics of age, sex, and race accounted for 26% of variance, F(4,1625)=140.10, p<0.001 (Figures 3 and 4). The addition of group significantly improved model fit (p<0.05; ΔR2=.07). The addition of site did not significantly improve model fit (p=.77; Figure 5). The group-by-site interaction was statistically significant; however, the effect size was trivially small, accounting for only an additional 1% of variance in MMN (p<0.001; ΔR2=.01). In the model predicting MMN from demographic variables and group [F(5,1624)=155.10, p<0.001, R2=.32], age had the strongest demographic effect (b=0.03, p<.001, R2partial=.11). The effect of group (SZ) remained highly significant (b=0.65; p<.001; R2partial=.08) even after covarying demographic variables.
Figure 3. Mean mismatch negativity (MMN) and P3a amplitude plotted for Healthy Comparison Subjects (HCS) and Schizophrenia Patients (SZ) by age.

MMN and P3a values by site are corrected for sex and race. Errors bars indicate 1 SE.
Figure 4. Mean mismatch negativity (MMN) and P3a amplitude plotted for Healthy Comparison Subjects (HCS) and Schizophrenia Patients (SZ) by sex.

MMN and P3a values by site are corrected for age and race. Errors bars indicate 1 SE.
Figure 5. Mean mismatch negativity (MMN) and P3a amplitude plotted for Healthy Comparison Subjects (HCS) and Schizophrenia Patients (SZ) by site.

MMN and P3a values by site are corrected for age, sex, and race. UCSD=University of California, San Diego; UCLA=University of California, Los Angeles; MSSM=Mount Sinai School of Medicine; PENN=University of Pennsylvania; UW=University of Washington. Errors bars indicate 1 SE.
For P3a, demographic characteristics of age, sex, and race accounted for 18% of variance F(4,1625)=91.11, p<0.001 (Figures 3 and 4). The addition of group significantly improved model fit (p<0.001; ΔR2=.08). The addition of site was statistically significant given the large N; however, the effect was trivially small, accounting for only 1% of additional variance in P3a (p=.001; ΔR2=.01; Figure 5). The addition of the group-by-site interaction term did not significantly improve model fit (p=.36). In the model predicting P3a from demographic variables and group [F(5,1624)=114.30, p<0.001, R2=.26], age had the strongest demographic effect (b=−0.03, p<.001, R2partial=.04). The effect of group (SZ) remained highly significant (b=−0.97; p<.001; R2partial=.091) even after covarying demographic variables.
For both MMN and P3a, older age, male sex, African American race, and SZ all predicted significantly smaller amplitudes (i.e., less negative MMN and less positive P3a). Notably, impedance values were also higher for African Americans (M = 4.12; SE = .10) compared to Caucasians (M = 3.21; SE = .07).
This large sample allowed for secondary analyses within the SZ group only, including comparisons of unmedicated patients with those treated with different classes of antipsychotics, with vs. without anticholinergic treatment, and smokers vs. non-smokers. For MMN, the addition of medication type significantly improved model fit over demographic variables (age, sex, and race) alone. Compared to no medication, 1st generation antipsychotics (p=.035) and the combination of both 1st and 2nd generation antipsychotics (p=.001) predicted smaller (i.e., less negative) MMN amplitudes. In contrast, unmedicated patients did not differ from patients receiving 2nd generations antipsychotics (p=.129). For P3a, 1st generation antipsychotics (p=.002), 2nd generation antipsychotics (p<.001), and the combination of both (p=.001) all predicted smaller (less positive) amplitudes. Figure 6 plots MMN and P3a in SZ patients by medication type. MMN amplitudes were also significantly smaller in patients who were treated with anticholinergic medications (p<.001); P3a did not significantly differ (p=.10; Figure 7). Significantly smaller MMN (p=.04) and P3a (p<.001) amplitudes were also detected in SZ patients who were smokers vs. non-smokers (Figure 8)1. HCS are included in Figures 6–8 for reference, but were not included in the regression analyses.
Figure 6. Mean mismatch negativity (MMN) and P3a amplitude plotted for Healthy Comparison Subjects (HCS) and Schizophrenia Patients (SZ) by antipsychotic medication type.

MMN and P3a values are corrected for age, sex, and race. Errors bars indicate 1 SE.
Figure 7. Mean mismatch negativity (MMN) and P3a amplitude plotted Healthy Comparison Subjects (HCS) and Schizophrenia Patients (SZ) by use of anticholinergic medication.

MMN and P3a values are corrected for age, sex, and race. Errors bars indicate 1 SE.
Figure 8. Mean mismatch negativity (MMN) and P3a amplitude plotted Healthy Comparison Subjects (HCS) and Schizophrenia Patients (SZ) by smoking status.

MMN and P3a values are corrected for age, sex, and race. Errors bars indicate 1 SE.
Finally, Table 2 reports correlations between corrected MMN and P3a values and several additional clinical variables of interest. Significant correlations were observed among MMN and age of illness onset, positive and negative symptoms, global cognitive function (MMSE), performance on tasks necessary for independent functioning (UPSA), psychosocial functional status (SOF), and Role Functioning (RFS). P3a was significantly associated with age of illness onset and psychosocial functional status.
Table 2.
Correlations between demographically adjusted Mismatch Negativity (MMN) and P3a amplitudes with clinical, cognitive, and functional measures.
| MMN | P3a | |
|---|---|---|
| P3a | −0.28*** | |
| MMSE | −0.14*** | 0.05 |
| SAPS | 0.08* | −0.02 |
| SANS | 0.10** | 0.02 |
| Age of Onset | −0.09* | 0.07* |
| Scale of Functioning | −0.09** | 0.07* |
| UPSA-B | −0.16*** | 0.06 |
| Role Functioning | −0.13*** | 0.07 |
Note.
=p<0.001;
=p<0.01;
=p<0.05.
Discussion
MMN and P3a have emerged as promising biomarkers for understanding and treating psychotic disorders (Belger et al., 2012; Braff and Light, 2004; Javitt, 2009; Light and Näätänen, 2013; Light and Swerdlow, 2014; Nagai et al., 2013a; Perez et al., 2014a). These measures have already undergone extensive psychometric validation (Kiang et al., 2009; Light et al., 2012; Rissling et al., 2012; Takahashi et al., 2012). MMN has demonstrated utility for forecasting the duration of time to conversion of psychosis in at risk individuals (Bodatsch et al., 2011; Perez et al., 2014b). In addition, MMN is sensitive to pharmacologic (Baldeweg et al., 2006; Dulude et al., 2010; Dunbar et al., 2007; Ehrlichman et al., 2008; Engeland et al., 2002; Gil-da-Costa et al., 2013; Inami et al., 2005; Inami et al., 2007; Javitt et al., 1996; Lavoie et al., 2007; Martin et al., 2009; Nakamura et al., 2011; Preskorn et al., 2014; Umbricht et al., 2002; Umbricht et al., 2000) and cognitive challenges (Rissling et al., 2013b) and predicts a positive response to some treatments (e.g., Kawakubo et al., 2007).
This paper demonstrates the feasibility of using MMN (and P3a) in multi-site studies of SZ patients and HCS and multi-site treatment trials with centralized quality assurance, data management, and analysis. The COGS-2 platform provided an unprecedented volume of subjects that allowed for the disentangling and discovery of participant-related characteristics that account for significant proportions of variability in MMN and P3a neurophysiologic biomarkers. We found that a relatively simple, 2-channel system yielded 91% usable MMN and P3a data in less than 30 minutes. The observed results replicate findings of highly significant MMN (d=0.96) and P3a (d=0.93) amplitude reductions in SZ comparable to those previously obtained in a single-laboratory with no appreciable differences across sites, further validating the use of these measures in multi-site studies. The large sample size also allowed for the identification and characterization of demographic factors that significantly contribute to MMN and P3a amplitudes. Significant clinical, cognitive, and functional correlates were observed. These results have implications for future genomic and clinical outcome studies.
It is important to emphasize that since ERP measures were added to the established COGS-2 study, many of the commonly used optimal environmental characteristics used in EEG studies could not be imposed on the sites (e.g., sound proofed and/or electrically shielded rooms, on-site expertise in electrophysiology). In fact, research assistants received a cumulative total of only 2.5 hrs of face-to-face training annually for both MMN/P3a and P3b paradigms (P3b findings reported separately in this issue by Turetsky et al.), though this training was embedded in the context of comprehensive 2-day assessment workshops. This 2.5 hr training encompassed general EEG assessment principles, electrode application, impedance measurement and reduction, equipment installation and configuration, software setup and operation, data quality monitoring and patient instruction, and data upload procedures. Despite these apparent limitations, usable data was obtained from 91% of tested participants—an encouraging finding that should accelerate efforts to incorporate EEG biomarker testing in “real-world” clinical settings. This high rate of usable data could likely be further improved with additional training and oversight to correct some avoidable problems that occurred with test administration.
The expected patterns of results replicate previous findings from studies conducted in single-site, EEG specialty laboratories that benefit from onsite technical expertise, sophisticated high-density recording equipment, and environmental controls (e.g., dedicated sound-isolated recording suites). First, SZ patients exhibited uncorrected effect size deficits equivalent in magnitude to our previously published studies that used identical stimulation parameters, but different equipment (Jahshan et al., 2012; Kiang et al., 2009; Light and Braff, 2005; Light et al., 2007; Light et al., 2012; Rissling et al., 2012; Takahashi et al., 2012) and meta-analyses (Umbricht and Krljes, 2005). Deficits of this large magnitude are visually evident in both the group averages as well as in individual subject data obtained from all 1,630 patients as shown in Figure 2. Second, demographic factors – especially age – are strong contributors to MMN and P3a. Indeed, these factors collectively account for 26 and 18% of the variance in MMN and P3a, respectively, and also extend our previous findings using this paradigm (Kiang et al., 2009; Rissling et al., 2012; Takahashi et al., 2012). Third, sex and race also appear to contribute to MMN and P3a independent of the expected age and group effects. Specifically, females exhibited slightly larger ERP amplitudes. Likewise, race appears to be a significant predictor of MMN and P3a; slightly smaller amplitudes were detected in African Americans. Notably, impedance values were also significantly higher in African Americans which may have resulted in reduced signal-to-noise ratios of EEG, thereby attenuating ERP amplitudes. Fourth, it is important to note that several significant correlations were detected with demographically adjusted ERP amplitudes with the clinical, cognitive, and functional characteristics of the SZ patients; these correlations replicate and extend previous findings and further emphasize the utility of this approach. Specifically, smaller MMN amplitude was associated with an earlier age of illness onset, more severe positive and negative symptoms, worse global cognitive function, reduced functional capacity, functional status, and role functioning. Similarly, reduced P3a was significantly associated with an earlier age of illness onset and worse psychosocial functional status.
Demographic adjustment is a standard practice in clinical neuropsychological assessments of brain function (e.g., Heaton et al., 1991; Norman et al., 2011) and a similar strategy will clearly be necessary should these promising ERP biomarkers be used to guide assignment of patients to clinical interventions (Light and Näätänen, 2013; Light and Swerdlow, 2014; Perez et al., 2014a). A dramatic example of the importance of the demographic corrections can be drawn from the expanding number of studies demonstrating that MMN can improve the identification of children at highest imminent risk for developing psychosis (Nagai et al., 2013a). This literature raises the tantalizing possibility that a simple laboratory assay, alone or in conjunction with other measures, can contribute to prophylactic or early interventions strategies. While this hope appears reasonable, the risk of misclassification by failing to account for demographic factors can have profound deleterious effects.
Specific design considerations can be employed to minimize the impact of potential demographic confounds. For example, in repeated measures designs an individual serves as his or her own control across time or conditions. Such designs would allow for investigators (or clinicians) to identify individuals who experience a significant change in ERP amplitudes over time. Thus, children being monitored due to being at elevated risk for developing a psychotic disorder may exhibit a significant change in MMN amplitudes suggestive of a decline in brain function. Conversely, patients who exhibit malleability of ERPs in response to targeted cognitive and/or pharmacologic interventions could be selected for further treatments (Light and Näätänen, 2013; Light and Swerdlow, 2014; Perez et al., 2014a). If repeated measures designs are suboptimal for a specific application, the use of homogeneous subgroups carefully matched in at least age — the most robust demographic covariate of MMN and P3a components--should be considered.
There are caveats and cautionary notes for interpreting this extensive characterization of MMN and P3a in SZ patients and HCS. First, the analyses presented in this manuscript represent an initial examination in a rich and fertile database. There are likely other factors (e.g., substance use histories) that also contribute to variability in MMN and P3a amplitudes that require examination in future analyses. Second, the extensive COGS-2 assessment was cross-sectional and does not lend itself to identifying cause-effect relationships. For example, does the finding that unmedicated SZ patients have larger MMN and P3a amplitudes suggest that antipsychotics “cause” a reduction in these measures or do patients who do not take or perhaps even require antipsychotics (and are presumably less symptomatic and higher functioning) have larger (more “normal”) amplitudes? Post hoc analyses revealed that these antipsychotic medication subgroups also significantly differed on other key clinical, cognitive, and functional domains — an issue for future planned analyses. Third, some statistically significant findings yielded small effects (e.g., smoking and anticholinergic medications) or relied upon imprecise (perhaps even anachronistic) subgroupings such as self-identified race; care should be taken to not over-interpret such unreplicated findings. Fourth, the use of only 2 channels in this simplified system, while highly practical for non-specialty centers, obviously precludes the ability to perform EEG analyses that require higher-density sensor arrays such as examination of the neural substrates in clinical populations (Rissling et al., in press; Takahashi et al., 2012).
In conclusion, this study demonstrates that MMN and P3a ERP biomarkers can be feasibly added to multi-site clinical studies without the usual constraints for most high-density EEG studies conducted in academic EEG specialty centers. The absence of site differences support the use and further development of ERP applications for use in real-world community care centers. As with many clinical tests of brain function, demographic factors, particularly age, contribute to MMN and P3a amplitudes and should be carefully considered in future biomarker-informed clinical studies (Light and Näätänen, 2013; Light and Swerdlow, 2014; Perez et al., 2014a). Demographic corrected MMN and P3a amplitudes exhibit significant correlations with well-established measures of clinical, cognitive, and psychosocial functioning in SZ patients, which replicate and extend previous studies and further underscore the utility of these measures. This platform will serve as a valuable resource for future functional and genomic analyses.
Acknowledgments
The authors wish to thank all of the participants and support staff that made this study possible, including the following key personnel:
University of California San Diego (R01-MH065571; MH042228, MH079777, MH087889, Brain Behaviora Research Foundation, Sydney R. Baer Jr. Foundation): Joyce Sprock, Barbara Haugeland, Lauren Belleville, Stacy Langton, Daniel Mathias, Natalie McCarthy, Marlena Pela, Erich Riesen, Maria Bongiovanni
Mount Sinai School of Medicine (RO1-MH065554): Rui Ferreira, Carolyn Khanian, Denise Poche-Jetter, Rebecca West
University of California Los Angeles (RO1-MH65707): William Horan, Mark Sergi, Amanda Bender, Lusineh Gharapetian, Robert Hubert, Heidi Kuppinger, Trinh Luu, Ian Mathis, Mark McGee, Anaceci Myers, Felice Reddy, Amber Tidwell, Christen Waldon, Katie Weiner
University of Pennsylvania (RO1-MH65578): Amy Cassidy, Erich Dress, Colin Gallagher, Mary March, Kathleen McKenna, Alison Mott, Michael Pato, Jan Richards, Kosha Ruparel, Chandni Singh
University of Washington (R01-MH65558): Kate B. Alvey, Andrew C. David, Sean P. Meichle, Denise O. Pritzl, Sean Meichle, Sandra Perry, Annelise Sullivan, Jane Whetstone, Jake Wolf-Saxon
Role of funding sources
Other than providing support, the National Institute of Health does not have any further role in this manuscript.
Footnotes
An individual was classified as a smoker if they reported smoking at least 1 cigarette per day. The effect of smoking on MMN and P3a was also examined in the initial regression models. For MMN neither smoker nor group by smoker significantly improved the model fit. When the smoker variable was added to the regression model predicting P3a from demographic variables and the group status variable, the improvement in fit was trivial, accounting for less than 1% of added variance in MMN (p<0.01; ΔR2=.003). Adding a smoker by group interaction term did not significantly improve model fit compared to the model with a main effect alone. A similar, if not weaker, pattern of results was obtained when number of cigarettes smoked per day was used.
Contributors
Dr. Light provided training and ongoing quality assurance for MMN and P3a measures acquired at all COGS-2 sites. Dr. Light also processed and analyzed all EEG data and wrote the manuscript. Drs. Thomas, Lazzeroni, Sugar, and Light contributed to the statistical analysis plan. All other authors participated in aspects of study design, including subject recruitment, EEG testing, and validation of the clinical and endophenotype data. All authors were responsible for reviewing, editing, and approving the final version of the manuscript.
Conflicts of Interest:
Dr. Light reports having been a consultant to EnVivo/Forum and Astellas and serves on an advisory board for Neuroverse. Dr. Green has been a consultant to AbbVie, Biogen, DSP, EnVivo/Forum and Roche, and he is on the scientific advisory board of Mnemosyne. He has received research funds from Amgen. Dr. Lazzeroni is an inventor on a patent application filed by Stanford University on genetic polymorphisms associated with depression. Dr. Nuechterlein has received unrelated research support from Janssen Scientific Affairs, Genentech, and Brain Plasticity, Inc., and has consulted to Genentech, Otsuka, Janssen, and Brain Plasticity, Inc. Dr. Swerdlow has been a consultant for Genco Sciences, Ltd. All other authors declare that they have no conflict of interest.
Publisher's Disclaimer: This is a PDF file of an unedited manuscript that has been accepted for publication. As a service to our customers we are providing this early version of the manuscript. The manuscript will undergo copyediting, typesetting, and review of the resulting proof before it is published in its final citable form. Please note that during the production process errors may be discovered which could affect the content, and all legal disclaimers that apply to the journal pertain.
References
- Andreasen NC. Scale for the Assessment of Negative Symptoms (SANS) University of Iowa; Iowa City: 1984. [Google Scholar]
- Atkinson RJ, Michie PT, Schall U. Duration mismatch negativity and P3a in first-episode psychosis and individuals at ultra-high risk of psychosis. Biol Psychiatry. 2012;71(2):98–104. doi: 10.1016/j.biopsych.2011.08.023. [DOI] [PubMed] [Google Scholar]
- Baker K, Baldeweg T, Sivagnanasundaram S, Scambler P, Skuse D. COMT Val108/158 Met modifies mismatch negativity and cognitive function in 22q11 deletion syndrome. Biological Psychiatry. 2005;58(1):23–31. doi: 10.1016/j.biopsych.2005.03.020. [DOI] [PubMed] [Google Scholar]
- Baldeweg T, Wong D, Stephan KE. Nicotinic modulation of human auditory sensory memory: Evidence from mismatch negativity potentials. Int J Psychophysiol. 2006;59(1):49–58. doi: 10.1016/j.ijpsycho.2005.07.014. [DOI] [PubMed] [Google Scholar]
- Belger A, Yucel GH, Donkers FC. In search of psychosis biomarkers in high-risk populations: is the mismatch negativity the one we’ve been waiting for? Biol Psychiatry. 2012;71(2):94–95. doi: 10.1016/j.biopsych.2011.11.009. [DOI] [PubMed] [Google Scholar]
- Bodatsch M, Ruhrmann S, Wagner M, Muller R, Schultze-Lutter F, Frommann I, Brinkmeyer J, Gaebel W, Maier W, Klosterkotter J, Brockhaus-Dumke A. Prediction of psychosis by mismatch negativity. Biol Psychiatry. 2011;69(10):959–966. doi: 10.1016/j.biopsych.2010.09.057. [DOI] [PubMed] [Google Scholar]
- Braff DL, Light GA. Preattentional and attentional cognitive deficits as targets for treating schizophrenia. Psychopharmacology. 2004;174(1):75–85. doi: 10.1007/s00213-004-1848-0. [DOI] [PubMed] [Google Scholar]
- Brockhaus-Dumke A, Tendolkar I, Pukrop R, Schultze-Lutter F, Klosterkotter J, Ruhrmann S. Impaired mismatch negativity generation in prodromal subjects and patients with schizophrenia. Schizophrenia research. 2005;73(2–3):297–310. doi: 10.1016/j.schres.2004.05.016. [DOI] [PubMed] [Google Scholar]
- Calkins ME, Dobie DJ, Cadenhead KS, Olincy A, Freedman R, Green MF, Greenwood TA, Gur RE, Gur RC, Light GA, Mintz J, Nuechterlein KH, Radant AD, Schork NJ, Seidman LJ, Siever LJ, Silverman JM, Stone WS, Swerdlow NR, Tsuang DW, Tsuang MT, Turetsky BI, Braff DL. The Consortium on the Genetics of Endophenotypes in Schizophrenia: model recruitment, assessment, and endophenotyping methods for a multisite collaboration. Schizophr Bull. 2007;33(1):33–48. doi: 10.1093/schbul/sbl044. [DOI] [PMC free article] [PubMed] [Google Scholar]
- Catts SV, Shelley AM, Ward PB, Liebert B, McConaghy N, Andrews S, Michie PT. Brain potential evidence for an auditory sensory memory deficit in schizophrenia. The American journal of psychiatry. 1995;152(2):213–219. doi: 10.1176/ajp.152.2.213. [DOI] [PubMed] [Google Scholar]
- Cohen J, Cohen P, West SG, Aiken LS. Applied multiple regression/correlation analysis for the behavioral sciences. 3. L. Erlbaum Associates; Mahwah, N.J: 2003. [Google Scholar]
- Dulude L, Labelle A, Knott VJ. Acute nicotine alteration of sensory memory impairment in smokers with schizophrenia. Journal of clinical psychopharmacology. 2010;30(5):541–548. doi: 10.1097/JCP.0b013e3181f0c9c6. [DOI] [PubMed] [Google Scholar]
- Dunbar G, Boeijinga PH, Demazieres A, Cisterni C, Kuchibhatla R, Wesnes K, Luthringer R. Effects of TC-1734 (AZD3480), a selective neuronal nicotinic receptor agonist, on cognitive performance and the EEG of young healthy male volunteers. Psychopharmacology (Berl) 2007;191(4):919–929. doi: 10.1007/s00213-006-0675-x. [DOI] [PubMed] [Google Scholar]
- Ehrlichman RS, Maxwell CR, Majumdar S, Siegel SJ. Deviance-elicited changes in event-related potentials are attenuated by ketamine in mice. J Cogn Neurosci. 2008;20(8):1403–1414. doi: 10.1162/jocn.2008.20097. [DOI] [PubMed] [Google Scholar]
- Engeland C, Mahoney C, Mohr E, Ilivitsky V, Knott V. Nicotine and sensory memory in Alzheimer’s disease: an event-related potential study. Brain and cognition. 2002;49(2):232–234. [PubMed] [Google Scholar]
- First M, Spitzer R, Gibbon M, Williams J, Benjamin L. Structured clinical interview for DSM-IV Axis II disorders (SCID-II, Version 2.0) New York State Psychiatric Institute; New York: 1996. [Google Scholar]
- Gil-da-Costa R, Stoner GR, Fung R, Albright TD. Nonhuman primate model of schizophrenia using a noninvasive EEG method. Proceedings of the National Academy of Sciences of the United States of America. 2013;110(38):15425–15430. doi: 10.1073/pnas.1312264110. [DOI] [PMC free article] [PubMed] [Google Scholar]
- Hall MH, Schulze K, Rijsdijk F, Kalidindi S, McDonald C, Bramon E, Murray RM, Sham P. Are auditory P300 and duration MMN heritable and putative endophenotypes of psychotic bipolar disorder? A Maudsley Bipolar Twin and Family Study. Psychol Med. 2009;39(8):1277–1287. doi: 10.1017/S0033291709005261. [DOI] [PubMed] [Google Scholar]
- Hall MH, Schulze K, Rijsdijk F, Picchioni M, Ettinger U, Bramon E, Freedman R, Murray RM, Sham P. Heritability and reliability of P300, P50 and duration mismatch negativity. Behavior genetics. 2006;36(6):845–857. doi: 10.1007/s10519-006-9091-6. [DOI] [PubMed] [Google Scholar]
- Heaton RK, Grant IS, Matthews CG. Comprehensive Norms for an Expanded Halstead-Reitan Battery: Demographic Corrections, Research Findings, and Clinical Applications. Psychological Assessment Resources; Odessa, FL: 1991. [Google Scholar]
- Hermens DF, Ward PB, Hodge MA, Kaur M, Naismith SL, Hickie IB. Impaired MMN/P3a complex in first-episode psychosis: cognitive and psychosocial associations. Progress in neuro-psychopharmacology & biological psychiatry. 2010;34(6):822–829. doi: 10.1016/j.pnpbp.2010.03.019. [DOI] [PubMed] [Google Scholar]
- Inami R, Kirino E, Inoue R, Arai H. Transdermal nicotine administration enhances automatic auditory processing reflected by mismatch negativity. Pharmacology, biochemistry, and behavior. 2005;80(3):453–461. doi: 10.1016/j.pbb.2005.01.001. [DOI] [PubMed] [Google Scholar]
- Inami R, Kirino E, Inoue R, Suzuki T, Arai H. Nicotine effects on mismatch negativity in nonsmoking schizophrenic patients. Neuropsychobiology. 2007;56(2–3):64–72. doi: 10.1159/000111536. [DOI] [PubMed] [Google Scholar]
- Jahshan C, Cadenhead KS, Rissling AJ, Kirihara K, Braff DL, Light GA. Automatic sensory information processing abnormalities across the illness course of schizophrenia. Psychol Med. 2012;42(1):85–97. doi: 10.1017/S0033291711001061. [DOI] [PMC free article] [PubMed] [Google Scholar]
- Javitt DC. When doors of perception close: bottom-up models of disrupted cognition in schizophrenia. Annual review of clinical psychology. 2009;5:249–275. doi: 10.1146/annurev.clinpsy.032408.153502. [DOI] [PMC free article] [PubMed] [Google Scholar]
- Javitt DC, Steinschneider M, Schroeder CE, Arezzo JC. Role of cortical N-methyl-D-aspartate receptors in auditory sensory memory and mismatch negativity generation: implications for schizophrenia. Proceedings of the National Academy of Sciences of the United States of America. 1996;93(21):11962–11967. doi: 10.1073/pnas.93.21.11962. [DOI] [PMC free article] [PubMed] [Google Scholar]
- Jessen F, Fries T, Kucharski C, Nishimura T, Hoenig K, Maier W, Falkai P, Heun R. Amplitude reduction of the mismatch negativity in first-degree relatives of patients with schizophrenia. Neurosci Lett. 2001;309(3):185–188. doi: 10.1016/s0304-3940(01)02072-9. [DOI] [PubMed] [Google Scholar]
- Kawakubo Y, Kamio S, Nose T, Iwanami A, Nakagome K, Fukuda M, Kato N, Rogers MA, Kasai K. Phonetic mismatch negativity predicts social skills acquisition in schizophrenia. Psychiatry research. 2007;152(2–3):261–265. doi: 10.1016/j.psychres.2006.02.010. [DOI] [PubMed] [Google Scholar]
- Kiang M, Braff DL, Sprock J, Light GA. The relationship between preattentive sensory processing deficits and age in schizophrenia patients. Clinical Neurophysiology. 2009;120(11):1949–1957. doi: 10.1016/j.clinph.2009.08.019. [DOI] [PMC free article] [PubMed] [Google Scholar]
- Kirihara K, Rissling AJ, Swerdlow NR, Braff DL, Light GA. Hierarchical organization of gamma and theta oscillatory dynamics in schizophrenia. Biol Psychiatry. 2012;71(10):873–880. doi: 10.1016/j.biopsych.2012.01.016. [DOI] [PMC free article] [PubMed] [Google Scholar]
- Kirino E, Inoue R. The relationship of mismatch negativity to quantitative EEG and morphological findings in schizophrenia. Journal of psychiatric research. 1999;33(5):445–456. doi: 10.1016/s0022-3956(99)00012-6. [DOI] [PubMed] [Google Scholar]
- Lavoie S, Murray MM, Deppen P, Knyazeva MG, Berk M, Boulat O, Bovet P, Bush AI, Conus P, Copolov D. Glutathione precursor, N-acetyl-cysteine, improves mismatch negativity in schizophrenia patients. Neuropsychopharmacology : official publication of the American College of Neuropsychopharmacology. 2007;33(9):2187–2199. doi: 10.1038/sj.npp.1301624. [DOI] [PubMed] [Google Scholar]
- Light G, Greenwood TA, Swerdlow NR, Calkins ME, Freedman R, Green MF, Gur RE, Gur RC, Lazzeroni LC, Nuechterlein KH, Olincy A, Radant AD, Seidman LJ, Siever LJ, Silverman JM, Sprock J, Stone WS, Sugar CA, Tsuang DW, Tsuang MT, Turetsky BI, Braff DL. Comparison of the Heritability of Schizophrenia and Endophenotypes in the COGS-1 Family Study. Schizophr Bull. 2014 doi: 10.1093/schbul/sbu064. [DOI] [PMC free article] [PubMed] [Google Scholar]
- Light GA, Braff DL. Mismatch negativity deficits are associated with poor functioning in schizophrenia patients. Archives of general psychiatry. 2005;62(2):127. doi: 10.1001/archpsyc.62.2.127. [DOI] [PubMed] [Google Scholar]
- Light GA, Hsu JL, Hsieh MH, Meyer-Gomes K, Sprock J, Swerdlow NR, Braff DL. Gamma band oscillations reveal neural network cortical coherence dysfunction in schizophrenia patients. Biol Psychiatry. 2006;60(11):1231–1240. doi: 10.1016/j.biopsych.2006.03.055. [DOI] [PubMed] [Google Scholar]
- Light GA, Näätänen R. Mismatch negativity is a breakthrough biomarker for understanding and treating psychotic disorders. Proceedings of the National Academy of Sciences. 2013;110(38):15175–15176. doi: 10.1073/pnas.1313287110. [DOI] [PMC free article] [PubMed] [Google Scholar]
- Light GA, Swerdlow NR. Neurophysiological Biomarkers Informing the Clinical Neuroscience of Schizophrenia: Mismatch Negativity and Prepulse Inhibition of Startle. Current topics in behavioral neurosciences. 2014 doi: 10.1007/7854_2014_316. [DOI] [PMC free article] [PubMed] [Google Scholar]
- Light GA, Swerdlow NR, Braff DL. Preattentive sensory processing as indexed by the MMN and P3a brain responses is associated with cognitive and psychosocial functioning in healthy adults. Journal of Cognitive Neuroscience. 2007;19(10):1624–1632. doi: 10.1162/jocn.2007.19.10.1624. [DOI] [PMC free article] [PubMed] [Google Scholar]
- Light GA, Swerdlow NR, Rissling AJ, Radant A, Sugar CA, Sprock J, Pela M, Geyer MA, Braff DL. Characterization of neurophysiologic and neurocognitive biomarkers for use in genomic and clinical outcome studies of schizophrenia. PloS one. 2012;7(7):e39434. doi: 10.1371/journal.pone.0039434. [DOI] [PMC free article] [PubMed] [Google Scholar]
- Light GA, Williams LE, Minow F, Sprock J, Rissling A, Sharp R, Swerdlow NR, Braff DL. Electroencephalography (EEG) and event-related potentials (ERPs) with human participants. In: Crawley Jacqueline N, et al., editors. Current protocols in neuroscience / editorial board. Unit 6. Chapter 6. 2010. pp. 25pp. 21–24. [DOI] [PMC free article] [PubMed] [Google Scholar]
- Martin LF, Davalos DB, Kisley MA. Nicotine enhances automatic temporal processing as measured by the mismatch negativity waveform. Nicotine & tobacco research : official journal of the Society for Research on Nicotine and Tobacco. 2009;11(6):698–706. doi: 10.1093/ntr/ntp052. [DOI] [PubMed] [Google Scholar]
- Maxwell ME. Manual for the FIGS. Bethesda (MD): Clinical Neurogenetics Branch, National Institute of Mental Health; 1992. [Google Scholar]
- McPheeters HL. Statewide mental health outcome evaluation: a perspective of two southern states. Community Mental Health Journal. 1984;20(1):44–55. doi: 10.1007/BF00754103. [DOI] [PubMed] [Google Scholar]
- Michie P, Innes-Brown H, Todd J, Jablensky A. Duration mismatch negativity in biological relatives of patients with schizophrenia spectrum disorders. Biol Psychiatry. 2002;52(7):749–758. doi: 10.1016/s0006-3223(02)01379-3. [DOI] [PubMed] [Google Scholar]
- Michie PT. What has MMN revealed about the auditory system in schizophrenia? Int J Psychophysiol. 2001;42(2):177–194. doi: 10.1016/s0167-8760(01)00166-0. [DOI] [PubMed] [Google Scholar]
- Naatanen R. Attention and Brain Function. Lawrence Erlbaum Associates, Inc; Hillsdale, NJ: 1992. [Google Scholar]
- Näätänen R. The role of attention in auditory information processing as revealed by event-related potentials and other brain measures of cognitive function. Behavioral and Brain Sciences. 1990;13(02):201–233. [Google Scholar]
- Naatanen R, Paavilainen P, Alho K, Reinikainen K, Sams M. Do event-related potentials reveal the mechanism of the auditory sensory memory in the human brain? Neurosci Lett. 1989;98(2):217–221. doi: 10.1016/0304-3940(89)90513-2. [DOI] [PubMed] [Google Scholar]
- Nagai T, Tada M, Kirihara K, Araki T, Jinde S, Kasai K. Mismatch Negativity as a “Translatable” Brain Marker Toward Early Intervention for Psychosis: A Review. Frontiers in psychiatry. 2013a;4:115. doi: 10.3389/fpsyt.2013.00115. [DOI] [PMC free article] [PubMed] [Google Scholar]
- Nagai T, Tada M, Kirihara K, Yahata N, Hashimoto R, Araki T, Kasai K. Auditory mismatch negativity and P3a in response to duration and frequency changes in the early stages of psychosis. Schizophrenia research. 2013b;150(2):547–554. doi: 10.1016/j.schres.2013.08.005. [DOI] [PubMed] [Google Scholar]
- Nakamura T, Michie PT, Fulham WR, Todd J, Budd TW, Schall U, Hunter M, Hodgson DM. Epidural Auditory Event-Related Potentials in the Rat to Frequency and duration Deviants: Evidence of Mismatch Negativity? Frontiers in psychology. 2011;2:367. doi: 10.3389/fpsyg.2011.00367. [DOI] [PMC free article] [PubMed] [Google Scholar]
- Norman MA, Moore DJ, Taylor M, Franklin D, Jr, Cysique L, Ake C, Lazarretto D, Vaida F, Heaton RK, Group H. Demographically corrected norms for African Americans and Caucasians on the Hopkins Verbal Learning Test-Revised, Brief Visuospatial Memory Test-Revised, Stroop Color and Word Test, and Wisconsin Card Sorting Test 64-Card Version. Journal of clinical and experimental neuropsychology. 2011;33(7):793–804. doi: 10.1080/13803395.2011.559157. [DOI] [PMC free article] [PubMed] [Google Scholar]
- Oades RD, Wild-Wall N, Juran SA, Sachsse J, Oknina LB, Ropcke B. Auditory change detection in schizophrenia: sources of activity, related neuropsychological function and symptoms in patients with a first episode in adolescence, and patients 14 years after an adolescent illness-onset. BMC Psychiatry. 2006;6:7. doi: 10.1186/1471-244X-6-7. [DOI] [PMC free article] [PubMed] [Google Scholar]
- Oknina LB, Wild-Wall N, Oades RD, Juran SA, Ropcke B, Pfueller U, Weisbrod M, Chan E, Chen EY. Frontal and temporal sources of mismatch negativity in healthy controls, patients at onset of schizophrenia in adolescence and others at 15 years after onset. Schizophrenia research. 2005;76(1):25–41. doi: 10.1016/j.schres.2004.10.003. [DOI] [PubMed] [Google Scholar]
- Patterson TL, Goldman S, McKibbin CL, Hughs T, Jeste DV. UCSD Performance-Based Skills Assessment: development of a new measure of everyday functioning for severely mentally ill adults. Schizophr Bull. 2001;27(2):235–245. doi: 10.1093/oxfordjournals.schbul.a006870. [DOI] [PubMed] [Google Scholar]
- Perez VB, Swerdlow NR, Braff DL, Näätänen R. Using biomarkers to inform diagnosis, guide treatments and track response to interventions in psychotic illnesses. Biomarkers Med. 2014a;8(1):9–14. doi: 10.2217/bmm.13.133. [DOI] [PMC free article] [PubMed] [Google Scholar]
- Perez VB, Woods SW, Roach BJ, Ford JM, McGlashan TH, Srihari VH, Mathalon DH. Automatic auditory processing deficits in schizophrenia and clinical high-risk patients: forecasting psychosis risk with mismatch negativity. Biol Psychiatry. 2014b;75(6):459–469. doi: 10.1016/j.biopsych.2013.07.038. [DOI] [PMC free article] [PubMed] [Google Scholar]
- Preskorn SH, Gawryl M, Dgetluck N, Palfreyman M, Bauer LO, Hilt DC. Normalizing effects of EVP-6124, an alpha-7 nicotinic partial agonist, on event-related potentials and cognition: a proof of concept, randomized trial in patients with schizophrenia. Journal of psychiatric practice. 2014;20(1):12–24. doi: 10.1097/01.pra.0000442935.15833.c5. [DOI] [PubMed] [Google Scholar]
- Price GW, Michie PT, Johnston J, Innes-Brown H, Kent A, Clissa P, Jablensky AV. A multivariate electrophysiological endophenotype, from a unitary cohort, shows greater research utility than any single feature in the Western Australian family study of schizophrenia. Biol Psychiatry. 2006;60(1):1–10. doi: 10.1016/j.biopsych.2005.09.010. [DOI] [PubMed] [Google Scholar]
- Rapaport MH, Bazzetta J, McAdams LA, Patterson T, Jeste DV. Validation of the Scale of Functioning in older outpatients with schizophrenia. The American Journal of Geriatric Psychiatry. 1996;4(3):218–228. doi: 10.1097/00019442-199622430-00005. [DOI] [PubMed] [Google Scholar]
- Rissling AJ, Braff DL, Swerdlow NR, Hellemann G, Rassovsky Y, Sprock J, Pela M, Light GA. Disentangling early sensory information processing deficits in schizophrenia. Clinical Neurophysiology. 2012 doi: 10.1016/j.clinph.2012.02.079. [DOI] [PMC free article] [PubMed] [Google Scholar]
- Rissling AJ, Makeig S, Braff DL, Light GA. Neurophysiologic markers of abnormal brain activity in schizophrenia. Current psychiatry reports. 2010;12(6):572–578. doi: 10.1007/s11920-010-0149-z. [DOI] [PMC free article] [PubMed] [Google Scholar]
- Rissling AJ, Miyakoshi M, Sugar CA, Braff DL, Makeig S, Light GA. Cortical substrates and functional correlates of auditory deviance processing deficits in schizophrenia. NeuroImage: Clinical. doi: 10.1016/j.nicl.2014.09.006. in press. [DOI] [PMC free article] [PubMed] [Google Scholar]
- Rissling AJ, Park S-H, Young JW, Rissling MB, Sugar CA, Sprock J, Mathias DJ, Pela M, Sharp RF, Braff DL. Demand and modality of directed attention modulate “pre-attentive” sensory processes in schizophrenia patients and nonpsychiatric controls. Schizophrenia research. 2013a doi: 10.1016/j.schres.2013.01.035. [DOI] [PMC free article] [PubMed] [Google Scholar]
- Rissling AJ, Park SH, Young JW, Rissling MB, Sugar CA, Sprock J, Mathias DJ, Pela M, Sharp RF, Braff DL, Light GA. Demand and modality of directed attention modulate “pre-attentive” sensory processes in schizophrenia patients and nonpsychiatric controls. Schizophrenia research. 2013b;146(1–3):326–335. doi: 10.1016/j.schres.2013.01.035. [DOI] [PMC free article] [PubMed] [Google Scholar]
- Salisbury DF, Shenton ME, Griggs CB, Bonner-Jackson A, McCarley RW. Mismatch negativity in chronic schizophrenia and first-episode schizophrenia. Archives of general psychiatry. 2002;59(8):686–694. doi: 10.1001/archpsyc.59.8.686. [DOI] [PubMed] [Google Scholar]
- Schreiber H, Stolz-Born G, Kornhuber HH, Born J. Event-related potential correlates of impaired selective attention in children at high risk for schizophrenia. Biological Psychiatry. 1992;32(8):634–651. doi: 10.1016/0006-3223(92)90294-a. [DOI] [PubMed] [Google Scholar]
- Shelley AM, Ward PB, Catts SV, Michie PT, Andrews S, McConaghy N. Mismatch negativity: an index of a preattentive processing deficit in schizophrenia. Biol Psychiatry. 1991;30:1059–1062. doi: 10.1016/0006-3223(91)90126-7. [DOI] [PubMed] [Google Scholar]
- Shinozaki N, Yabe H, Sato Y, Hiruma T, Sutoh T, Nashida T, Matsuoka T, Kaneko S. The difference in Mismatch negativity between the acute and post-acute phase of schizophrenia. Biological psychology. 2002;59(2):105–119. doi: 10.1016/s0301-0511(01)00129-6. [DOI] [PubMed] [Google Scholar]
- Swerdlow NR, Gur R, Braff DL. Consortium on the Genetics of Schizophrenia (COGS) Assessment of Endophenotypes for Schizophrenia: An Introduction to this Special Issue of Schizophrenia Research. Schizophrenia research. doi: 10.1016/j.schres.2014.09.047. in press. [DOI] [PMC free article] [PubMed] [Google Scholar]
- Swerdlow NR, Light GA, Sprock J, Calkins ME, Green MF, Greenwood TA, Gur RE, Gur RC, Lazzeroni LC, Nuechterlein KH, Radant AD, Ray A, Seidman LJ, Siever LJ, Silverman JM, Stone WS, Sugar CA, Tsuang DW, Tsuang MT, Turetsky BI, Braff DL. Deficient prepulse inhibition in schizophrenia detected by the multi-site COGS. Schizophrenia research. 2014;152(2–3):503–512. doi: 10.1016/j.schres.2013.12.004. [DOI] [PMC free article] [PubMed] [Google Scholar]
- Takahashi H, Rissling AJ, Pascual-Marqui R, Kirihara K, Pela M, Sprock J, Braff DL, Light GA. Neural substrates of normal and impaired preattentive sensory discrimination in large cohorts of nonpsychiatric subjects and schizophrenia patients as indexed by MMN and P3a change detection responses. NeuroImage. 2012;66C:594–603. doi: 10.1016/j.neuroimage.2012.09.074. [DOI] [PMC free article] [PubMed] [Google Scholar]
- Umbricht D, Koller R, Vollenweider FX, Schmid L. Mismatch negativity predicts psychotic experiences induced by NMDA receptor antagonist in healthy volunteers. Biol Psychiatry. 2002;51(5):400–406. doi: 10.1016/s0006-3223(01)01242-2. [DOI] [PubMed] [Google Scholar]
- Umbricht D, Krljes S. Mismatch negativity in schizophrenia: a meta-analysis. Schizophrenia research. 2005;76(1):1–23. doi: 10.1016/j.schres.2004.12.002. [DOI] [PubMed] [Google Scholar]
- Umbricht D, Schmid L, Koller R, Vollenweider FX, Hell D, Javitt DC. Ketamine-induced deficits in auditory and visual context-dependent processing in healthy volunteers: implications for models of cognitive deficits in schizophrenia. Archives of general psychiatry. 2000;57(12):1139–1147. doi: 10.1001/archpsyc.57.12.1139. [DOI] [PubMed] [Google Scholar]
- Umbricht DS, Bates JA, Lieberman JA, Kane JM, Javitt DC. Electrophysiological indices of automatic and controlled auditory information processing in first-episode, recent-onset and chronic schizophrenia. Biol Psychiatry. 2006;59(8):762–772. doi: 10.1016/j.biopsych.2005.08.030. [DOI] [PubMed] [Google Scholar]