Abstract
Although reconstruction is often the primary choice of surgeons following an open tibial fracture, there is no evidence to support the long-term effectiveness of flap reconstruction over below-knee amputation. The aim of this study is to perform a decision analysis to evaluate treatment preferences for type IIIB and IIIC tibial fractures. Reconstructive microsurgeons, physical medicine physicians and patients with lower extremity trauma completed a web-based standard gamble utility survey to generate quality-adjusted life years (QALYs). Physicians assigned quite high utility values, and there was a slight preference for reconstruction over amputation, with a gain of only 0.55 QALY. Patients assigned significantly lower utility values and also favored reconstruction over amputation, but with a larger gain of 5.54 QALYs. The disparate utilities assigned by physicians and patients highlight the necessity of realistic discussion of outcomes, regardless of management methods.
Keywords: Decision analysis, lower leg trauma, utility, amputation, reconstruction
The management of open tibial fractures is complex. Tibial fractures are by far the most common open fracture encountered by physicians; they represent nearly 80% of open fractures.1 The most severe tibial fractures are type IIIB and IIIC fractures. These are fractures with exposed bone, extensive soft tissue loss, periosteal stripping and, in the case of IIIC fracture, arterial damage.2 These fractures can be managed by reconstruction or amputation. The decision regarding which option to choose can be difficult for both physicians and patients. Complicating this decision is the young age of many of the patients. The mean age of open tibial fracture patients is 43 years;1 these are patients who are still active professionally, with a long remaining working lifespan, and often have responsibilities for dependents. The functional and emotional implications of whichever management option is selected can have long-lasting consequences.
In the past, when there were few reliable options for lower limb reconstruction, amputation was the preferred choice because salvage attempts generally used skin grafting, which was inadequate to cover exposed bone.3 This resulted in high rates of osteomyelitis and secondary amputation.3 The advancement of microsurgical techniques allowed cooperative efforts between orthopedic and plastic surgeons to reconstruct severe open fractures and achieve predictable limb salvage.4,5 Most recently, wound care technology has further increased surgeons’ ability to treat open tibial fractures.3
Unfortunately, innovative technology and increased expertise in salvaging severely injured limbs have not substantially improved outcomes. Patients undergoing lower limb reconstruction endured more complications and incurred higher initial care-related costs.6–8 In addition, the functional and quality of life outcomes for reconstructed patients are similar to those who had primary amputation.9–11
Reconstruction is performed at a much higher rate than primary amputation, despite the lack of evidence indicating better outcomes associated with reconstruction.3 It is understandable that both physicians and patients will want to salvage an injured limb. Suffering a serious injury, like an open tibial facture, will have grave physical, emotional and financial consequences, regardless of the treatment method used. The choice of treatment ideally should be based on careful consideration of the available data, however, the overwhelming desire to save the leg, coupled with having the technology to achieve this aim, can cloud the decision-making process for both patients and surgeons.
Decision analysis is a powerful tool that can provide evidence when a randomized controlled trial is not practical or ethically feasible. Assigning utilities to these outcomes allows for the comparison and careful examination of complex situations that, otherwise, would be difficult to research. The specific aim of this project is to evaluate the utilities that reconstructive surgeons, physical medicine physicians and patients with type IIIB or IIIC tibial fractures assign to reconstructive surgery and amputation following type IIIB or IIIC tibial fractures.
Methods
Study Sample
A random sample of physicians was selected from the 2007 membership in the American Society for Reconstructive Microsurgery (ASRM). ASRM members were chosen because as reconstructive surgery has become more an integral part of open fracture treatment, these surgeons are gaining an intimate understanding of the outcomes following lower leg trauma.4,5 Members were numbered in alphabetical order and a random number generator was used to select a sample of 200 surgeons. After sample selection, we discovered that one prospective participant had died. We contacted a total of 199 surgeons to complete the survey. Because we were unable to receive permission from any of the national Physical Medicine and Rehabilitation societies, we sent survey invitations to all 38 faculty physicians and house officers associated with the Department of Physical Medicine and Rehabilitation (PM&R) at the University of Michigan Health System. Prospective participants were first contacted with a letter explaining the project, their eligibility and how they could participate. We included a $20 gasoline gift card as a token of appreciation. Letters were followed by two reminder emails.
Patients were recruited as part of a qualitative study of the lower extremity trauma experience. Forty-eight patients who had type IIIB or IIIC fractures treated at the University of Michigan between 1997 and 2007 were contacted via mail to explain the project and provide information on how to participate. One reminder letter was sent. The survey was self-administered by patients following an interview about their lower limb injury and recovery. Patients were given $100 grocery gift cards for their time. This study was approved by the University of Michigan Institutional Review Board.
Survey Design
A web-based anonymous survey was created using Zoomerang.com, an online service to create and conduct surveys. The survey too approximately 15 minutes to complete and included 8 standard gamble scenarios. This survey was constructed based on our prior experiences with utility surveys12,13 and was pilot tested multiple times to ensure completeness and clarity of the survey items. The standard gamble method is based on von Neumann and Morgenstern’s utility theory, which states that by asking a participant to compare a variety of events each with varying levels of certainty, it is then possible to mathematically rank those events in order of the participant’s preference.14 This allows investigators to elicit preferences for complex issues that would normally be hard for participants to compare.
In a standard gamble survey, the participant is offered a choice between living in a particular health state (State A) with certainty or taking a gamble on treatment (Treatment B) which provides a chance of complete cure, but is also associated with a risk of immediate death.14,15 The amount of risk involved with Treatment B is varied until participants feel that State A and the risk of death associated with Treatment B are equal.14,15 For instance, the risk involved with Treatment B may be 1% death (99% cure). The participant now must balance the desire to avoid State A with the risk of death involved with Treatment B. Clearly, the more undesirable State A is, the more risk a participant is willing to endure. But if the participant feels that State A is not particularly objectionable, he/she may feel that any more than a 1% risk of death is not worth it. In this case the participant would select, “Too hard to choose between the two.” This point of indifference, in which State A and the risk of death involved with Treatment B are the same to the participant, is used to determine the utility for State A. In this example, the participant’s utility for State A is 0.99, or nearly the same as perfect health (utility=1.0).
On the other hand, if the participant feels strongly about avoiding State A, he/she may choose to gamble on Treatment B. The next scenario would then offer an increased risk, say 5% death (95% cure). If the participant keeps choosing to gamble on Treatment B, the risk of death will be increased until the indifference point is reached. The lower the risk of complete cure when this point is reached, the lower the utility that will be assigned to State A. Lower utility indicates that the participant feels that the health state in question is further from perfect health, or closer to death (utility=0). The standard gamble technique is particularly well-suited to objectively study the difficult treatment choices that are faced with a type IIIB or IIIC tibial fracture, because unlike other utility elicitation methods, the uncertainty of the outcome is included in the scenarios.16
Our survey begins with brief explanation of the standard gamble concept. An animated explanation with audio instructions is available to participants to ensure that the participant has a complete understanding of the survey methodology (The video can be accessed at http://www-personal.umich.edu/~dsaddawi/le_survey/explanation.html). The participants are presented with a simple sample scenario in which they are asked to choose between permanent blindness and death. A brief vignette instructs the participant to imagine that he/she has become permanently blind, and that his/her physician has offered a magic pill that could potentially cure the blindness. However, this magic pill carries with it a certain risk of sudden, painless death. The participant can choose to take the pill, remain blind or say that it is too difficult to choose between the two. The amount of risk (percent chance of death) is altered until the participant can no longer choose between the two. This point is the participant’s utility for permanent blindness.
Following the sample scenario, a brief explanation of type IIIB and IIIC tibial fractures is presented, followed by the possible outcomes after this injury. Amputation without complications and reconstruction without complications are explained along with the length of initial hospital stay and time to full recovery. Possible complications of reconstruction (osteomyelitis, nonunion, flap failure and secondary amputation) and amputation (osteomyelitis and secondary revision) are presented and the effect of these complications on the overall recovery process is explained. After reviewing potential complications, participants are asked to select which complication they would least prefer, in other words, their worst-case scenario.
Utilities are elicited for the least-preferred complication in the same manner as the sample scenario, with the participant’s least-preferred complication in place of blindness. The participant can either choose to take the magic pill and accept the risk of death, choose for his/her least-preferred complication to occur with certainty or say that it is too difficult to choose between the two. The risk of death is varied until the participant selects “Too hard to choose between the two.” This point represents this participant’s utility for the least-preferred state.
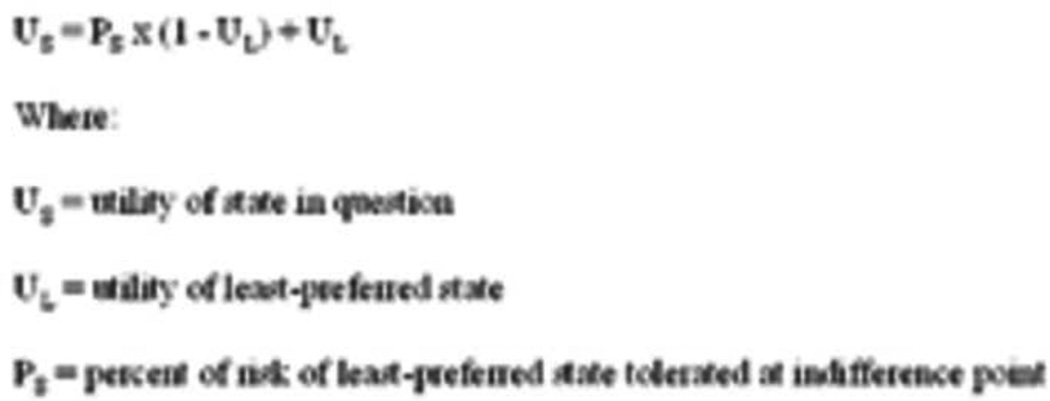
The utilities for the remaining 5 complication states, reconstruction without complications, and amputation without complications are elicited in a similar fashion, using the participant’s least-preferred complication state in the place of death. In other words, the participant can either choose to take the magic pill and accept the risk of his/her least-preferred complication, choose for the presented scenario to occur with certainty or say that it is too difficult to choose between the two. The point of indifference is used to calculate that participant’s utility for each of the other outcome states. (Figure 1) Appendices A, B and C give further example survey questions and responses.
Figure 1.
Equation for utility
Data Analysis
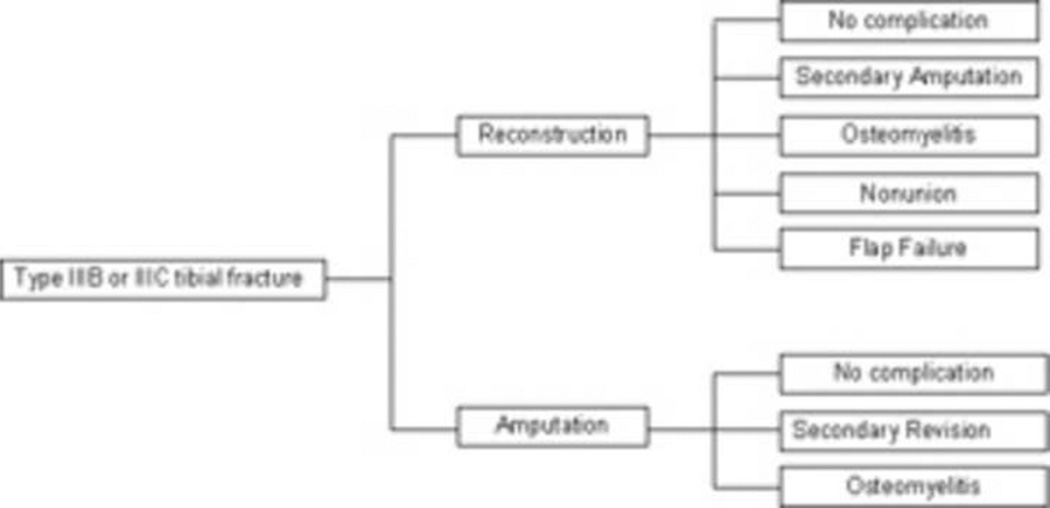
Data were analyzed using SAS 9.1 (SAS Institute, Cary, NC) statistical analysis software. Differences between the two recruitment groups were analyzed using non-parametric tests (the Wilcoxon-Mann-Whitney test and the Wilcoxon signed-rank test) and the Fisher’s exact test. Significance was set at p<0.05. A decision tree was created using TreeAge decision analysis software (TreeAge Pro Excel, Version 2008; TreeAge Software, Inc., Williamstown, Mass). The two main branches of the tree were the two possible treatment options for type IIIB and IIIC tibial fractures: reconstruction and amputation. The lesser branches showed the major complications of each of these procedures. (Figure 2) In order to keep the trees from becoming too unwieldy, two basic assumptions are introduced into decision analysis methodology. First, all outcomes are mutually exclusive and a patient can experience only one outcome. Secondly, each outcome has a definitive conclusion. For example, a patient who undergoes reconstruction can experience nonunion. After the nonunion is resolved, the patient will experience no other sequelae or additional complications.
Figure 2.
Type IIIB and IIIC tibial fracture decision tree structure
The use of quality-adjusted life years (QALYs) allows investigators to quantify not only the length of remaining life, but the quality of remaining life as well.17 We used the standard method for calculating QALYs, which considers time spent recovering from complications and the utility of those compilicaitons.18,19 (Figure 3) Complication times were calculated as a percentage of a year. For example, flap failure requires approximately 3 weeks of additional treatment. Therefore the complication time for flap failure is 3 weeks/52 weeks (1 year) = 0.058 years. Rates for each complication were provided by a systematic review of the literature.11 The average age of open tibial fracture patients is 42.8 years.1 Because this injury occurs overwhelmingly in males (76%),1 we used the National Vital Statistics Expectation of Life to established 35 years as the remaining years of life for males between age of 40 and 45.20
Figure 3.
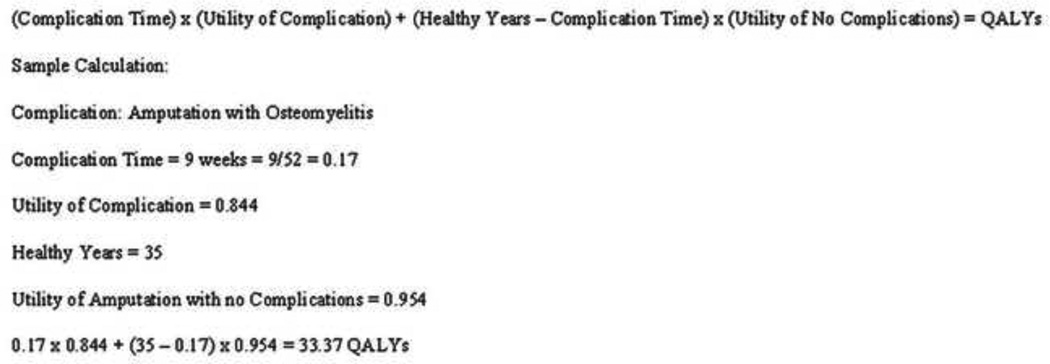
Equation for QALYs
By nature, the calculation of QALYs is inexact. Complication rates are only averages and remaining healthy years are based on large populations and are only estimates. A sensitivity analysis can be performed to vary the assumptions that are made in the model to assess the effects of change in any of the variable values. Sensitivity analysis is necessary to determine the robustness of the model.21 We varied the remaining healthy years to assess how well our model holds up to large changes of this variable.
Results
Survey Response Rate
Sixty-five physician comprised of 54 members of the American Society for Reconstructive Microsurgery (ASRM) (27%) and 11 physicians associated with the University of Michigan Department of Physical Medicine and Rehabilitation (PM&R) (29%) completed the entire survey. There was no statistical difference in the response rate between the two physician groups. The generalizability of any survey rests upon the degree to which the survey sample is representative of the entire population. It would be impossible to survey every member of ASRM. Because our sample was randomly selected, it is likely that the respondents represented the views of the population. Because of the anonymous nature of the survey we were not able to assess nonresponder bias in this study. The survey sample of physical medicine physicians is not ideal. However, we feel it is important to obtain the opinions of this specialty group. Physical medicine physicians are involved with patients in a very different way than surgeons by working with the patients’ to reintegrate them into society after surgery.
Twenty patients (42%) completed qualitative interviews and 18 of those patients completed the survey (90%).
Demographic Data
Physician demographic data are shown in Table 1. The sample was overwhelmingly male (91%), however, the PM&R sample had significantly more female physicians (p=0.03). The majority of the sample was plastic surgeons (68%); 68% of those sampled were affiliated with an academic institution, although this is skewed by the PM&R sample in which 100% of the sample had an academic affiliation. There was no significant differences in experience between the two groups.
Table 1.
Demographic Information
| Total (%) | ASRM (%) | PM&R (%) | ||
|---|---|---|---|---|
| n | 65 | 54 | 11 | |
| Specialty | ||||
| Plastic Surgery | 44 (68%) | 44 (81%) | -- | |
| Orthopedic Surgery | 8 (12%) | 8 (15%) | -- | |
| Physical Medicine | 11 (17%) | -- | 11 (100%) | |
| other | 2 (3%) | 2 (4%) | -- | |
| Experience | ||||
| 1–9 years | 25 (38%) | 19 (35%) | 6 (55%) | |
| 10–19 years | 21 (32%) | 19 (35%) | 2 (18%) | |
| 20–29 years | 15 (23%) | 13 (24%) | 2 (18%) | |
| 30+ years | 4 (6%) | 3 (6%) | 1 (9%) | |
| Practice Type | ||||
| Academic | 44 (68%) | 33 (61%) | 11 (100%) | |
| Solo practice | 10 (15%) | 10 (19%) | -- | |
| Single-specialty | 8 (12%) | 8 (15%) | -- | |
| Multi-specialty | 3 (5%) | 3 (6%) | -- | |
| Gender | ||||
| Male | 59 (91%) | 52 (96%) | 7 (64%) | |
| Female | 6 (9%) | 2 (4%) | 4 (36%) | |
Patient demographic data are shown in Table 2. Like in other studies of high-energy lower extremity trauma, our patient sample was largely male (78%).6,8,9 The majority of our patients were treated with reconstruction, with 22% requiring secondary amputation. The mean time since injury was 82 months (6.8 years).
Table 2.
Patient Demographic Information
| n | 18 | |
| Gender Distribution (M/F) | 14/4 | |
| Mean age (range) | 47 (23 – 68) | |
| Injury information | ||
| Fracture type | ||
| III-B | 12 | |
| III-C | 6 | |
| Treatment type | ||
| Reconstruction | 13 | |
| Secondary Amputation | 4 | |
| Primary Amputation | 5 | |
| Injury Cause | ||
| Motor vehicle accident | 11 | |
| Crush injury | 3 | |
| Fall from height | 2 | |
| Pedestrian hit by vehicle | 2 | |
| Mean follow-up time (range) | 82 months (28 – 144) | |
Utility Survey
Physicians assigned quite high utility values to all states. Only reconstruction with secondary amputation and amputation with osteomyelitis were given utilities below 0.96 (0.90 and 0.84, respectively). Unsurprisingly, the highest utility value was given to reconstruction without complications (0.98). When examined separately, the utilities assigned by ASRM members and PM&R physicians were virtually identical.
As is often the case,22 our patient population assigned lower utility to all conditions than did physicians. Mean utility values with p-values are presented in Table 3. Although the values were lower, patients also assigned the highest utility to reconstruction without complications (0.83) and the lowest utility to amputation with osteomyelitis (0.58). There was no relationship between the treatment patients received and utility assignment (p=0.63).
Table 3.
Mean utilities and QALYs
| Scenario | Physicians | Patients | |||
|---|---|---|---|---|---|
| Utility* | QALYs# | Utility* | QALYs# | p-value | |
| Reconstruction with no complications | 0.98 | 34.12 | 0.83 | 30.79 | <0.0001 |
| Reconstruction with secondary amputation | 0.90 | 31.55 | 0.70 | 25.84 | 0.0004 |
| Reconstruction with osteomyelitis | 0.97 | 34.12 | 0.72 | 30.77 | <0.0001 |
| Reconstruction with nonunion | 0.97 | 34.12 | 0.72 | 30.78 | <0.0001 |
| Reconstruction with flap failure | 0.96 | 34.12 | 0.70 | 30.79 | <0.0001 |
| Amputation with no complications | 0.97 | 33.39 | 0.67 | 24.89 | <0.0001 |
| Amputation with secondary revision | 0.96 | 33.39 | 0.70 | 24.90 | <0.0001 |
| Amputation with osteomyelitis | 0.84 | 33.37 | 0.58 | 24.88 | <0.0001 |
1.0 is perfect health
QALYs are based on 35 remaining healthy years
Decision Analytic Model
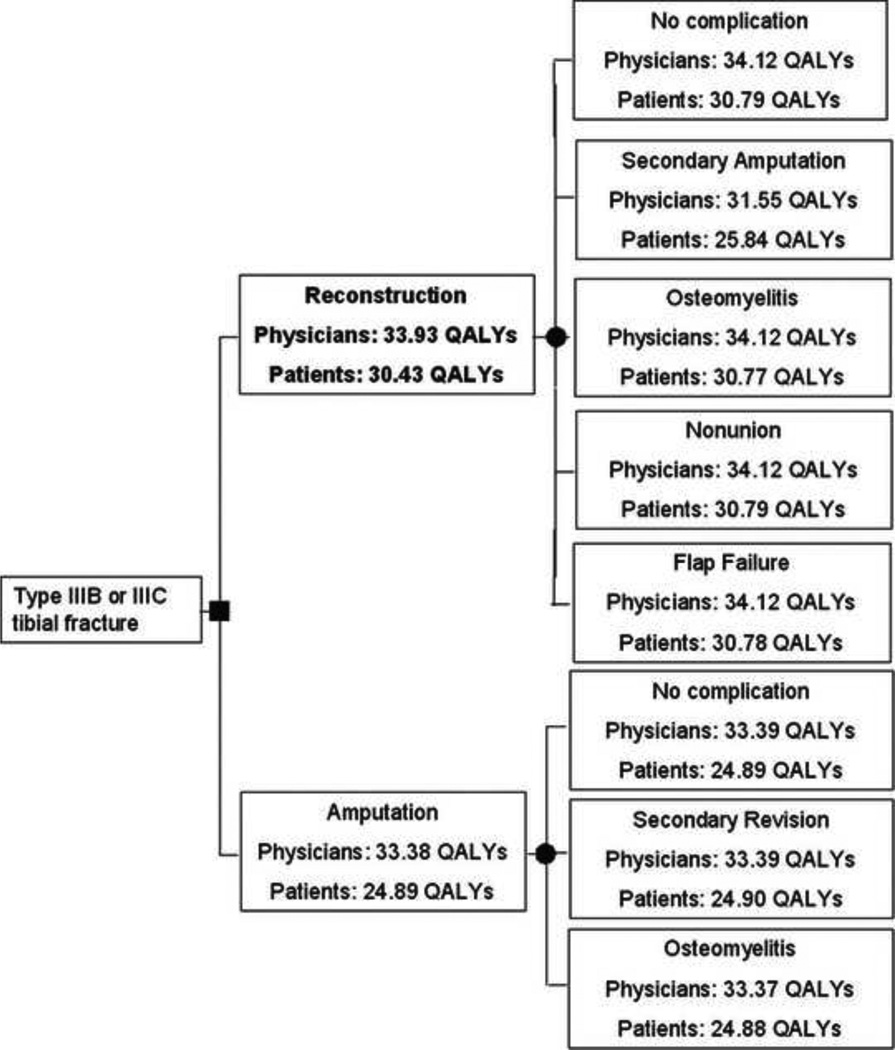
The decision tree shows that both physicians and patients find that reconstruction is preferable to primary amputation. (Figure 4) However, for physicians reconstruction is associated with a gain of only 0.55 QALY over amputation (33.93 vs. 33.38, p=0.67). For patients, reconstruction in associated a more substantial gain of 5.54 QALYs (30.43 vs. 24.89, p=0.02).
Figure 4.
Type IIIB and IIIC tibial fracture decision tree
Sensitivity Analysis
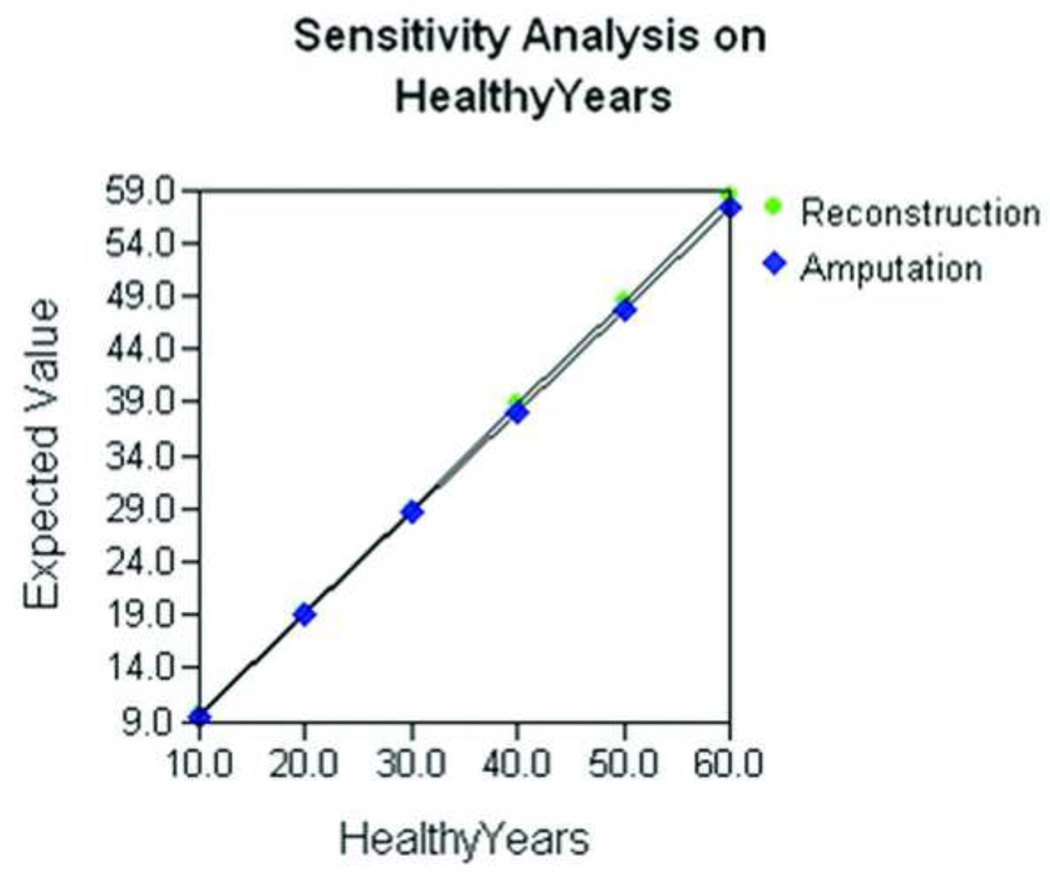
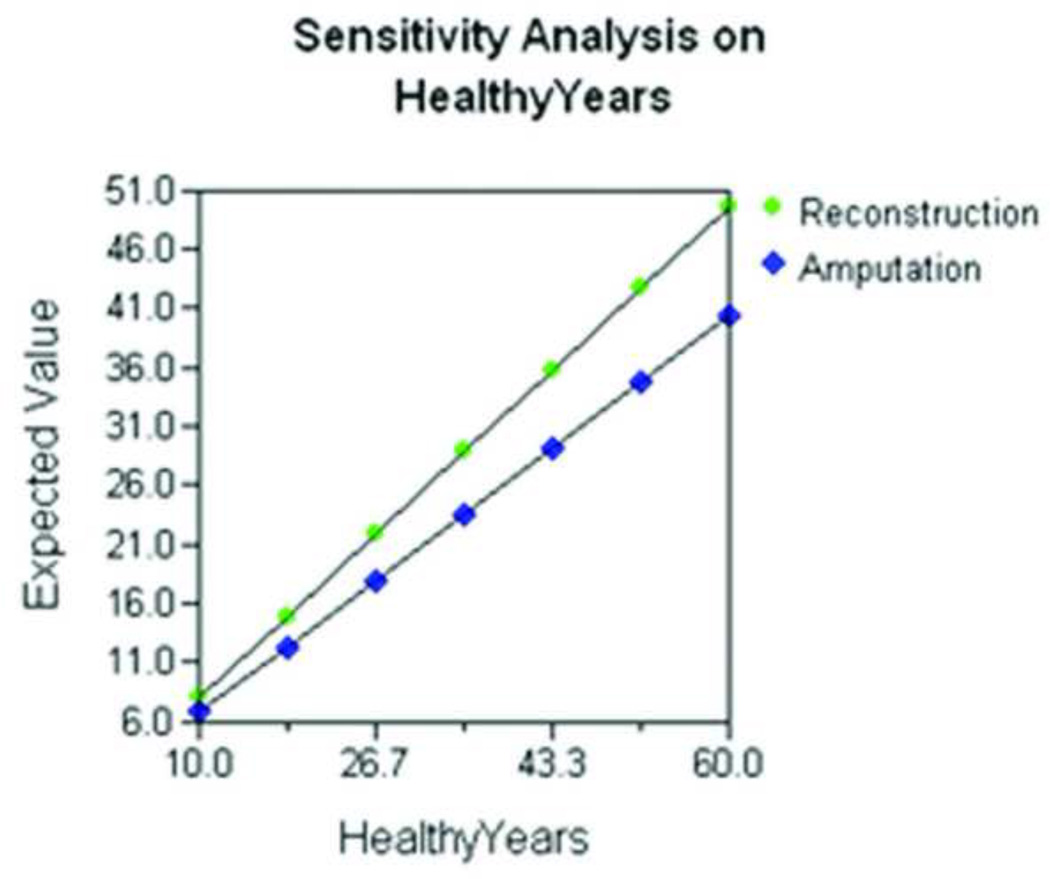
Sensitivity analyses were performed to assess the robustness of the model. In other words, the number of remaining years and complication rates were changed by including the extreme ranges of the estimates to gauge the effect on the outcomes. Increasing the number of healthy years remaining from 10 to 60 leads to a linear increase in expected QALYs. For physicians, reconstruction continues to garner just slightly more QALYs than amputation. (Figure 5) However, for patients, as the number of healthy years remaining increases, the number of QALYs gained by reconstruction over amputation increases. (Figure 6)
Figure 5.
Sensitivity analysis on healthy remaining years of life using physician-rated utilities
Figure 6.
Sensitivity analysis on healthy remaining years of life using patient-rated utilities
Discussion
Physicians treating severe tibia fractures assigned very similar QALYs for the two treatment options. However, patients who have experienced severe lower extremity trauma assigned more disparate values, favoring reconstruction. This is despite the fact that patients undergoing reconstruction can expect more operations and longer rehabilitation times, and experience similarly poor functional outcomes to patients who have primary amputation.7–9,23 A multi-center long-term prospective study found that after 2 years, only about half of the patients had returned to work and more than 40% had Sickness Impact Profile (SIP) scores that indicated severe disability.9 Seven years after injury, patients did not fare any better. Only 58% of patients had returned to work and nearly 50% had SIP scores indicating a severe disability.10,24 Furthermore about half of patients said that they felt “insecure in their social relations.”7
There is a good deal of research examining the outcomes of severe lower extremity injuries. Most notable is the Lower Extremity Assessment Project (LEAP), a multi-center prospective observation of patient suffering from high-energy lower extremity trauma admitted to 8 Level I trauma centers.25 The LEAP study has amassed over 600 patients and has examined functional outcomes, costs and quality of life with follow-up periods as long as to 7 years. This study has contributed an unprecedented amount of information to the literature.25 But despite this impressive body of knowledge, there is still no data to support a dominant treatment strategy.
Decision analyses, like the one we have performed, can help to fill in the gaps that previous outcomes studies have left open. Decision analysis provides a way to quantify preferences, and when it is evaluated in conjunction with cost data, this analytic tool may provide additional evidence for clinical decision-making. Decision analysis is ideal for severe tibial fractures, because it combines all possible outcomes and their associated risks, and forces the decision-maker to think more critically about the decision, rather than acting solely on intuition.26 This is especially important with emotional decisions, like the potential loss of a limb.
This study has several limitations. The assumptions inherent to the decision tree design assume that patients experience only one complication and that complications are mutually exclusive. Furthermore, the decision tree also assumes that each complication occurs for a defined period of time. With an injury as complex as type IIIB and IIIC tibial fractures, it is not unusual for patients to experience more than one complication, for example nonunion followed by secondary amputation, with several additional operations in between. Because these are flaws with all decision analyses, they do not hamper the validity of our model.
Our physician response rate was not as high as we would have hoped, despite the inclusion of a timely incentive. There are several reasons this may have been the case. First, physicians are a notoriously difficult population to survey, often leading to low response rates.27,28 Secondly, although our survey was conducted online, we wanted to provide a physical incentive to participants, thus our initial contact was done via postal mail. We followed this postal communication with an email containing a link to the survey website. Ideally, the email would arrive within a few days of receipt of the postal invitation. However, due to the mail delivery systems at some large institutions, mail can be delayed, meaning that some participants may have received the email before the incentive. This may have led to confusion for some respondents.
The patient response rate was also low, but this was not unexpected. Several factors may have contributed to this. First, patients were recruited to take the survey and participate in an open-ended interview concurrently. Patients may have been reluctant to volunteer to discuss their injury and recovery at length, and thus never had a chance to complete the survey. Secondly, because open tibial fractures are injuries that are often treated at a Level I trauma center, like our institution, many patients do not live nearby. Because the interviews were conducted in person, patients may have not wanted to drive a significant distance to participate in the study. Despite these low response rates, we are confident that our samples are generalizable to larger populations. Our patient sample was similar to those gathered for other studies6,8,9 and because the base sample of ASRM members was randomly selected, we have no reason to believe that surgeons who opted to participate would hold different beliefs than those who did not.
This study demonstrates that reconstructive surgeons and physical medicine physicians show a slight preference for the quality of life experienced after lower leg reconstruction over amputation after a severe open fracture of the tibia. However, this increase is not significant. This indicates that physicians tend to agree with the literature - there is no clear evidence that one management method is considerably better than the other. Patients, on the other hand, show a clear preference for reconstruction. This preference is something that physicians should keep in mind when counseling these patients through the difficult decision-making process.
None of the physician-rated complication states were associated with a loss of more than 4 QALYs. This may seem low, given that the injury can have such serious physical, emotional and financial tolls. But in fact, this is much higher than the loss of QALYs associated with other fractures. For instance, vertebral fracture without complication is associated with a loss of only 0.18 QALYs, while hip fracture is associated with a loss of only 0.16 QALYs.29 Furthermore, we see these results as an indication that, although reconstructive surgeons and physical medicine physicians know the long-lasting effects of this injury, they also feel that recovery of a near-normal life is possible.
Patients clearly feel differently. All of the patient-rated complication states represented a loss of at least 6.21 QALYs. Patients clearly believe that this injury has a significant impact on their lives. Physicians assigned utilities of 0.97 and 0.95 to reconstruction without complications and amputation without complications, respectively. This is nearing perfect health. Patients assigned utilities of 0.83 and 0.67, respectively, far from perfect health. Of course, it is understandable that physicians would not have an entirely accurate perception of life after a type IIIB or IIIC tibial fracture; they simply have not lived had to live with it. Physicians must be careful not to convey this overestimation to their patients.
This study is only the beginning of an in-depth exploration of this vexing topic. We have recently performed studies to both add cost information to our decision analysis30 and to qualitatively examine the patient perspective. By combining the perspectives of both physicians and patients with cost data, evidence may arise to better guide the treatment of this devastating injury
Supplementary Material
Acknowledgement
We appreciate the support from the National Endowment for Plastic Surgery and a National Institute of Arthritis and Musculoskeletal and Skin Diseases Midcareer Investigator Award in Patient-Oriented Research (K24 AR053120) (to Dr. Kevin C. Chung).
References
- 1.Court-Brown CM, Rimmer S, Prakash U, McQueen MM. The epidemiology of open long bone fractures. Injury. 1998;29(7):529–534. doi: 10.1016/s0020-1383(98)00125-9. [DOI] [PubMed] [Google Scholar]
- 2.Gustilo RB, Mendoza RM, Williams DN. Problems in the management of type III (severe) open fractures: a new classification of type III open fractures. J Trauma. 1984:2442–2446. doi: 10.1097/00005373-198408000-00009. [DOI] [PubMed] [Google Scholar]
- 3.Parrett BM, Matros E, Pribaz JJ, Orgill DP. Lower extremity trauma: trends in the management of soft-tissue reconstruction of open tibia-fibula fractures. Plast Reconstr Surg. 2006;117(4):1315–1322. doi: 10.1097/01.prs.0000204959.18136.36. [DOI] [PubMed] [Google Scholar]
- 4.Meyer M, Evans J. Joint orthopaedic and plastic surgery management of types III and IV lower limb injuries. Br J Plast Surg. 1990;43(6):692–694. doi: 10.1016/0007-1226(90)90191-2. [DOI] [PubMed] [Google Scholar]
- 5.Naique SB, Pearse M, Nanchahal J. Management of severe open tibial fractures: the need for combined orthopaedic and plastic surgical treatment in specialist centres. J Bone Joint Surg Br. 2006;88(3):351–357. doi: 10.1302/0301-620X.88B3.17120. [DOI] [PubMed] [Google Scholar]
- 6.Bondurant FJ, Cotler HB, Buckle R, Miller-Crotchett P, Browner BD. The medical and economic impact of severely injured lower extremities. J Trauma. 1988;28(8):1270–1273. doi: 10.1097/00005373-198808000-00023. [DOI] [PubMed] [Google Scholar]
- 7.Hertel R, Strebel N, Ganz R. Amputation versus reconstruction in traumatic defects of the leg: outcome and costs. J Orthop Trauma. 1996:10223–10229. doi: 10.1097/00005131-199605000-00001. [DOI] [PubMed] [Google Scholar]
- 8.Hoogendoorn JM, van der Werken C. Grade III open tibial fractures: functional outcome and quality of life in amputees versus patients with successful reconstruction. Injury. 2001;32(4):329–334. doi: 10.1016/s0020-1383(00)00250-3. [DOI] [PubMed] [Google Scholar]
- 9.Bosse MJ, MacKenzie EJ, Kellam JF, et al. An analysis of outcomes of reconstruction or amputation of leg-threatening injuries. N Engl J Med. 2002:3471924–3471931. doi: 10.1056/NEJMoa012604. [DOI] [PubMed] [Google Scholar]
- 10.MacKenzie EJ, Bosse MJ, Pollak AN, et al. Long-term persistence of disability following severe lower-limb trauma. Results of a seven-year follow-up. J Bone Joint Surg. 2005;87A(8):1801–1809. doi: 10.2106/JBJS.E.00032. [DOI] [PubMed] [Google Scholar]
- 11.Saddawi-Konefka D, Kim HM, Chung KC. A systematic review of outcomes and complications of reconstruction and amputation for type IIIB and IIIC fractures of the tibia. Plast Reconstr Surg. 2008;122(6):1796–1805. doi: 10.1097/PRS.0b013e31818d69c3. [DOI] [PMC free article] [PubMed] [Google Scholar]
- 12.Cavaliere C, Chung KC. A cost-utility analysis comparing total wrist fusion and total wrist arthroplasty for the rheumatoid wrist. J Hand Surg (A) doi: 10.1007/s11552-009-9194-7. In press. [DOI] [PMC free article] [PubMed] [Google Scholar]
- 13.Davis EN, Chung KC, Kotsis SV, Lau FH, Vijan S. A cost/utility analysis of open reduction and internal fixation versus cast immobilization for acute nondisplaced mid-waist scaphoid fractures. Plast Reconstr Surg. 2006;117(4):1223–1235. doi: 10.1097/01.prs.0000201461.71055.83. [DOI] [PubMed] [Google Scholar]
- 14.von Neumann J, Morgenstern O, editors. Theory of Games and Economic Behavior. 3rd ed. Princeton, NJ: Princeton University Press; 1953. [Google Scholar]
- 15.Feeny D, Torrance GW, Labelle R. Integrating economic evaluations and quality of life assessments. In: Spilker Be., editor. Quality of Life and Pharmacoeconomics in Clinical Trials. New York: Lippincott-Raven; 1996. [Google Scholar]
- 16.van Osch SM, Stiggelbout AM. The construction of standard gamble utilities. Health Econ. 2008;17(1):31–40. doi: 10.1002/hec.1235. [DOI] [PubMed] [Google Scholar]
- 17.Schwartz S, Richardson J, Glasziou PP. Quality-adjusted life years: origins, measurements, applications, objections. Aust J Public Health. 1993;17(3):272–278. doi: 10.1111/j.1753-6405.1993.tb00149.x. [DOI] [PubMed] [Google Scholar]
- 18.Naglie G, Krahn MD, Naimark D, Redelmeier DA, Detsky AS. Primer on medical decision analysis: Part 3--Estimating probabilities and utilities. Med Decis Making. 1997;17(2):136–141. doi: 10.1177/0272989X9701700203. [DOI] [PubMed] [Google Scholar]
- 19.Cugno S, Sprague S, Duku E, Thoma A. Composite tissue allotransplantation of the face: decision analysis model. Can J Plast Surg. 2007;15(3):145–152. doi: 10.1177/229255030701500304. [DOI] [PMC free article] [PubMed] [Google Scholar]
- 20.Arias E. United States life tables, 2003. National Vital Statistics Reports. 2006;54(14):1–3. [PubMed] [Google Scholar]
- 21.Roest FH, Eijkemans MJ, van der Donk J, et al. The use of confidence intervals for individual utilities: limits to formal decision analysis for treatment choice. Med Decis Making. 1997;17(3):285–291. doi: 10.1177/0272989X9701700304. [DOI] [PubMed] [Google Scholar]
- 22.Gold MR, Patrick DL, Torrance GW, et al. Identifying and valuing outcomes. In: Gold MR, Russell LB, Siegel JA, Weinstein MC, editors. Cost-Effectiveness in Health and Medicine. New York: Oxford Press; 1996. pp. 82–134. [Google Scholar]
- 23.MacKenzie EJ, Jones AS, Bosse MJ, et al. Health-care costs associated with amputation or reconstruction of a limb-threatening injury. J Bone Joint Surg Am. 2007;89(8):1685–1692. doi: 10.2106/JBJS.F.01350. [DOI] [PubMed] [Google Scholar]
- 24.MacKenzie EJ, Bosse MJ, Kellam JF, et al. Factors influencing the decision to amputate or reconstruct after high-energy lower extremity trauma. J Trauma. 2002;52(4):641–649. doi: 10.1097/00005373-200204000-00005. [DOI] [PubMed] [Google Scholar]
- 25.MacKenzie EJ, Bosse MJ, Kellam JF, et al. Characterization of patients with high-energy lower extremity trauma. J Orthop Trauma. 2000;14(7):455–466. doi: 10.1097/00005131-200009000-00001. [DOI] [PubMed] [Google Scholar]
- 26.Aleem IS, Karamlou T, Benson LN, McCrindle BW. Transcatheter device versus surgical closure of ventricular septal defects: a clinical decision analysis. Catheter Cardiovasc Interv. 2006;67(4):630–636. doi: 10.1002/ccd.20702. [DOI] [PubMed] [Google Scholar]
- 27.Braithwaite D, Emery J, De Lusignan S, Sutton S. Using the Internet to conduct surveys of health professionals: a valid alternative? Fam Pract. 2003;20(5):545–551. doi: 10.1093/fampra/cmg509. [DOI] [PubMed] [Google Scholar]
- 28.VanGeest JB, Johnson TP, Welch VL. Methodologies for improving response rates in surveys of physicians: a systematic review. Eval Health Prof. 2007;30(4):303–321. doi: 10.1177/0163278707307899. [DOI] [PubMed] [Google Scholar]
- 29.Tosteson AN, Gabriel SE, Grove MR, et al. Impact of hip and vertebral fractures on quality-adjusted life years. Osteoporos Int. 2001;12(12):1042–1049. doi: 10.1007/s001980170015. [DOI] [PubMed] [Google Scholar]
- 30.Chung KC, Saddawi-Konefka D, Shauver M, Haase SC. An economic analysis for the treatment of grade IIIB and C tibial fractures. Plast Reconstr Surg. in press. [Google Scholar]
Associated Data
This section collects any data citations, data availability statements, or supplementary materials included in this article.


