Abstract
Introduction:
Histopathological images have rich structural information, are multi-channel in nature and contain meaningful pathological information at various scales. Sophisticated image analysis tools that can automatically extract discriminative information from the histopathology image slides for diagnosis remain an area of significant research activity. In this work, we focus on automated brain cancer grading, specifically glioma grading. Grading of a glioma is a highly important problem in pathology and is largely done manually by medical experts based on an examination of pathology slides (images). To complement the efforts of clinicians engaged in brain cancer diagnosis, we develop novel image processing algorithms and systems to automatically grade glioma tumor into two categories: Low-grade glioma (LGG) and high-grade glioma (HGG) which represent a more advanced stage of the disease.
Results:
We propose novel image processing algorithms based on spatial domain analysis for glioma tumor grading that will complement the clinical interpretation of the tissue. The image processing techniques are developed in close collaboration with medical experts to mimic the visual cues that a clinician looks for in judging of the grade of the disease. Specifically, two algorithmic techniques are developed: (1) A cell segmentation and cell-count profile creation for identification of Pseudopalisading Necrosis, and (2) a customized operation of spatial and morphological filters to accurately identify microvascular proliferation (MVP). In both techniques, a hierarchical decision is made via a decision tree mechanism. If either Pseudopalisading Necrosis or MVP is found present in any part of the histopathology slide, the whole slide is identified as HGG, which is consistent with World Health Organization guidelines. Experimental results on the Cancer Genome Atlas database are presented in the form of: (1) Successful detection rates of pseudopalisading necrosis and MVP regions, (2) overall classification accuracy into LGG and HGG categories, and (3) receiver operating characteristic curves which can facilitate a desirable trade-off between HGG detection and false-alarm rates.
Conclusion:
The proposed method demonstrates fairly high accuracy and compares favorably against best-known alternatives such as the state-of-the-art WND-CHARM feature set provided by NIH combined with powerful support vector machine classifier. Our results reveal that the proposed method can be beneficial to a clinician in effectively separating histopathology slides into LGG and HGG categories, particularly where the analysis of a large number of slides is needed. Our work also reveals that MVP regions are much harder to detect than Pseudopalisading Necrosis and increasing accuracy of automated image processing for MVP detection emerges as a significant future research direction.
Keywords: Brain cancer, cell segmentation, computer-aided diagnosis, decision tree, glioblastoma multiforme, low-grade glioma, micro-vascular proliferation, morphological transformation, pathological grading, pseudopalisading necrosis, spatial analysis, spatial filters
INTRODUCTION
The advent of computer-aided diagnosis dates back to 1980s with the emergence of digital mammography.[1] Since then, many advances in automated image processing with applications in medical imaging have been developed. For instance, development of quantitative image analysis tools as a complement to the effort of pathologists is an active research direction.[2,3,4] There is an increasing need for automated diagnosis to assist the pathologist by differentiating obviously diseased cases from benign or negative ones. A potential benefit may be to allow the pathologist more time to focus on more complicated cases that are not as easily diagnosable.
Histopathological images provide an informative view of the underlying tissue since the structure of the tissue is preserved in the preparation process. Moreover, the diagnosis from histopathology images is considered to be the “gold standard” in diagnosing a large number of diseases including, but not limited to many types of cancer.[5]
Recent work has shown the necessity of quantitative analysis of histopathological images, specifically analysis of spatial structure of histopathology imagery. Structural analysis of these images can be tracked back to the work of Weind et al.[6] and Bartels et al.[7] and continued by Doyle et al.[8] who introduced graph-based features to exploit spatial structure inherent in images. Later, a hybrid classification method has been developed that combines structural and statistical information obtained from images.[9] Furthermore, histopathological databases are investigated using patch-based analysis methods to decompose whole slide images of histology sections into distinct patches for genomic data analysis.[10,11,12] Recently, Srinivas et al. used a simultaneous sparsity model for histopathological image representation and classification for the purpose of disease detection.[13,14]
While disease detection is a very challenging problem in histopathology, disease grading is critical to classifying various types of cancer.[8,15] In this paper, we address a disease grading problem in brain cancer through a customized development of quantitative algorithms rooted in spatial domain analysis. These algorithms are intended to assist the clinician who has already arrived at the diagnosis of glioma after reviewing the tumor sample. The grades of glioma that need to be distinguished from each other per World Health Organization (WHO) designations are low-grade glioma (LGG, WHO Grade II) and high-grade glioma (HGG, WHO Grade III or IV) which have some specific structural characteristics pertinent to each one, separately. Pathologists can generally discriminate WHO Grade I astrocytomas (Juvenile Pilocytic Astrocytomas) from the tumors that comprise WHO Grade II–IV gliomas. In order to assist the clinical determination of glioma grade, we propose an image processing method to locate these characteristics in the tissue image. Figures 1 and 2 show two examples of LGG and HGG whole slide tissues (on the left). On the right-hand side of these figures, we see a zoomed-in view of the underlying tissue. Tissue images illustrated in this paper are obtained from Lawrence Berkeley Lab website.[16]
Figure 1.
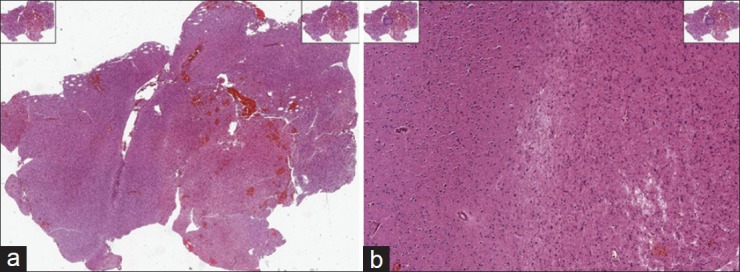
Example of high-grade glioma (HGG) whole slide images (a) and a zoomed in view of the HGG tissue (b)
Figure 2.
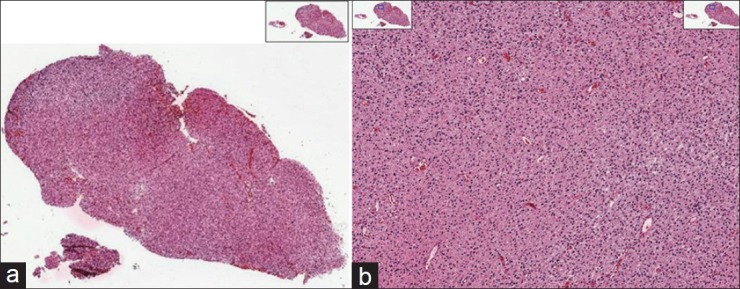
Example of low-grade glioma (LGG) whole slide images (a) and a zoomed in view of the LGG tissue (b)
High-grade gliomas include WHO grade III and grade IV tumors. Of these, the dominant histological types are anaplastic astrocytoma, anaplastic oligodendroglioma, and glioblastoma multiforme (GBM). GBM is the most aggressive type of brain tumor in glial cells with an incidence of 3.19/100,000 person-years in the United States and very poor overall survival rate.[17] HGGs are characterized by the presence of two main hallmarks.[18] The first one is the existence of areas of necrotizing cells surrounded by lined-up anaplastic cells called pseudopalisading necrosis (hereafter referred to as necrosis). The second characteristic is the presence of proliferation of enlarged blood vessels in the tissue which is known as microvascular proliferation (MVP).
Necrosis forms because the tumor outpaces its blood supply as the tumor grows. As a result, cells in that particular area cannot survive, leaving behind an area devoid of cells which becomes enveloped by tumor cells in a radial manner. Figure 3a shows a representation of this phenomenon. The center of the image shown in this figure corresponds to the area devoid of cells, and this area runs sidelong across the tissue. Tumor cells surround this area and can be detected by their lined-up structure. In fact, tumor cells arranging themselves radially around a cell-devoid area are known as pseudopalisades.[19,20] The presence of necrosis region within the tissue immediately implies that the tissue belongs to a HGG case.
Figure 3.

Example images of brain tissue (a) low-grade glioma, (b) necrosis region and (c) microvascular proliferation as two main hallmarks of high-grade glioma
On the other hand, MVP results from the development of new blood vessels within a tumor due to the increased demand of blood by cancerous cells.[17,21] As this occurs, tumor cells surround the blood vessels, and the blood vessels form multiple endothelial layers. Figure 3b shows a tissue region containing multiple MVP regions. As one can see, the MVP regions are darker in color due to H and E staining method. As a consequence of MVP manifestation in the tissue, it is classified as HGG.
In contrast to HGG, LGG refers to a tumor that is hypercellular due to neoplastic cell proliferation relative to normal brain but lacks MVP or necrosis. In Figure 3c, an example of a portion of LGG tissue is shown.
From an image understanding standpoint, the image shown in Figure 3c has two structural and spatial characteristics. A visual smoothness can be seen by the pinkish color throughout the image background, and the cells (represented by blue dots) are spread evenly throughout the tissue. In addition to these two characteristics, absence of necrosis region or MVP indicates a low-grade tumor type. This is vastly different than HGG, which contains one or more necrosis or MVP regions or both.
Main Contributions
The main contributions of this paper are:
Development of an automated cancer grading system for classifying HGG and LGG types via image analysis of the digital histopathology slides. This algorithm is designed to complement the clinical interpretation of diseased tissue in which the underlying diagnosis of glioma has already been made
The development of novel, customized image features for accurately identifying MVP and necrosis regions based on spatial domain processing and morphological transforms. While necrosis region identification in histopathology images has been studied in recent work,[10,11] to the best of our knowledge, ours is one of the earliest attempts to characterize MVP regions
A new hierarchical mechanism inspired by clinician assessment of tissue imagery which involves: (1) A “big picture” analysis of the structural information in a tissue followed by (2) a “detailed” decision tree mechanism which makes the final determination of whether the region is necrotic, has MVP or neither.
Extensive experimental validation on the well-known the Cancer Genome Atlas (TCGA) database which contains labeled LGG and HGG image data of brain tissue. Favorable comparisons are shown against state-of-the-art image classification toolkits such as the NIH WND-CHARM.
MATERIALS AND METHODS
The presence of either Necrosis or MVP forms a definite indicator of HGG. In this section, we develop a set of analytical methods that can automatically find and identify necrosis and MVP regions from an analysis of the tissue images. For each histopathology slide image, a set of smaller sub-images known as regions of interest (ROI) is first extracted from the whole slide image and fed to necrosis and MVP detection algorithms below. These ROIs can be extracted manually/automatically by tiling the tissue image carefully or by using a random tiling of overlapping rectangular regions. However, blank regions surrounding the tissue specimen as well as artifacts such as tissue folds and pen marks, used by pathologists while they were studying the slide, can cause unexpected results. As a result, we extracted ROIs from the whole slide images in order to avoid selection of these regions.[13,22]
Necrosis
In this part, we propose a method to identify necrosis regions within a tissue image by trying to simulate the visual appearances of necrosis regions within tissue. A necrosis region typically involves a large number of lined-up cells that form a ring around the area which is devoid of viable cells. The essence of our method lies in cell segmentation, followed by creation of a “cell-count profile” which is subsequently used for necrosis detection. A step-by-step description of our algorithmic procedure is provided as a flowchart in Figure 6 under “Necrosis Detection.” The algorithm has two major steps: First, using a cell segmentation and a cell count profile, we investigate the whole image and find candidate regions that may exhibit necrosis. This step can be seen as an overall investigation of the tissue or a “big picture” analysis. The candidates’ regions found are then passed on to the decision stage where detailed investigation of the region is performed to verify the presence or absence of necrosis.
Figure 6.
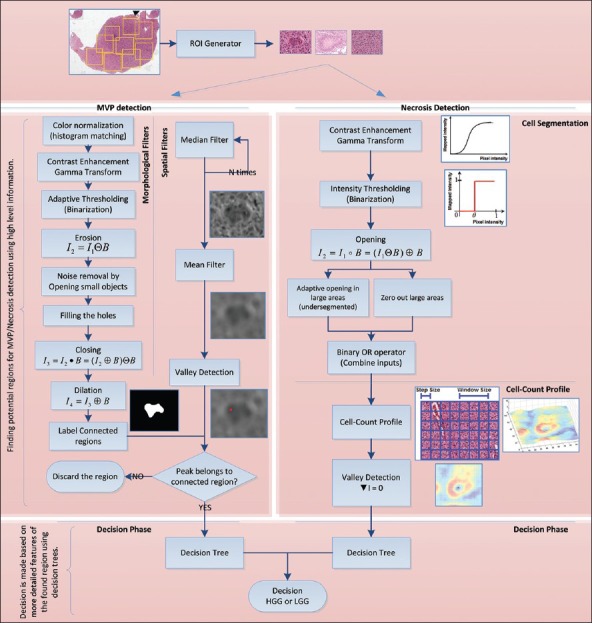
Pipeline of procedures for each method
Cell Segmentation
Automated cell segmentation in histopathology is generally difficult due to the large variability in images (different microscopes, stains, cell types, cell densities, etc). However, the vast majority of cell segmentation methods are based on intensity thresholding, feature detection, morphological filtering, and region accumulation.[23] Our cell segmentation method is based on the combination of intensity thresholding and a sequence of morphological filtering operations. We perform an adaptive intensity thresholding on increased-contrast image (by gamma transform) and then apply a sequence of adaptive opening operators on the binary image to reduce the noise in the binary image and also enhance the segmented image by overcoming the under-segmentation problem.
In Figure 4a, we demonstrate an example of an ROI containing a Necrosis region. We use our segmentation technique and obtain Figure 4b which is the segmented image in binary format. In the binary image, cells can be seen as white blobs while the black region corresponds to background non-cell region.
Figure 4.
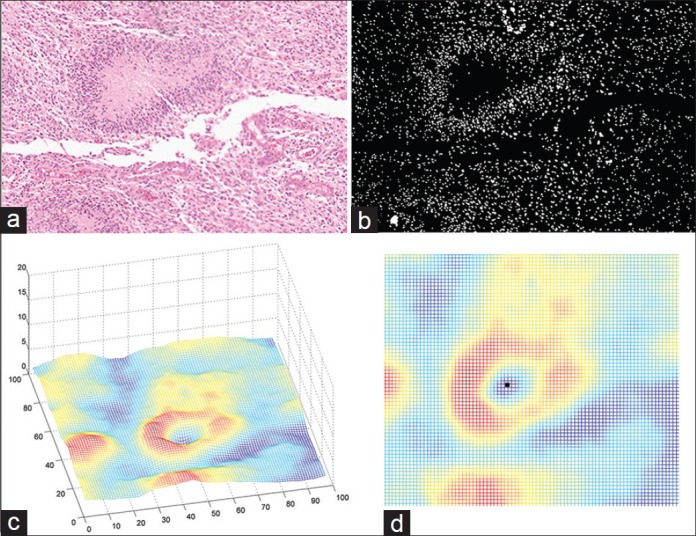
An example of flow of procedures in Necrosis detection algorithm. (a) Region of interest (b) Segmented image (c) Cell-count profile obtained from segmented image (d) Horizontal view of cell-count profile
Cell-count Profile
The next step is to find a cell-count profile from the segmented image. In order to obtain such a profile, we perform a cell counting on a fixed-size window on the segmented image and roll over the window around the image with a fixed step size to find the number of cells in each window. A profile generated by this algorithm from analyzing Figure 4b is shown in Figure 4c. Experimentally, we chose a window size to be 50 pixels and step size as 30 pixels.
Decision Tree
In Figure 4c, the area of dead cells with increased cellularity around corresponds to the blue “valley” in the center surrounded by red high altitudes (“peaks”). Our algorithm searches for such structure throughout the tissue by finding the local minima in the cell-count profile. An example of local minima is illustrated in Figure 4d. Once such a pattern is found, it is marked as a potential candidate for Necrosis. We use a hierarchical decision structure via a “Decision Tree” to further validate if the pattern corresponds to a necrosis region. The usage of the decision tree allows for transparency in the decision-making process and is particularly helpful to a clinician when providing an informed decision. The structure (topology) of the tree is based on domain knowledge and clinician input. This structure is illustrated in Figure 7a. Each region that has been found from the cell-count profile and valley detection is processed via the tree. On each node of the tree a case-specific criterion is checked and based on the result, we proceed to the next level of the tree. These criteria are as follows: Number of cells inside dead region, number of cells around dead region on the peaks, ratio of the two numbers, area of the dead region, etc., As can be seen from Figure 7a, there are some design-specific parameters, t1., t5, that are learned using the training (see section Training vs. Test) and also based on the inputs from the clinician to obtain the best results. Once the decision tree confirms the ROI to be necrotic, the histopathology image is identified as HGG.
Figure 7.
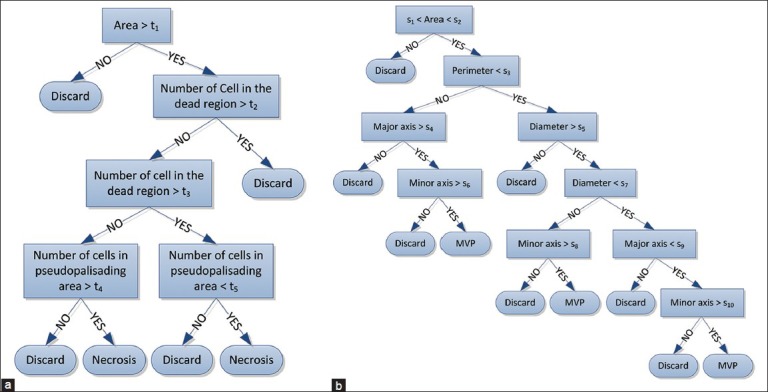
Decision Trees (a) Necrosis Decision Tree (b) MVP Decision Tree
Microvascular Proliferation
Another phenotypic hallmark to identify a case as HGG is the presence of MVP, which is essentially an increased number of hypertrophic endothelial cells in tumorous tissue. An MVP region is characterized by the presence of hypertrophic endothelial cells in the tissue with different color shading and thick layers of cell rings inside the vessel. Therefore, we propose an algorithm that can automatically capture the same characteristics through a set of spatial and morphological filters. A detailed explanation of each piece is given below and is summarized in Figure 6 under “MVP detection.” Similar to Necrosis detection, MVP detection algorithm also has two major steps: First, a “big picture” analysis is made by using morphological and spatial domain information to investigate the whole image and find candidate MVP regions. Any candidate who is found will be passed on to the decision stage for further investigation and to verify the presence or absence of MVP. A more detailed explanation follows.
Spatial and Morphological Transforms
We propose to apply a set of morphological and spatial filters to find and identify MVP regions within the tissue. The motivation for applying spatial filters is to enhance MVP regions within the image while at the same time blend-in non-MVP regions, whereas morphological transformations are applied to accurately find and label regions correspond to MVP. To achieve these goals, we first make use of order statistics filters such as the median filter and filter the input ROI image, recursively. Then, we apply mean filter to obtain a smooth image. This procedure makes the non-MVP regions to blend in and pronounce MVP regions as was desired. In the next step, because of color differences between MVP regions and non-MVP regions we desire to have different color shadings in the smoothed image such that MVP regions have darker pixel intensities and non-MVP regions are relatively brighter. This motivates us to find the points within the ROI that have relatively lower pixel intensity by applying a local minima finder (“valley detection”) throughout the filtered image. We define these lower intensity regions (darker areas) to be a “valley” surrounded by brighter pixel intensity regions. Hence, the problem of finding potential MVP regions reduces to first identifying “valleys.”
In parallel to these spatial filters, a sequence of morphological transformations[24,25] is applied on the input ROI to find areas of potential MVP. This sequence of filters is shown in Figure 6, and their output will be a binary image that segments the regions in the image that have a similar structure. These regions are then verified to be potential MVP regions by checking whether the “valley” obtained from spatial filters lies inside the region or not. An example of how these procedures can help is shown in Figure 5 for a small sample ROI. As it can be seen from the Figure, the valley detected lies inside segmented region and will be considered to be a potential MVP.
Figure 5.
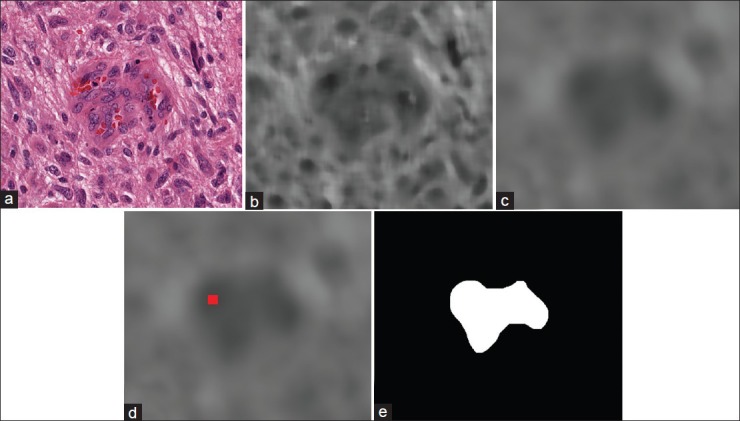
An example of flow of procedures for MVP detection algorithm on a small ROI. (a) sample ROI (b) The output image after applying median filter (c) filtered image by mean filter (d) detected valley in the image showed as a red dot (e) segmented potential MVP region
Decision Tree
We further investigate the potential MVP regions (white region) in the binary image as a possible MVP to determine whether it indeed corresponds to an MVP region or not. Similar to Necrosis detection, this is done by a “Decision Tree” structure based on the features extracted from white region [Figure 5e] as a possible MVP. Again, this tree is built based on our prior knowledge of the problem and is inspired by the clinician input. The potential MVP regions found in the previous step are passed on to the decision tree to obtain the final decision. The structure of the decision tree is depicted in Figure 7b. On each node of the tree, a set of specific criteria is checked which are mainly based on the following measurements: Equivalent diameter of the region, area of the region, perimeter, major axis length, etc., Likewise, Necrosis detection, design parameters (s1,…, s10) are optimized in training (see section Training vs. Test). Eventually, once it is confirmed from the decision tree that potential region is indeed an MVP region; the whole ROI will be identified as HGG.
While presence of MVP or Necrosis implies an HGG decision on the sample tissue, absence of both means an LGG case. In the next section, we present the experimental results of the aforementioned methods.
EXPERIMENTAL ANALYSIS
In this section, we present a set of experimental results on the brain cancer histopathological images obtained from TCGA database provided by the National Institutes of Health.[26] A brief description of this database is given in the next subsection.
Database
The Cancer Genome Atlas is a comprehensive effort to increase our understanding of cancer through cellular and molecular analysis, and its goal is to improve the ability to diagnose, treat, and prevent cancer.[27] TCGA project is producing large multimodal datasets containing histopathology images, radiology, genomic, and clinical reports for >20 types of cancer and many subtypes. There are >500 sample images for each type of tumor in TCGA database which makes it a high impact database in cancer diagnosis and treatment.[26]
Training Versus Test
Success of the proposed classification algorithms is based on accurate learning of model parameters in the training phase. These model parameters are learned based on the clinician input and using a set of 10 training ROIs from each class representing Necrosis, MVP, and LGG. In particular, a nested cross-validation scheme[28,29] that divides the available training images into two parts for coarse learning and fine tuning of parameters is employed to efficiently learn the model parameters. The same set of training ROIs was later used for training the support vector machine (SVM) classifier.
For the experiments to follow, a set of 51 HGG and 87 LGG cases was chosen from the TCGA database for further investigation from which a set of ROI of size 3000 by 3000 pixels (clinician input) were extracted. Then each ROI was investigated via the proposed algorithms. Among 51 provided HGG cases, 21 cases were manually labeled as containing Necrosis regions by the clinician and 32 as MVP, which means 2 cases had both MVP and Necrosis regions. The LGG cases do not contain any traces of Necrosis or MVP.
Results
We present three sets of results in this section. First, we validate our proposed method for Necrosis detection within the tissue, then MVP detection algorithm is validated and finally, we aggregate the results of both algorithms to obtain classification results of LGG cases versus HGG which is the main goal of this paper. Finally, we present the sensitivity analysis of our proposed method and present the receiver operating characteristics (ROC) curves which will be briefly described later.
Necrosis Detection
We applied our proposed algorithm for detecting and identifying Necrosis regions within the histopathology image slide. There are 21 cases with Necrosis region and 117 without any necrosis region, and Table 1 summarizes the obtained result. It is readily apparent from Table 1 that necrosis detection accuracy is quite high 95%. Likewise, a non-necrotic case is confused to be a Necrosis region only about 17% of the time.
Table 1.
Recognition rate (%) of our proposed method for necrosis detection

Micro-Vascular Proliferation Detection
Table 2 similarly presents the confusion matrix for detecting MVP regions. We applied our proposed method on a set of 32 MVP cases and 106 cases without any MVP within the tissue slide image. Table 2 also demonstrates promisingly high accuracy and results may be interpreted in a manner similar to Table 1. Note, however, that MVP detection accuracy is not as high as comparable rates for necrosis detection. This is because MVP detection is inherently harder than necrosis detection due to structural complexity of MVP regions. In particular, the cell structure and morphological features of cells are more likely to be confused in MVP versus non-MVP regions. While these numbers in Table 2 demonstrate the promise of our method, the results also underline a future research direction in improving MVP detection accuracy by use of more sophisticated image representation techniques.
Table 2.
Recognition rate (%) of our proposed method for MVP detection

High-grade Glioma Versus Low-grade Glioma
Here, we optimize MVP and necrosis detection algorithms in order to get the best classification results for LGG versus HGG cases. As mentioned previously, there are 51 HGG cases versus 87 LGG cases and the results are given in Table 3 that is showing significant accuracies in HGG versus LGG classification problem.
Table 3.
Recognition rate (%) for HGG versus LGG classification

We also compare our results against WND-CHARM features[30,31] which is known to be a state of the art tool for interpreting and classifying medical images and has been applied successfully in the past to many histopathology classification problems.[32] After extracting WND-CHARM features, an SVM classifier with polynomial kernel is used for decision-making. Regarding feature selection from the WND-CHARM set, we picked the most relevant features to histopathology offered by[33] including histogram information, morphological features and statistics, wavelet coefficients, image statistics, etc., The source code for WND-CHARM is made available online by the National Institutes of Health at: http://ome.grc.nia.nih.gov/wnd-charm/
Comparison of our methods’ performance with SVM + WNDCHARM firmly establishes the merits of our proposed algorithms. Note that the overall classification accuracy using WNDCHARM features combined with SVM is 68.8% while our method accuracy is 84.7% which is a significant improvement for this relatively new line of investigation.
Sensitivity Analysis
Typically in medical image classification problems, pathologists desire to see a reduced probability of miss (i.e. classifying HGG cases as LGG in this case) while also having low false alarm (falsely classifying LGG as HGG) rate. Hence, we present ROC curves which are capable of enabling a graceful trade-off between false alarm rate and probability of miss in classification problems. In order to obtain ROC curves, a statistic of interest (a function of algorithm parameters) is chosen from the problem and by sweeping this statistic over its range of possible values we can obtain different classification rates and plot the corresponding ROC.
In our analysis, a statistic of interest can be any of criteria in the decision trees like area, perimeter, number of cells, etc., or a combination of these. Figure 8 shows the ROC curves for MVP and necrosis detection algorithms as well as LGG-HGG classification. For MVP detection algorithm, ROC curves are obtained using a weighted increment of two decision variables, that is, area and minor axis length. Essentially, we increased these two parameters simultaneously, from their minimum possible value to their maximum possible value and at each step we obtained the corresponding classification rates. The reason for having a weighted increment is because that these parameters do not have the same range, and we have to do a weighted increment to normalize these parameters. For necrosis detection, a weighted increment of area and the number of cells in the dead region are chosen to obtain ROC curve. We also used these decision statistics for plotting ROC curve of HGG-LGG problem. Furthermore, in this case, the decision variable that is used for generating ROC curve of SVM + WNDCHARM is based on the margin between the two classes that SVM is maximizing as described.[13]
Figure 8.
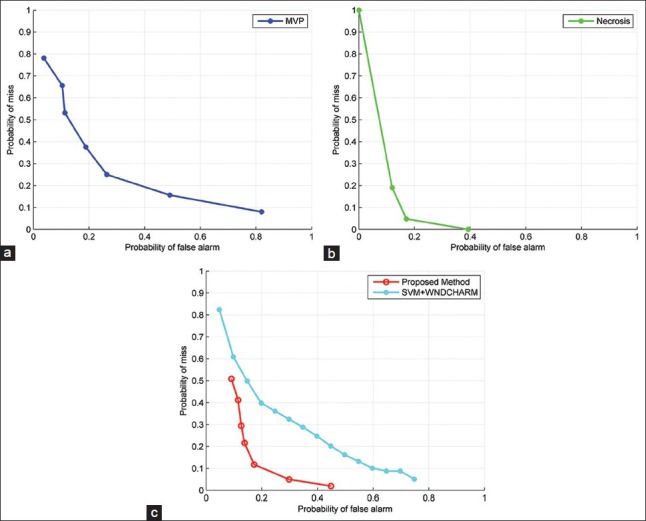
Receiver Operating Characteristics (ROC) curves for different methods. (a) ROC curve of the proposed method for MVP detection (b) ROC curve of the proposed method for Necrosis detection (c) HGG vs. LGG ROC curve
In the analysis of ROC curves, the best overall performance corresponds to the point that minimizes the sum of false alarm and misses probability. However, a clinician can choose a desirable probability of miss and corresponding false alarm rate depending on the intrinsic difficulty of the classification problem and severity of the penalty for misclassifying an HGG.
There are several other parameters in the model, and the overall performance of the whole algorithms is sensitive to the choice of those. Consequently, we present a set of experiments that shows the sensitivity of the overall accuracy with respect to the choice of a pair of parameters. There are many different pairs that can be chosen for this purpose, however, we carefully picked 4 different pairs of parameters that are experimentally determined to most strongly effect on the output of the classifier. Figure 9 shows the sensitivity analysis for some of the parameters in the model. Essentially, we changed the value of parameters in the decision tree and for each set of new parameters we obtained the overall classification performance of our method and plot (visualize) these results in Figure 9. Two key observations may be made from the plots in Figure 9: (1) White squares correspond to the parameters that lead to the best overall accuracy and (2) the accuracy varies gracefully over the range of parameter values indicating that the proposed method is robust to slight changes in parameter values.
Figure 9.
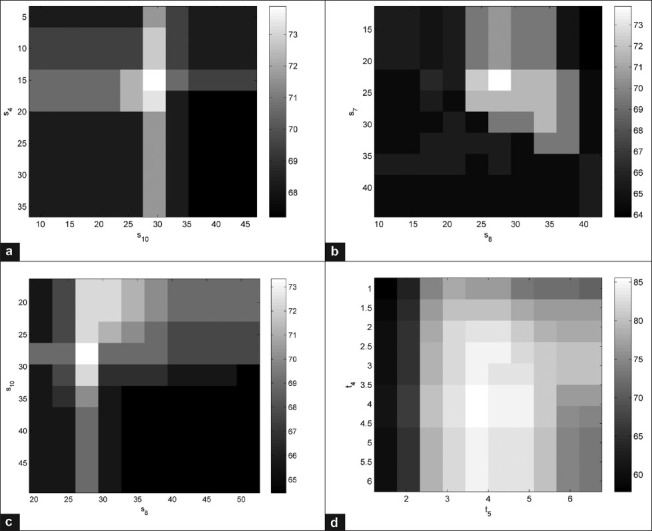
Sensitivity of overall accuracy of the microvascular proliferation detection (a-c) necrosis detection (d) to the choice of parameters in the model. We deliberately chose the most influential parameters in the decision trees (s4, s8, s10, t4, t5) and evaluated the performance (overall classification accuracy) of each algorithm with respect to the change of these parameters. The white squares correspond to the higher overall accuracies while darker squares mean lower performance. The gray bar is showing the accuracies in percentage
Reproducibility
The results in this paper are entirely reproducible. The MATLAB code for the algorithms developed is posted online at: http://signal.ee.psu.edu/hgglgg.html.
DISCUSSION
We have developed a brain cancer grading method to classify HGG and LGG in H and E stained images of human brain and proposed a set of novel algorithms for identifying the most prominent features of HGG, that is, presence of MVP and Necrosis. The main novelty of our approach is that unlike previous studies on tumor grading, we developed a set of customized method that attempts to mimic the way a clinician looks for the MVP and necrosis regions in a tissue image. In our proposed algorithm, we first use coarse visual cues (such as existence of areas with lower cellularity within the tissue) that the clinician searches for while looking for these regions, and find regions that may be potential candidates for MVP/necrosis regions. In this way, our algorithm will assist the clinician in arriving at the correct diagnosis. Once the pathologist has confirmed that the lesion in question is a glioma (excluding other brain lesions such as meningioma, or WHO grade I astrocytomas), the algorithm can be deployed to assist in grading the lesion. A customized set of features and corresponding decision rules are developed for this problem based on trying to mimic the visual analysis and decision-making process of a clinician. In particular, we first develop coarse visual cues (such as the existence of areas with lower cellularity within the tissue) to narrow down potential candidates for MVP/necrosis regions. Then, more detailed information is further investigated by means of a decision tree which is another key algorithmic contribution of our method.
Specifically, the central idea of our approach for necrosis detection is to exploit cell segmentation in the tissue and generate a cell-count profile based on the segmented image. MVP detection is also accomplished by applying a set of spatial filters and analyzing the filtered image via morphological operators. In addition, a decision tree mechanism is used to verify whether a candidate sub-region of a histopathology slide actually corresponds to MVP or Necrosis.
In this initial study of MVP and necrosis detection, we observed that promising results are obtained from our algorithms for both MVP and necrosis detection; however, there seems to be potential for further improvement on MVP detection performance. As stated before, MVP detection is an inherently difficult problem because of the complexity of cell structure and morphological features of the cells in MVP regions. Due to this, it is more likely that non-MVP regions become confused with MVP regions by our algorithm and vice versa. Consequently, MVP detection emerges as a key future research direction. An additional area of improvement of this algorithm would be the ability to identify mitotic figures which are also a significant histologic feature that discriminates LGG from HGG. However, since TCGA database largely contains traces of MVP and Necrosis, we focused on these two abnormalities for identifying HGGs.
A potential limitation to our study is that the algorithms require an adequate sample to determine tumor grade. Similarly, a clinician would require enough tumor material to make the diagnosis. Because even a single focus of MVP or necrosis can result in the diagnosis of HGG, the algorithms can, therefore, assist the pathologist in arriving at the correct diagnosis.
By performing extensive experimental results on the TCGA database, we demonstrate the merit of our proposed method using a variety of figures of merit, namely: Confusion matrices, ROC curves, and sensitivity analysis. The confusion matrices reveal that our method achieves convincing results in terms of classification accuracies including “MVP as MVP,” “not-MVP as Not-MVP,” “Necrosis as Necrosis,” “Not-Necrosis as Not-Necrosis,” “LGG as LGG,” and “HGG as HGG” rates. For benchmarking, we compare the performance of our algorithm with the NIH's well-known WND-CHARM software. Our classification rates compare favorably against WND-CHARM and hence firmly establish the practical merits of our proposed image processing algorithm and its effectiveness in automated inference for grading glioma brain tumor. Finally, ROC curves and sensitivity analysis plots are presented that elaborate on parameter choices to achieve a desirable trade-off between the probability of miss and false alarm. Our algorithm also exhibits robustness in the vicinity of optimal parameter choices, which is a key to practical deployment of any automated image analysis and disease grading technique.
ACKNOWLEDGMENT
The authors would like to gratefully acknowledge the Army Research Office (ARO) grant number W911NF-14-1-0421 (to V.M.), National Institute of Health NIH grant KNS070928 (to G.R.), NCI Cancer Center Support Grant NCI P30 CA016672 and Career Development Award from the Brain Tumor SPORE (to A.R.).
Footnotes
Available FREE in open access from: http://www.jpathinformatics.org/text.asp?2015/6/1/15/153914
REFERENCES
- 1.Méndez AJ, Tahoces PG, Lado MJ, Souto M, Vidal JJ. Computer-aided diagnosis: Automatic detection of malignant masses in digitized mammograms. Med Phys. 1998;25:957–64. doi: 10.1118/1.598274. [DOI] [PubMed] [Google Scholar]
- 2.Peng Y, Jiang Y, Eisengart L, Healy MA, Straus FH, Yang XJ. Computer-aided identification of prostatic adenocarcinoma: Segmentation of glandular structures. J Pathol Inform. 2011;2:33. doi: 10.4103/2153-3539.83193. [DOI] [PMC free article] [PubMed] [Google Scholar]
- 3.Irshad H, Jalali S, Roux L, Racoceanu D, Hwee LJ, Naour GL, et al. Automated mitosis detection using texture, SIFT features and HMAX biologically inspired approach. J Pathol Inform. 2013;4:S12. doi: 10.4103/2153-3539.109870. [DOI] [PMC free article] [PubMed] [Google Scholar]
- 4.Kothari S, Phan JH, Wang MD. Eliminating tissue-fold artifacts in histopathological whole-slide images for improved image-based prediction of cancer grade. J Pathol Inform. 2013;4:22. doi: 10.4103/2153-3539.117448. [DOI] [PMC free article] [PubMed] [Google Scholar]
- 5.Rubin R, Strayer DS, Rubin E. Philadelphia: Lippincott Williams and Wilkins; 2008. Rubin's Pathology: Clinicopathologic Foundations of Medicine. [Google Scholar]
- 6.Weind KL, Maier CF, Rutt BK, Moussa M. Invasive carcinomas and fibroadenomas of the breast: Comparison of microvessel distributions – Implications for imaging modalities. Radiology. 1998;208:477–83. doi: 10.1148/radiology.208.2.9680579. [DOI] [PubMed] [Google Scholar]
- 7.Bartels PH, Thompson D, Bibbo M, Weber JE. Bayesian belief networks in quantitative histopathology. Anal Quant Cytol Histol. 1992;14:459–73. [PubMed] [Google Scholar]
- 8.Doyle S, Agner S, Madabhushi A, Feldman M, Tomaszewski J. Automated Grading of Breast Cancer Histopathology Using Spectral Clustering with Textural and Architectural Image Features. In Biomedical Imaging: From Nano to Macro, ISBI 2008. 5th IEEE International Symposium on. 2008:496–9. [Google Scholar]
- 9.Ozdemir E, Gunduz-Demir C. A hybrid classification model for digital pathology using structural and statistical pattern recognition. IEEE Trans Med Imaging. 2013;32:474–83. doi: 10.1109/TMI.2012.2230186. [DOI] [PubMed] [Google Scholar]
- 10.Nayak N, Chang H, Borowsky A, Spellman P, Parvin B. Classification of tumor histopathology via sparse feature learning. Proc IEEE Int Symp Biomed Imaging 2013. 2013:410–13. doi: 10.1109/ISBI.2013.6556499. [DOI] [PMC free article] [PubMed] [Google Scholar]
- 11.Chang H, Borowsky A, Spellman P, Parvin B. Classification of tumor histology via morphometric context. In Computer Vision and Pattern Recognition (CVPR), 2013 IEEE Conference on. 2013:2203–10. doi: 10.1109/CVPR.2013.286. [DOI] [PMC free article] [PubMed] [Google Scholar]
- 12.Chang H, Fontenay GV, Han J, Cong G, Baehner FL, Gray JW, et al. Morphometic analysis of TCGA glioblastoma multiforme. BMC Bioinformatics. 2011;12:484. doi: 10.1186/1471-2105-12-484. [DOI] [PMC free article] [PubMed] [Google Scholar]
- 13.Srinivas U, Mousavi HS, Monga V, Hattel A, Jayarao B. Simultaneous sparsity model for histopathological image representation and classification. IEEE Trans Med Imaging. 2014;33:1163–79. doi: 10.1109/TMI.2014.2306173. [DOI] [PubMed] [Google Scholar]
- 14.Srinivas U, Mousavi HS, Jeon Ch, Monga V, Hattel A, Jayarao B. SHIRC: A simultaneous sparsity model for histopathological image representation and classification. Proc IEEE Int Symp Biomed Imaging. 2014:1118–21. doi: 10.1109/TMI.2014.2306173. [DOI] [PubMed] [Google Scholar]
- 15.Egevad L, Allsbrook WC, Jr, Epstein JI. Current practice of Gleason grading among genitourinary pathologists. Hum Pathol. 2005;36:5–9. doi: 10.1016/j.humpath.2004.10.001. [DOI] [PubMed] [Google Scholar]
- 16.Lawrence Berkeley Lab. Berkeley Cancer Morphometric Data. [Last cited on 2014 May 15]. Available from: http://tcga.lbl.gov/biosig/tcgadownload.do .
- 17.Ohgaki H, Kleihues P. Population-based studies on incidence, survival rates, and genetic alterations in astrocytic and oligodendroglial gliomas. J Neuropathol Exp Neurol. 2005;64:479–89. doi: 10.1093/jnen/64.6.479. [DOI] [PubMed] [Google Scholar]
- 18.Burger PC, Sheithauer BW, Vogel FS. 4th ed. New York: Churchill Livingstone; 2002. Surgical Pathology of the Nervous System and Its Coverings; pp. 379–89. [Google Scholar]
- 19.Wippold FJ, 2nd, Lämmle M, Anatelli F, Lennerz J, Perry A. Neuropathology for the neuroradiologist: Palisades and pseudopalisades. AJNR Am J Neuroradiol. 2006;27:2037–41. [PMC free article] [PubMed] [Google Scholar]
- 20.Rong Y, Durden DL, Van Meir EG, Brat DJ. ‘Pseudopalisading’ necrosis in glioblastoma: A familiar morphologic feature that links vascular pathology, hypoxia, and angiogenesis. J Neuropathol Exp Neurol. 2006;65:529–39. doi: 10.1097/00005072-200606000-00001. [DOI] [PubMed] [Google Scholar]
- 21.Rodriguez FJ, Orr BA, Ligon KL, Eberhart CG. Neoplastic cells are a rare component in human glioblastoma microvasculature. Oncotarget. 2012;3:98–106. doi: 10.18632/oncotarget.427. [DOI] [PMC free article] [PubMed] [Google Scholar]
- 22.Kothari S, Phan JH, Osunkoya AO, Wang MD. Biological interpretation of morphological patterns in histopathological whole-slide images. In Proceedings of the ACM Conference on Bioinformatics, Computational Biology and Biomedicine. 2012:218–25. doi: 10.1145/2382936.2382964. [DOI] [PMC free article] [PubMed] [Google Scholar]
- 23.Meijering E. Cell segmentation: 50 years down the road [life sciences] IEEE Signal Process Mag. 2012;29:140–5. [Google Scholar]
- 24.Sonka M, Hlavac V, Boyle R. Toronto: Thomson; 2008. Image Processing, Analysis, and Machine Vision. [Google Scholar]
- 25.Vincent L. Morphological grayscale reconstruction in image analysis: applications and efficient algorithms. IEEE Trans Image Process. 1993;2:176–201. doi: 10.1109/83.217222. [DOI] [PubMed] [Google Scholar]
- 26.National Institute of Health. TCGA Database. [Last cited on 2014 May 15]. Available from: http://www.cancergenome.nih.gov .
- 27.Cancer Genome Atlas Research Network. Comprehensive genomic characterization defines human glioblastoma genes and core pathways. Nature. 2008;455:1061–8. doi: 10.1038/nature07385. [DOI] [PMC free article] [PubMed] [Google Scholar]
- 28.Sylvain A, Celisse A. A survey of cross-validation procedures for model selection. Stat Surv. 2010;4:40–79. [Google Scholar]
- 29.Talloen W. Nested Loop Cross Validation for Classification using nlcv. [Last cited on 2014 May 15]. Available from: http://www.bioconductor.org/packages/release/extra/vignettes/nlcv/inst/doc/nlcv.pdf .
- 30.Orlov N, Shamir L, Macura T, Johnston J, Eckley DM, Goldberg IG. WND-CHARM: Multi-purpose image classification using compound image transforms. Pattern Recognit Lett. 2008;29:1684–693. doi: 10.1016/j.patrec.2008.04.013. [DOI] [PMC free article] [PubMed] [Google Scholar]
- 31.Shamir L, Orlov N, Eckley DM, Macura T, Johnston J, Goldberg IG. Wndchrm – An open source utility for biological image analysis. Source Code Biol Med. 2008;3:13. doi: 10.1186/1751-0473-3-13. [DOI] [PMC free article] [PubMed] [Google Scholar]
- 32.Shamir L, Orlov N, Mark Eckley D, Macura TJ, Goldberg IG. IICBU 2008: A proposed benchmark suite for biological image analysis. Med Biol Eng Comput. 2008;46:943–7. doi: 10.1007/s11517-008-0380-5. [DOI] [PMC free article] [PubMed] [Google Scholar]
- 33.Gurcan MN, Boucheron LE, Can A, Madabhushi A, Rajpoot NM, Yener B. Histopathological image analysis: A review. IEEE Rev Biomed Eng. 2009;2:147–71. doi: 10.1109/RBME.2009.2034865. [DOI] [PMC free article] [PubMed] [Google Scholar]


