Abstract
Objective
To evaluate the psychometric properties of the Spinal Cord Injury Functional Index (SCI-FI) short forms (Basic Mobility, Self-Care, Fine Motor, Ambulation, Manual Wheelchair, and Power Wheelchair) based on internal consistency, correlations between short- and full item bank forms, and a 10-item compute adaptive test version, magnitude of ceiling and floor effects, and test information functions.
Design
Cross-sectional cohort study.
Participants
855 individuals with traumatic spinal cord injury recruited from 6 National Spinal Cord Injury Model Systems facilities.
Interventions
Not applicable.
Main outcome measures
SCI-FI full item bank, 10-item computer adaptive test, and parallel short form scores.
Results
The SCI-FI short forms (with separate versions for individuals with paraplegia and tetraplegia) demonstrate very good internal consistency, group-level reliability, excellent correlations between short forms and scores based on the total item bank, minimal ceiling and floor effects (except ceiling effects for persons with paraplegia on Self-Care, Fine Motor and Power Wheelchair ability, and floor effects for persons with tetraplegia on Self-Care, Fine Motor and Manual Wheelchair ability). The test information functions are acceptable across the range of scores where most persons in the sample performed.
Conclusions
clinicians and researchers should consider the SCI-FI short forms when computer adaptive testing is not feasible.
Keywords: Activities of daily living, Outcome assessment (health care), Psychometrics, Rehabilitation, Spinal cord injuries
Maximizing physical function after spinal cord injury (SCI) is a primary rehabilitation goal. Patients, clinicians, researchers and policy makers value documentation of physical function to evaluate treatment efficacy, appraise the cost-effectiveness of rehabilitation services, describe the consequences of health policy, improve the quality of rehabilitation care, and inform patients, families, and insurers about a person’s course of recovery. Reliable, valid, and sensitive instruments are critical to assess physical functioning following SCI. Clinicians and researchers use a variety of physical functioning measures to describe patient- and program-level outcomes, including the Functional Independence Measure (FIM),1 the Spinal Cord Independence Measure (SCIM),2 and the Quadriplegia Index of Function (QIF).3 These generic and condition-specific functional status measures have significant shortcomings, including a focus on only some aspects of physical functioning, operationalization of burden of care rather than functioning ability,4 disregard of patients/consumers’ perspectives,5 commingling of physiological status and physical ability items,5 outdated views of activities of daily living,6 limited sensitivity, and reliance on clinicians’ ratings of function.
The SCI Functional Index (SCI-FI) project developed item banks that can be used to measure the functional consequences of SCI. Item bank development began with a comprehensive literature review, included feedback from focus groups of persons with SCI and clinicians with SCI experience, and utilized expert feedback7,8,9 following PROMIS guidelines.10 After the focus groups identified domains and specific examples of physical functioning, research team members drafted 328 items, used cognitive debriefing to assure that these items were understood by participants as intended, analyzed items’ reading level, and completed field-testing by administering the resulting draft item banks in their entirety. The initial 11 domains were reduced to five domains with 275 items (Self-Care, Fine Motor function, Basic Mobility, Wheelchair mobility (power and manual), Ambulation) using item response theory (IRT) methods and confirmatory factor analysis.7,8 Each domain is unidimensional and demonstrates excellent psychometric properties. The five item banks provide reliable measurement of physical function across a wide range of ability levels. The original objective was for them to be administered using computer adaptive testing (CAT). Simulated 5-item and 10-item CAT subsets have excellent correlations with the full item bank scores.7,8
There are occasions when computer administration of patient-reported outcome instruments is not feasible. Clinicians often do not have access to computer-administered testing, and when they do, patient access to websites that administer and score item banks may be restricted. Short forms (SF) obviate these problems. In theory, careful selection of a small number of representative items from an item bank to constitute a short form assures that physical function can be measured with nearly the same reliability as is achieved with the complete item bank or with the items administered using a CAT algorithm. In each instance, it is necessary to test that hypothesis. Thus, the objective of this study was to develop short forms for each of the SCI-FI item banks and evaluate their measurement properties in terms of (1) internal consistency, (2) correlations between SF, full item banks, and 10-item CATs, (3) ceiling and floor effects, and (4) test information function.
Methods
Facilities and Participants
Jette, Tulsky and colleagues7,8 reported the sample recruitment strategy and sample characteristics. In brief, participating facilities were the Mount Sinai SCI Model System, the Midwest Regional SCI Care System, the New England Regional SCI Model System, the Northern New Jersey SCI System, the Rocky Mountain Regional SCI System, and the University of Michigan Model SCI System; we obtained Institutional Review Board approval at each site. Patient inclusion criteria were traumatic SCI, age 18 years or older, and ability to speak and comprehend English. We stratified the sample by level of injury (paraplegia vs. tetraplegia), completeness of injury (complete vs. incomplete), and time since injury (less than1 year, 1-3 years, and 3 or more years) to obtain a heterogeneous sample.
Strategy for SF Item Selection
We asked content experts to select 8 to 10 items per domain that reflect a wide range of item locations along a dimension of least to most difficulty as established in previous calibration study. We employed two phases of content expert input. First, investigators from the University of Michigan and Boston University selected a pool of candidate items. The second phase involved input from co-investigators and experienced clinicians from collaborating sites who participated in the conference call where a consensus was reached on the items.
We used the grading response model to calibrate the SCI-FI items banks. High item discrimination was a second criterion for item selection. In IRT models, the item discrimination parameter reflects the steepness of the item characteristic curve, which reflects the relationship between the item and the latent trait assessed. The higher the discrimination parameter item the greater the ability of an item to distinguish among subjects at similar latent trail level. In most IRT models, the latent trait is assumed to approximate a normal curve, which will put more weight on the center of the distribution. Expected information values reflect the estimate of information provided by an item derived using characteristics of the normal distribution. Items with the highest expected information value will provide more information in the region where the majority of the target population scores are located.
Statistical Analysis
We calculated group level reliability and Cronbach’s alpha for groups defined by level of injury. We defined group level reliability as , where is the mean of estimated score standard errors in each injury group, and is the variance of the estimated score for all the participants. Using the item parameters obtained from the full item bank analysis, we scored the SF for each subject based on the item response pattern and compared them with the score generated from the full item bank using intra-class correlation coefficients (ICC(3,1)). We calculated the proportion of the sample at the ceiling and floor of each short form, as well as for the 10-item CAT, and the full item bank for each domain. Finally, we calculated the item information function for each short form and compared it with the subject score distribution. We retained those items with the highest expected information values using normal weighting as candidate items.11 Initially we found substantial ceiling and floor effects in the Fine Motor, Self-Care, and Power Wheelchair domains and therefore created injury level-specific SF for these domains, and repeated the entire analysis. The data for the SF intended for paraplegia and tetraplegia combined are not shown. To facilitate the SF scoring, we generated the translation between the summed score and the IRT score.12
Results
The sample’s mean age was in the mid-40s; the mean time since injury was 7 years (Table 1). The injury, gender, race, and ethnicity characteristics of the sample are representative of the SCI Model Systems sample. Approximately three-quarters of the participants were living at home; four-fifths used a bowel and bladder program, and one-quarter walked some or all of the time.
Table 1. Demographic and Clinical Characteristics of the Sample.
| Variable | Level of Lesion: Tetraplegia (n=465, 54%) |
Level of Lesion: Paraplegia (n=390, 46%) |
Total (N=855) |
|---|---|---|---|
| Current age (mean, SD) | 43 (15) | 43 (15) | 43 (15) |
| Age at injury (mean, SD) | 37 (17) | 36 (15) | 36 (16) |
| Years since injury (mean, SD) | 7 (9) | 7 (9) | 7 (9) |
| Gender (%) | |||
| Male | 79 | 74 | 77 |
| Female | 21 | 26 | 23 |
| Ethnicity (%) | |||
| Hispanic | 10 | 13 | 11 |
| Non-Hispanic | 89 | 87 | 88 |
| Unknown/refused | 1 | 0 | 1 |
| Race (%) | |||
| White | 73 | 67 | 70 |
| Black | 15 | 20 | 17 |
| Asian | 3 | 1 | 2 |
| American Indian/Alaskan Native | 0 | 1 | 1 |
| More than 1 race | 7 | 10 | 8 |
| Unknown/refused | 2 | 1 | 1 |
| Type of injury (%) | |||
| Complete | 41 | 52 | 46 |
| Incomplete | 59 | 48 | 54 |
| Central cord syndrome (%) | 6 | 1 | 4 |
| Living situation (%) | |||
| Private residence | 74 | 82 | 78 |
| Inpatient rehabilitation facility | 22 | 16 | 19 |
| (Skilled) nursing home or long-term care | 4 | 2 | 3 |
| Uses a bowel and bladder program (%) | 80 | 79 | 79 |
| Walks some or all of the time (%) | 26 | 28 | 27 |
| Uses a manual wheelchair some or all of the time (%) | 33 | 74 | 51 |
| Uses a power wheelchair some or all of the time (%) | 62 | 18 | 42 |
Table 2 lists the means and standard deviations of short form scores, group level reliability, Cronbach’s alpha, intraclass correlation coefficients, and associated 95% confidence intervals between the SF and the full item bank by level of injury. Scores are normed on the full item bank using T-scores such that the mean is 50 and the standard deviation is 10. The average functional level for subjects with paraplegia was higher than for subjects with tetraplegia. For all but the Ambulation short form, the mean score of subjects with paraplegia was >1 standard deviation higher than for subjects with tetraplegia; the largest difference was found in Fine Motor short form (about 1.5 SD). For wheelchair function scores, subjects who used a Power Wheelchair had about a one-half standard deviation lower mean score compared with those using a Manual Wheelchair; this difference was consistent across injury level. Generally, subjects with paraplegia had less score variability compared with those with tetraplegia. Reliability coefficients were very high. Group level reliability coefficients ranged from .85 to .96, Cronbach αs ranged from .85 to .95, and ICCs ranged from .90 to .99.
Table 2. Means and Standard Deviations (SD) of Short Form Scores, Number of items in Short Forms, Cronbach’s Alpha (α), group level reliability, and Intraclass Correlation Coefficients (ICC) between the Short Form and the Full Item Bank Scores by Level of Injury.
| Domain (Items in Full Bank) |
N | Mean | SD | Number of Items in Short Form |
Group Level Reliability |
α | ICC(95% CI) |
|---|---|---|---|---|---|---|---|
|
Basic Mobility
(54) |
|||||||
| Tetraplegia | 465 | 46 | 10 | 11 | 0.87 | 0.95 | 0.97(0.96,0.97) |
| Paraplegia | 389 | 55 | 6 | 11 | 0.94 | 0.89 | 0.93(0.91,0.94) |
| Self-care (90) | |||||||
| Tetraplegia | 463 | 44 | 12 | 11 | 0.85 | 0.94 | 0.91(0.90,0.93) |
| Paraplegia | 387 | 56 | 5 | 10 | 0.96 | 0.94 | 0.90(0.87,0.92) |
| Fine Motor (36) | |||||||
| Tetraplegia | 462 | 43 | 8 | 10 | 0.92 | 0.95 | 0.98(0.97,0.98) |
| Paraplegia | 387 | 57 | 5 | 11 | 0.89 | 0.90 | 0.96(0.95,0.97) |
|
Ambulation
(39) |
|||||||
| Tetraplegia | 119 | 65 | 7 | 11 | 0.93 | 0.95 | 0.95(0.93,0.96) |
| Paraplegia | 109 | 65 | 7 | 11 | 0.93 | 0.95 | 0.96(0.95,0.97) |
|
Manual
Wheelchair (56*) |
|||||||
| Tetraplegia | 150 | 48 | 8 | 10 | 0.88 | 0.92 | 0.93(0.90,0.95) |
| Paraplegia | 285 | 57 | 6 | 10 | 0.88 | 0.86 | 0.92(0.90,0.94) |
|
Power
Wheelchair (56*) |
|||||||
| Tetraplegia | 288 | 42 | 10 | 10 | 0.87 | 0.85 | 0.99(0.99,0.99) |
| Paraplegia | 67 | 53 | 8 | 10 | 0.89 | 0.88 | 0.99(0.98,0.99) |
The Manual and Power Wheelchair short form items were drawn from the same wheelchair item bank.
Table 3 shows score ranges and the proportion of the sample at the ceiling and floor of the score theoretical extremes by domain, mode of (simulated) SCI-FI administration, and level of injury. Creating injury-level specific versions of the Fine Motor, Self-Care, and Power Wheelchair domain substantially reduced ceiling and floor effects, though initially an unacceptably large proportion of the sample had extreme scores for the Self-Care (16% for the tetraplegia group) and Fine Motor domains (45% for the paraplegia group). We added one item to Self-Care for the tetraplegia and one to the Fine Motor domain for the paraplegia SF. Doing so decreased the ceiling and floor effects. For example, the floor effect for the tetraplegia Self-Care short form decreased from 16% to 2%. For the paraplegia Fine Motor short form, the ceiling effect decreased from 45% to 29%. Overall, the proportion of extreme scores received using the SF compares favorably with what was found for the 10-item CAT and the full item bank.
Table 3. Score Range, Ceiling and Floor Effects of SCI-FI Domains by Mode and Level of Injury.
| Domain | Mode | Tetraplegia | Paraplegia | ||||||
|---|---|---|---|---|---|---|---|---|---|
| N | Range | % at Ceiling | % at Floor | N | Range | % at Ceiling | % at Floor | ||
| Basic Mobility | Short Form | 465 | 28-69 | 4 | 13 | 389 | 28-69 | 7 | 0 |
| 10-item CAT | 465 | 23-74 | 3 | 10 | 389 | 23-74 | 3 | 0 | |
| Full item bank | 465 | 19-77 | 2 | 5 | 389 | 19-77 | 2 | 0 | |
| Self-care | Short Form | 463 | 0-61 | 6 | 2 | 387 | 39-62 | 22 | 2 |
| 10-item CAT | 463 | 0-64 | 6 | 1 | 387 | 20-64 | 18 | 0 | |
| Full item bank | 463 | 0-66 | 4 | 1 | 387 | 14-66 | 11 | 0 | |
| Fine Motor | Short Form | 462 | 28-58 | 0 | 10 | 387 | 37-63 | 29 | 0 |
| 10-item CAT | 462 | 27-63 | 4 | 9 | 387 | 27-63 | 29 | 0 | |
| Full item bank | 462 | 27-63 | 3 | 7 | 387 | 27-63 | 28 | 0 | |
| Ambulation | Short Form | 119 | 52-78 | 6 | 5 | 109 | 52-78 | 6 | 3 |
| 10-item CAT | 119 | 49-88 | 3 | 3 | 109 | 49-88 | 1 | 1 | |
| Full item bank | 119 | 48-88 | 3 | 3 | 109 | 48-88 | 1 | 1 | |
| Manual Wheelchair | Short Form | 150 | 32-71 | 1 | 11 | 285 | 36-71 | 6 | 0 |
| 10-item CAT | 150 | 3-73 | 1 | 5 | 285 | 42-73 | 2 | 0 | |
| Full item bank | 150 | 3-74 | 1 | 3 | 285 | 41-74 | 2 | 0 | |
| Power Wheelchair | Short Form | 288 | 5-60 | 4 | 2 | 67 | 13-61 | 21 | 1 |
| 10-item CAT | 288 | 3-61 | 3 | 1 | 67 | 3-61 | 21 | 1 | |
| Full item bank | 288 | 3-62 | 3 | 1 | 67 | 3-62 | 21 | 1 | |
In order to evaluate the ability of the SCI-FI to distinguish function by SCI level, we compared the mean scores across 8 injury levels in each domain (C1-3, C4, C-5, C-6, C7-8, T1-9, T10-L1, and L2-S5). Except for the Ambulation scale, the mean scores of 8 lesion level groups are different [Basic Mobility: F(7,834)=49.83, p<0.001; Self Care: F(7,830)=65.76, p<0.0001; Fine Motor: F(7,830)=154.31, p<0.0001; Manual Wheelchair: F(7,422)=30.76, p<0.0001; Power Wheelchair: F(7,345)=29.16, p<0.0001]. Exclusion of persons who could not walk in constructing the ambulation scale may account for the absence of significant differences in the Ambulation scale. Next, we completed post hoc comparisons (Tukey’s test) for each scale except Ambulation. Overall, each scale differentiated the lesion levels. Especially in Fine Motor scale, the mean scores were significantly different across most of the lesion levels except, C1-3 and C4, C5 and C6, T1-9 and L2-S5, T10-L1 and L2-S5.
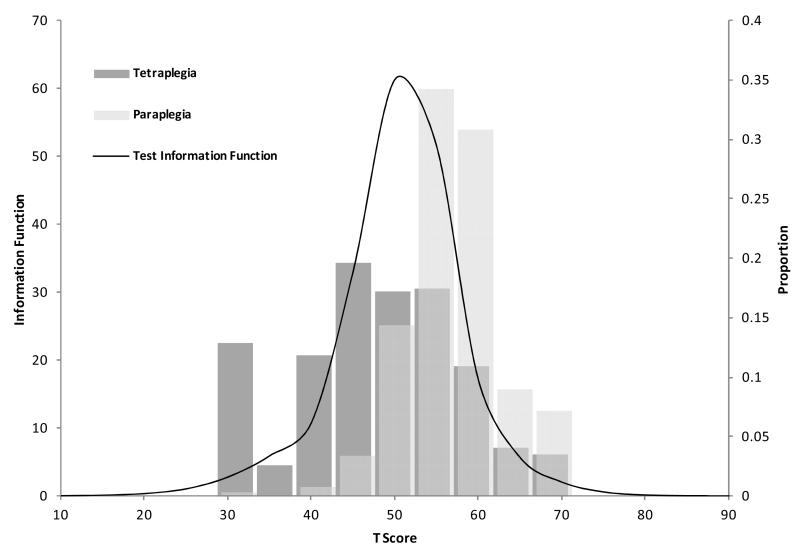
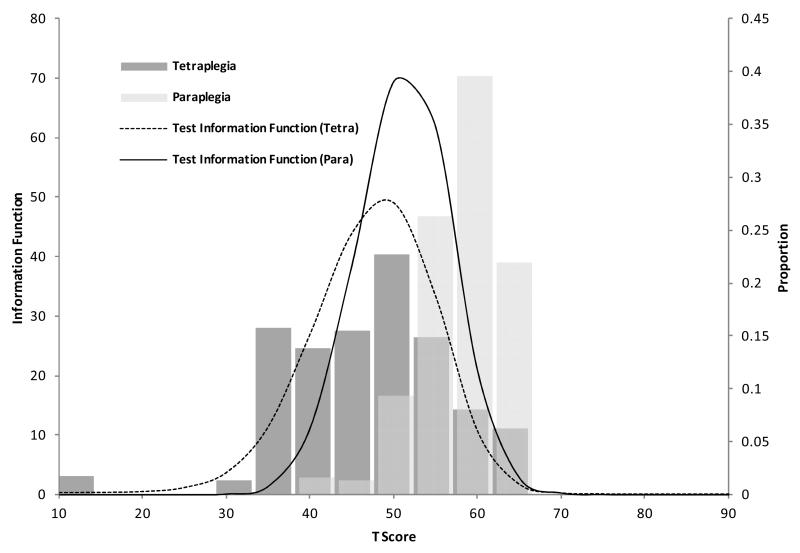
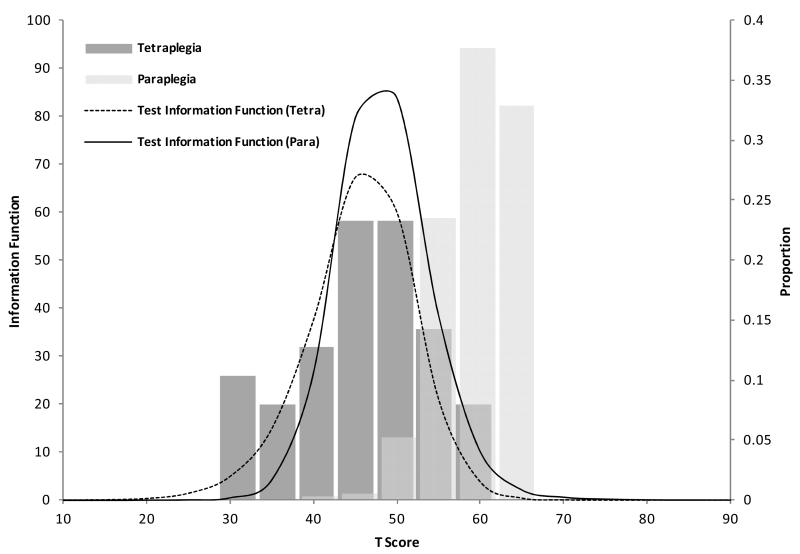
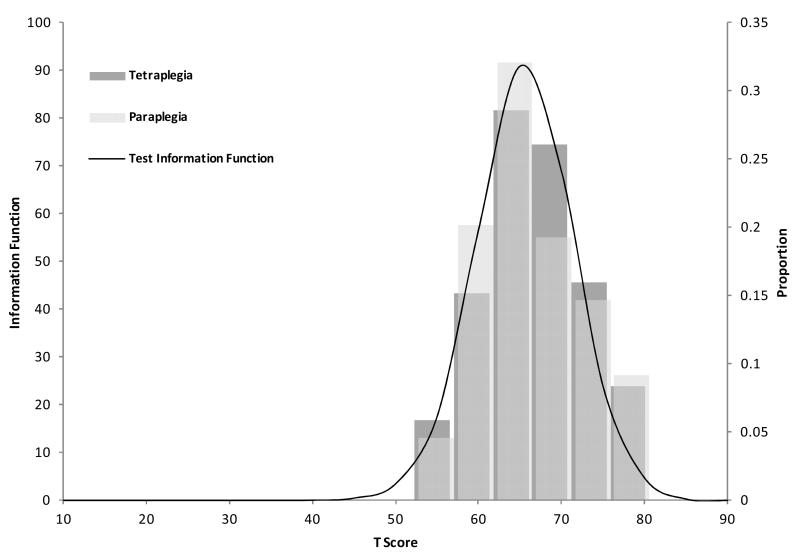
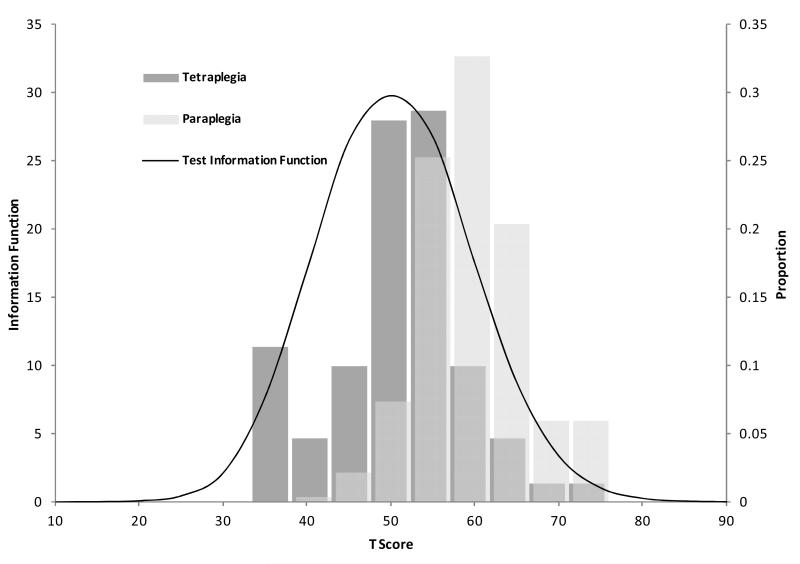
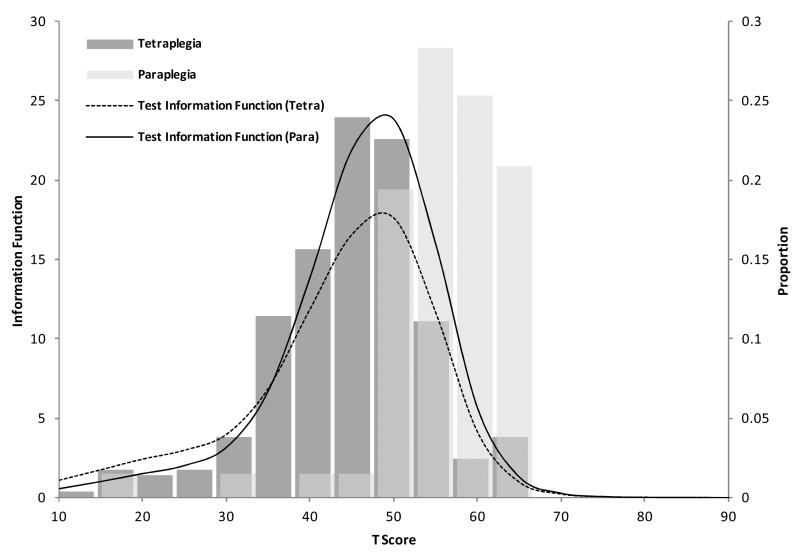
Figures 1 through 6 illustrate test information function curves and categorized T-score sample distributions for each of the domains. In general, the test information function is at a maximum and exceeds .20 over the range of scores for most participants. The test information function is greater for the paraplegia than the tetraplegia group for Self-Care, Fine Motor, and Power Wheelchair domains, though the values are sufficiently high over the range of scores for a large proportion of participants.
Figure 1. Test information function and sample distributions for Basic Mobility short form.
Tables S1 through S9 provide conversions between summed raw scores and T-scores for the SFs in each domain. Users may look up the summed raw score in a particular domain and find the corresponding T-score and associated standard error. For example, Table S8 shows that a person with tetraplegia who receives a summed score of 28 has a corresponding T-score of 40.08, approximately 1 standard deviation below the mean of 50.
Discussion
Ever since the first generic functional assessment instruments such as the Barthel Index13 and the FIM1 were published, clinicians and researchers have criticized these instruments for limited utility in quantifying the functioning and changes in the level of functioning of individuals with SCI.14-19 The publication of the SCIM did not change their opinions.6,20 For reasons unknown, the QIF, which would seem a much better measure of the functioning of individuals with tetraplegia,15 never gained popularity, not even in its short form.21 While a number of tests of upper extremity motor function are available to quantify a more limited aspect of tetraplegic functioning, these too have found very limited use in SCI care and research.17
The SCI-FI development team aimed to improve measurement of the functional abilities of persons with SCI by assuming that even in a measure targeted to SCI rather than to all disability groups combined, one score does not serve all. Starting with a review of the literature and focus groups, we created five item banks and used IRT and confirmatory factor analysis to eliminate misfitting items and demonstrate the essential unidimensionality of each item bank. While the SCI-FI was developed for CAT administration to estimate functioning level of patients or research subjects in each of the five domains, the development team realized that CAT might not be practical in all clinical settings, at least in the near term. In the due time, electronic health records may offer opportunities for routine administration of CATs for all kinds of patient-reported outcomes, and clinicians and researchers may have platforms such as tablet computers and smart phones to administer CATs. Until that time, SFs, which can be administered in computer and paper-and-pencil formats, will have a role. This study aimed to create SCI-FI short forms that can be used to create functional scores that correspond maximally with the scores that would be obtained using CAT.
We found that SFs, with separate versions for paraplegia and tetraplegia, where indicated, have high reliability, with ceiling and floor effects similar to that found for the CATs and full-length item banks. We were not surprised to see higher ceiling effects for persons with paraplegia on Self-Care, Fine Motor, and Power Wheelchair ability given the lower level of their lesions compared with those with tetraplegia. Similarly, we were not surprised to observe somewhat higher floor effects for persons with tetraplegia on Basic Mobility, Fine Motor, and Manual Wheelchair ability given the higher levels of their lesions compared to those with paraplegia. We chose to create separate power and manual wheelchair SFs to give clinicians and researchers maximum options in their selection of SFs that best spans the range of functioning that is relevant for patients with SCI. Given that each SF consists of 10 or 11 items, a clinician or researcher can obtain a fairly comprehensive assessment of motor function by administering SFs, selecting those domains that are relevant for a particular person.
Study Limitations
Our findings have several limitations. Model System facilities may not serve patients who are representative of the universe of people with SCI in the United States or in other countries. The study participants received an honorarium and the self-selection involved in creating the sample could create bias. Nonetheless, the sample is large and comes from diverse communities. Based on familiarity with SF and IRT applications, the development team decided that SFs of 10 items (in two instances 11) offered the best balance between brevity, precision, and reliability of the functional status estimates the SCI-FI SFs generate. Others may balance those two elements differently, and prefer somewhat shorter or longer SFs, or more versions of SFs beyond those for paraplegia and tetraplegia (e.g., also a split between high and low tetraplegia, and/or by grade of completeness of injury). Lastly, the SF statistics presented here assume that there was no context effect in administration; when the SCI-FIs are administered as SFs, there may be a difference between how people complete the 10/11 items and how they would have completed the same items if they were embedded in a 30 to 60+-item bank.
Use of standardized outcome instruments allows rehabilitation programs to monitor patient outcomes readily. Short forms reduce technological, administrative, and respondent burden by providing a familiar, easy-to-use data collection format. Clinicians do not need a computer running specialized software; they can collect data at bedside or in a clinic; patients could receive forms by mail and bring them to their next clinic visit. The on-line appendix of this manuscript contains conversion tables to convert summed raw scores into T-scores. Summed raw scores should not be used to compare patient groups, and even less to monitor change of individual patients over time, because they are not reflective of an underlying interval scale. 22 Screening questions needed to determine which SCI-FI SFs are appropriate to each person, “Do you have tetraplegia or paraplegia?” “Can you walk, however poorly?” may not be necessary in clinics because clinicians usually know this information.
In research situations, investigator may need to add these questions to their questionnaires with the appropriate instructions as to which SF to complete. The conversion tables are provided in Excel format to make it easier to build the transformation into statistical analysis programs. Research applications of the SCI-FI SF are numerous. With reduced respondent burden, research participants can complete more assessments in a reasonable time. Investigators can be assured that the reliability of the SF is equivalent, or nearly so, to CAT and full-length item banks.
The CAT and short form versions of the various SCI-FI instruments and full time banks are available at no charge through the NIH Assessment Center. Resource-limited environments can collect SCI-FI scores and other patient-reported outcomes at low cost through this platform. Where that mechanism is inconvenient or even impossible, the SFs offer an opportunity to collect high-quality data using formats with which clinicians, researchers, and their subjects or patients are already familiar. Though the SCI-FI is copyrighted, it is freely available for use. The SCI-FI full item banks, SFs or the CAT version could be built into tablets, smart phones, electronic medical records and other applications to enhance the clinical care of individuals with SCI.
Conclusions
The SCI-FI SFs make it possible for clinicians and researchers to collect functional status information in a simple manner and be assured that the data demonstrate high-quality psychometric information. As such, these short forms are a useful supplement to the CAT versions previously published.
Supplementary Material
Figure 2. Test information function and sample distributions for Self-Care short form.
Figure 3. Test information function and sample distributions for Fine Motor short form.
Figure 4. Test information function and sample distributions for Ambulation short form.
Figure 5. Test information function and sample distributions for Manual Wheelchair short form.
Figure 6. Test information function and sample distributions for Power Wheelchair short form.
Acknowledgments
Supported by the National Institute of Disability and Rehabilitation Research, Office of Special Education and Rehabilitative Services, U.S. Department of Education, (grants no. H133N060022, H133N060024, H133N060014, H133N060005, H133N060027, and H133N060032 H133N120002) and by the National Institutes of Health, National Institute of Child Health & Human Development, National Center for Medical Rehabilitation Research, and National Institute of Neurological Disorders and Stroke (grant no. 5R01HD054659).
Abbreviations
- CAT
Computer adaptive testing
- FIM
Functional Independence Measure
- IRT
Item response theory
- QIF
Quadriplegia Index of Function
- SCI
Spinal cord injury
- SCI-FI
Spinal Cord Injury Functional Index
- SCIM
Spinal Cord Independence Measure
- SF
Short forms
Footnotes
Publisher's Disclaimer: This is a PDF file of an unedited manuscript that has been accepted for publication. As a service to our customers we are providing this early version of the manuscript. The manuscript will undergo copyediting, typesetting, and review of the resulting proof before it is published in its final citable form. Please note that during the production process errors may be discovered which could affect the content, and all legal disclaimers that apply to the journal pertain.
Contributor Information
Allen W. Heinemann, Center for Rehabilitation Outcomes Research, Rehabilitation Institute of Chicago and Department of Physical Medicine and Rehabilitation, Feinberg School of Medicine, Northwestern University, 345 E. Superior St. Chicago, IL 60611, USA.
Marcel P. Dijkers, Research Professor of Rehabilitation Medicine, Icahn School of Medicine at Mount Sinai, One Gustave Levy Place, Box 1240, New York NY 10029-6574 USA.
Pengsheng Ni, Health and Disability Research Institute, Boston University School of Public Health, 715 Albany ST., T 5W, Boston, MA 02118.
David S. Tulsky, Rusk Institute, Department of Rehabilitation Medicine, and Department of Orthopedic Surgery, Langone Medical Center, 240 E. 38th St, 17th Floor, New York, NY 10015.
Alan Jette, Health and Disability Research Institute, Boston University School of Public Health, 715 Albany ST., T 5W, Boston, MA 02118.
References
- 1.Keith RA, Granger CV, Hamilton BB, Sherwin FS. The functional independence measure: a new tool for rehabilitation. Adv Clin Rehabil. 1987;1:6–18. [PubMed] [Google Scholar]
- 2.Catz A, Itzkovich M, Agranov E, Ring H, Tamir A. SCIM--spinal cord independence measure: a new disability scale for patients with spinal cord lesions. Spinal Cord. 1997;35:850–856. doi: 10.1038/sj.sc.3100504. [DOI] [PubMed] [Google Scholar]
- 3.Gresham GE, Labi ML, Dittmar SS, Hicks JT, Joyce SZ, Stehlik MA. The Quadriplegia Index of Function (QIF): sensitivity and reliability demonstrated in a study of thirty quadriplegic patients. Paraplegia. 1986;24:38–44. doi: 10.1038/sc.1986.7. [DOI] [PubMed] [Google Scholar]
- 4.Marino RJ. Neurological and functional outcomes in spinal cord injury: review and recommendations. Topics in Spinal Cord Injury Rehabilitation. 2005;10:51–64. [Google Scholar]
- 5.Dawson J, Shamley D, Jamous MA. A structured review of outcome measures used for the assessment of rehabilitation interventions for spinal cord injury. Spinal Cord. 2008;46:768–780. doi: 10.1038/sc.2008.50. [DOI] [PubMed] [Google Scholar]
- 6.Bent LM, Mulcahey MJ, Kelly EH, Calhoun CL, Tian F, Ni P, Vogel LC, Haley SM. Validity of computer adaptive tests of daily routines for youth with spinal cord injury. Top Spinal Cord Inj Rehabil. 2013;19:104–113. doi: 10.1310/sci1902-104. [DOI] [PMC free article] [PubMed] [Google Scholar]
- 7.Tulsky DS, Jette AM, Kisala PA, Kalpakjian C, Dijkers MP, Whiteneck G, Ni P, Kirshblum S, Charlifue S, Heinemann AW, Forchheimer M, Slavin MD, Houlihan B, Tate DG, Dyson-Hudson T, Fyffe DG, Williams S, Zanca J. Spinal cord injury-functional index: item banks to measure physical functioning in individuals with spinal cord injury. Arch Phys Med Rehabil. 2012;93:1722–1732. doi: 10.1016/j.apmr.2012.05.007. [DOI] [PMC free article] [PubMed] [Google Scholar]
- 8.Jette AM, Tulsky DS, Ni P, Kisala PA, Slavin MD, Dijkers MP, Heinemann AW, Tate DG, Whiteneck G, Charlifue S, Houlihan B, Williams S, Kirshblum S, Dyson-Hudson T, Zanca J, Fyffe D. Development and initial evaluation of the spinal cord injury-functional index. Arch Phys Med Rehabil. 2012;93:1733–1750. doi: 10.1016/j.apmr.2012.05.008. [DOI] [PubMed] [Google Scholar]
- 9.Slavin MD, Kisala PA, Jette AM, Tulsky DS. Developing a contemporary functional outcome measure for spinal cord injury research. Spinal Cord. 2010;48:262–267. doi: 10.1038/sc.2009.131. [DOI] [PubMed] [Google Scholar]
- 10.Cella D, Riley W, Stone A, Rothrock N, Reeve B, Yount S, Amtmann D, Bode R, Buysse D, Choi S, Cook K, Devellis R, DeWalt D, Fries JF, Gershon R, Hahn EA, Lai JS, Pilkonis P, Revicki D, Rose M, Weinfurt K, Hays R, Promis Cooperative Group The Patient-Reported Outcomes Measurement Information System (PROMIS) developed and tested its first wave of adult self-reported health outcome item banks: 2005-2008. J Clin Epidemiol. 2010;63:1179–1194. doi: 10.1016/j.jclinepi.2010.04.011. [DOI] [PMC free article] [PubMed] [Google Scholar]
- 11.Choi SW, Reise SP, Pilkonis PA, Hays RD, Cella D. Efficiency of static and computer adaptive short forms compared to full-length measures of depressive symptoms. Qual Life Res. 2010;19:125–136. doi: 10.1007/s11136-009-9560-5. [DOI] [PMC free article] [PubMed] [Google Scholar]
- 12.Thissen D, Nelson L, Rosa K, McLeod L. Item response theory for items scored in more than two categories. In: Thissen D, Wainer H, editors. Test scoring. L. Erlbaum Associates; Mahwah, N.J.: 2001. pp. 141–186. [Google Scholar]
- 13.Granger CV, Albrecht GL, Hamilton BB. Outcome of comprehensive medical rehabilitation: measurement by PULSES profile and the Barthel Index. Arch Phys Med Rehabil. 1979;60:145–154. [PubMed] [Google Scholar]
- 14.Hall KM, Cohen ME, Wright J, Call M, Werner P. Characteristics of the Functional Independence Measure in traumatic spinal cord injury. Arch Phys Med Rehabil. 1999;80:1471–1476. doi: 10.1016/s0003-9993(99)90260-5. [DOI] [PubMed] [Google Scholar]
- 15.Marino RJ, Huang M, Knight P, Herbison GJ, Ditunno JF, Jr., Segal M. Assessing selfcare status in quadriplegia: comparison of the Quadriplegia Index of Function (QIF) and the Functional Independence Measure (FIM) Paraplegia. 1993;31:225–233. doi: 10.1038/sc.1993.41. [DOI] [PubMed] [Google Scholar]
- 16.Middleton JW, Harvey LA, Batty J, Cameron I, Quirk R, Winstanley J. Five additional mobility and locomotor items to improve responsiveness of the FIM in wheelchair-dependent individuals with spinal cord injury. Spinal Cord. 2006;44:495–504. doi: 10.1038/sj.sc.3101872. [DOI] [PubMed] [Google Scholar]
- 17.van Tuijl JH, Janssen-Potten YJ, Seelen HA. Evaluation of upper extremity motor function tests in tetraplegics. Spinal Cord. 2002;40:51–64. doi: 10.1038/sj.sc.3101261. [DOI] [PubMed] [Google Scholar]
- 18.Watson AH, Kanny EM, White DM, Anson DK. Use of standardized activities of daily living rating scales in spinal cord injury and disease services. Am J Occup Ther. 1995;49:229–234. doi: 10.5014/ajot.49.3.229. [DOI] [PubMed] [Google Scholar]
- 19.Yavuz N, Tezyurek M, Akyuz M. A comparison of two functional tests in quadriplegia: the quadriplegia index of function and the functional independence measure. Spinal Cord. 1998;36:832–837. doi: 10.1038/sj.sc.3100726. [DOI] [PubMed] [Google Scholar]
- 20.Anderson K, Aito S, Atkins M, Biering-Sorensen F, Charlifue S, Curt A, Ditunno J, Glass C, Marino R, Marshall R, Mulcahey MJ, Post M, Savic G, Scivoletto G, Catz A, Functional Recovery Outcome Measures Work Group Functional recovery measures for spinal cord injury: an evidence-based review for clinical practice and research. J Spinal Cord Med. 2008;31:133–144. doi: 10.1080/10790268.2008.11760704. [DOI] [PMC free article] [PubMed] [Google Scholar]
- 21.Marino RJ, Goin JE. Development of a short-form Quadriplegia Index of Function scale. Spinal Cord. 1999;37:289–296. doi: 10.1038/sj.sc.3100772. [DOI] [PubMed] [Google Scholar]
- 22.Heinemann AW, Linacre JM, Wright BD, Hamilton BB, Granger C. Measurement characteristics of the Functional Independence Measure. Topics in Stroke Rehabilitation. 1994 doi: 10.1080/10749357.1994.11754030. [DOI] [PubMed] [Google Scholar]
Associated Data
This section collects any data citations, data availability statements, or supplementary materials included in this article.


