

Abstract
Background and aims
For patients with end-stage liver disease commonly used indices of nutritional status (i.e. body weight and BMI) are often inflated due to fluid overload (i.e. ascites, peripheral edema) resulting in an underdiagnosis of malnutrition. As muscle is the largest protein reservoir in the body, an estimate of muscle mass may be a more reliable and valid estimate of nutritional status.
Methods
Therefore, we used pre-transplant computerized tomography data of 338 liver transplant (LTX) candidates to identify muscle and fat mass based on a specific abdominal transverse section commonly used in body composition analyses and investigated the contribution of this measure to specific post-LTX outcomes.
Results
We found the majority, 68%, of our patients could be defined as cachetic. For men muscle mass predicted many important post-transplant outcomes including intensive care unit (ICU) and total length of stay and days of intubation. Muscle mass was a significant predictor of survival and also predicted disposition to home vs another facility. For women muscle mass predicted lengths of ICU and total stay and days of intubation but the effect was modest. Muscle mass did not predict survival or disposition for women.
Conclusions
As pre-transplant muscle mass was associated with many important post-operative outcomes we discuss these findings in the context of possible pre-transplant interventions to either improve or sustain muscle mass before surgery.
Keywords: radiologic assessment, assessment of liver transplant candidates, body composition, liver transplant outcomes
While protein energy malnutrition (PEM) is associated with poor post-operative recovery, can contribute to risks for specific medical outcomes (e.g. poor wound healing, infections), and is a reliable prognostic indicator of survival in liver transplantation (LTX) most researchers and clinicians agree that end-stage liver disease (ESLD) complicates estimating both PEM using biological markers and body composition using BMI. While a subjective assessment of nutritional status is preferred to evaluate the nutritional status of LTX patients, evidence of PEM may be difficult to appreciate on clinical exam unless marked muscle wasting is obvious. In one study, both subjective global assessment and a model using traditional parameters (albumin, muscle circumference, and lymphocytes) underdiagnosed the nutritional depletion of patients with cirrhosis (1). For patients with liver disease commonly used indices of nutritional status (i.e. body weight and BMI) are often inflated due to fluid overload (i.e. ascites, peripheral edema) resulting in an underdiagnosis of malnutrition.
Because muscle is the largest protein reservoir in the body, accounting for 60% of total-body protein content, an estimate of muscle mass may be a more reliable and valid estimate of PEM. In renal disease, using muscle mass to gauge nutritional status has been shown to be a reliable indicator of protein-energy malnutrition and clinical outcome (2). While some methods for assessing fat-free mass (i.e. arm/thigh circumference measurements or impedance testing) are simple and less cumbersome, these methods are less accurate (3) for reasons similar to BMI inaccuracies (fluid overload, peripheral edema). Nutritional parameter abnormalities including hypoalbuminemia do not necessarily correlate with muscle mass depletion (1).
In medically ill populations, computerized tomography (CT) scanning provides an exact measure of muscle mass and is proven more valid than externally measured muscle circumference (2). CT images can be combined with mathematical reconstruction algorithms to estimate the mass of individual muscle groups or total body skeletal muscle mass. Additionally, CT radiographs provide direct visualization to accurately measure the total muscle area as well as subcutaneous and visceral fat areas allowing their easy elimination from the muscle mass measurement. The ability to directly visualize tissue compartments and to compare both muscle and fat mass makes the method of muscle mass determination by CT especially valuable to the assessment of patients with liver disease.
A recent study of wait listed LTX candidates using CT scan data of muscle mass from a specific abdominal transverse section commonly used in body composition analyses showed that low muscle mass predicted survival on the waitlist (4). We were interested in examining whether body composition as determined by CT scan data and particularly muscle mass would be associated with outcomes following liver transplantation. Because most LTX candidates will have abdominal radiographic imaging as part of their transplant evaluation we believed CT scan data would be readily available as part of routine clinical care. In addition we chose to examine the abdominal transverse section which is the standard for body composition analyses. We hypothesized that a substantial number of LTX candidates would have moderate to severe muscle loss and this would predict outcomes following transplantation during the recovery period and beyond.
Methods
Study Sample
From January 2005 to December 2008, 488 adults underwent first transplant, liver only, at the Starzl Transplant Institute. During the pre-transplant evaluation patients undergo abdominal computerized tomography (CT) scans and these digital scans were archived in our electronic medical record system. Following an IRB approved protocol we examined these records and found available CT scans for 338 LTX recipients (69%). The remaining recipients were not eligible due to: (a) a digital copy of the CT scan was not in their records, (b) they underwent MRI instead of CT, or (c) the abdominal scan did not reach the lumbar section required for the body composition calculations.
Measures
Baseline Medical Variables
Medical variables of interest were obtained from the medical records (including demographic data, height/weight, creatinine, total protein, albumin, type of liver disease and Model for End-Stage Liver Disease – MELD – score at the point of LTX). We chose CT scan, laboratory data, and BMI calculations closest to the date of LTX. CT scans were not routinely repeated on the date of LTX. Thus data on time between CT scan in days to LTX were also collected (Median = 80 days, IQR = 32 – 159 days).
The Charlson Comorbidity index is a commonly used index of medical comorbidity (5). The index uses 22 co-morbid medical conditions (e.g. cardiovascular disease, diabetes, renal disease, etc) to predict mortality where mortality for each disease was converted to a relative risk of death within 12 months. A summary score is created from the weighted relative risks of the comorbid illnesses and was calculated for each patient from all of their medical co-morbidities documented in the medical record up to the point of transplant.
Computerized Tomography Scans
Radiographic CT scans are converted into digital images produced by the Stentor™ Picture Archive and Communications System that creates high quality, reliable data even better than film as CT technology is inherently digital. We chose a section of measurement commonly used to study medical illnesses, the L3-4 transverse section. A radiology technician retrieved the CT scan data and chose the transverse section closest to the L3-4 disc space based on a spinal scout film.
Body Composition Analyses
To perform the body composition analyses we used the SliceOmatic® software (by TomoVision Magog, Quebec, Canada) software developed for and used extensively by researchers in body composition who need accurate analysis of body composition. SliceOmatic® has powerful edge and line tracking tools to quickly outline tissue planes and mathematical morphology to perform tissue segmentation. In particular, specific tissues are demarcated using Hounsfield unit (HU) thresholds. We chose three compartments of interest; visceral fat, subcutaneous fat and total muscle. Adipose tissues were identified and quantified by using HU thresholds of −190 to −30 for both subcutaneous and visceral adipose (6, 7). Skeletal muscle was identified by HU thresholds of 0 to +100 (6, 8). These measurements were computed by summing the tissue pixels and multiplying by pixels surface area. At the L3-4 transverse section muscle groups include rectus abdominis, pyramidalis, transversus abdominis, internal and external obliques, lattissimus dorsi, quadratus lumborum, psoas major and minor, and erector spinae (see Figure 1 for example of scan data and colorization demonstrating different body compartments). Cross sectional areas are reported in cm2. Two research assistants trained to reliability with the SliceOmatic® software using a training program measured all of the body compartment data. A random sample of scans was re-computed by each assistant and an expert in SliceOmatic® software and comparisons of body compartments achieved intraclass correlations of 0.94–0.97. Using the SliceOmatic® software the approximate time to generate the muscle, visceral and subcutaneous fat measurements at the L3-4 section is about 8 minutes.
Figure 1.
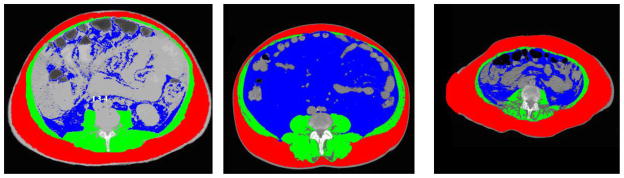
Examples of Body Composition Analysis at L3-4 Transverse Section
Legend for Sliceomatic screen images: red is subcutaneous fat, blue is visceral fat and green is muscle. Speckling in the muscle may represent fatty infiltration
First Image. 55 yo male ALD, BMI 20, total fat 294, MELD 20, muscle/height 43 (cachetic), LOS 58 days
Middle Image. 66 yo male HBV/HCC, BMI 34, total fat 806 MELD 9, muscle/height 56.7 (not cachetic), LOS 26 then to skilled nursing facility,
Last Image. 60 yo female with NASH, BMI 30, muscle/height 27.5 (cachetic), total fat 360, MELD 24, died during hospitalization at 21 days
Outcome Variables
We retrieved medical record data on specific outcomes of interest (length of intensive care unit (ICU) stay, total hospitalization in number of days, number of days on a ventilator) and patient and graft survival post-LTX. We also gathered information on the disposition of the patient at discharge (home, nursing/medical or rehabilitation facility, or deceased during transplant hospitalization).
Statistical Analyses
Creation of variables and descriptive statistics
We found no difference in age, gender, race, BMI or MELD score between those who were included in the study and those without CT scan data. BMI was computed from weight divided by height squared. Muscle mass determined on the CT scan L3-4 transverse section is linearly related to whole body muscle mass (9) and, as is conventional for BMI and other body composition analyses, was normalized for height using the ratio L3-4 skeletal muscle in cm2 divided by height in m2 and reported in units of cm2/m2. The height correction is necessary to determine relative muscle mass as muscle is highly correlated with height (2) but in a linear fashion such that there are not differences in effect when adjusting for shorter or taller individuals (10). In studies of cancer patients using L3-4 transverse CT scan data established cutoffs for cachexia are ≤38.5 cm2/m2 for women and ≤52.4 cm2/m2 for men (11) using optimal stratification with gender specific cutoffs associated with mortality. We additionally used the cancer and serial CT scan literature to estimate the potential loss of muscle mass to determine the implications for post-LTX outcomes. In cancer research 10–15% decreases in muscle mass are seen over 6–9 month periods and an exponential rate of muscle loss over time has been observed (11, 12). To illustrate the clinical relevance of muscle loss on outcomes analogous to what is observed in the cancer literature, we conservatively chose a 10% decrease in muscle mass to calculate the impact on our outcomes of interest.
Analytic plan
The cohort analyses were performed separately for men and for women due to differences between genders on height and muscle mass. For each gender, poisson regression was performed to examine whether each length of stay outcome (total hospital stay, ICU, number of intubation days) was predicted by total muscle after adjusting for covariates (patient and donor age, Charlson score, MELD score, and hepatitis C –HCV). For the poisson regression statistics, the pseudo R for the total model as well as the increase in pseudo R calculated for the addition of total muscle over and above the other covariates are reported. Poisson regression analysis is analogous to the multiple correlation for a set of predictors obtained in linear regression where 0 equals no relationship and 1 equals perfect relationship. Cox regression was performed to examine whether the likelihood of death was predicted by total muscle after adjusting for covariates. Multinomial logistic regression was performed to examine whether patient disposition at discharge was predicted by total muscle after adjusting for covariates.
Results
Total cohort
The cohort was predominately white men age 55 ± 10 years. The most common liver disease was HCV (36% primary or secondary). Table 1 provides gender comparisons on demographic, medical, and body composition variables. Using the thresholds of cachexia in cancer patients defined above, 68% of our cohort was cachetic. Table 2 shows percent cachetic by liver diagnosis with alcoholic liver disease having the largest percentage (80%) compared to other diagnoses. Additionally although 80% of normal weight individuals were cachetic, 62% of those classified as overweight were also cachetic (Figure 2).
Table 1.
Demographic, Medical Characteristics, and Body Composition with Gender Comparisons
| Total | Male (n=223) | Female (n=115) | Test statistic, p value* | |
|---|---|---|---|---|
| Demographics | ||||
| Age, M (SD) | 55 (10) | 55 (10) | 56 (10) | 0.4 |
| Race, % white | 94 | 91 | 99 | ** |
| Medical Variables - M (SD) | ||||
| MELD score | 20 (8.6) | 20 (9) | 19 (8) | 1.5 |
| Albumin | 3 (0.6) | 3.1 (0.6) | 2.9 (0.5) | 4.1* |
| Creatinine | 1.4 (1.2) | 1.5 (1.2) | 1.3 (1.1) | 0.87 |
| Charlson Comorbidity score | 5.8 (2) | 5.9 (2.2) | 5.6 (2.2) | 1.94 |
| Donor age, years | 48 (18) | 48 (17) | 47 (21) | 0.02 |
| Cold Ischemic Time, minutes | 554 (219) | 558 (215) | 547 (226) | 0.21 |
| Hepatitis C infection, % yes | 36 | 43 | 23 | 13.7*** |
| Liver Disease Diagnoses % | ||||
| HCV/HBV | 27 | 31 | 18 | 6.25* |
| Alcohol | 23 | 27 | 15 | 6.7* |
| Alcohol and HCV/HBV | 9 | 13 | 2 | *** |
| NASH | 14 | 10 | 21 | 7.8** |
| Autoimmune/PSC/PBC | 12 | 7 | 22 | 13.9*** |
| Fulminant failure | 4 | 0.5 | 10 | *** |
| All others | 11 | 11 | 12 | 2.11 |
| Body Composition - mean (SD) | ||||
| BMI | 28 (6) | 28 (5) | 29 (7) | 0.65 |
| % Obese BMI ≥30 | 34 | 31 | 40 | 2.27 |
| Height cm | 173 (10) | 178 (7) | 163 (7) | 346*** |
| Weight kg | 85 (19) | 89 (16) | 76 (20) | 40.8*** |
| Visceral Fat cm2 | 154 (100) | 163 (97) | 138 (106) | 4.98** |
| Subcutaneous Fat cm2 | 226 (125) | 217 (122) | 242 (141) | 2.87 |
| Total Fat cm2 | 379 (196) | 378 (190) | 379 (209) | 0.01 |
| Total Muscle cm2 | 132 (33) | 148 (27) | 102 (19) | 252*** |
| Muscle cm2/height m2 | 43.8 (9.3) | 46.5 (8.9) | 38.5 (7.5) | 67.7*** |
| Cachetic†, % yes | 68 | 76 | 51 | 23*** |
Significant at <0.05,
at <0.01,
at <0.001 (test statistic not reported for Fischer’s exact test)
As defined in text
Table 2.
Liver Disease Diagnoses: % Cachetic
| Fulminant | 31 |
| Autoimmune/PSC/PBC | 60 |
| HCV/HBV | 61 |
| NASH | 63 |
| Alcohol and HCV/HBV | 71 |
| Alcohol | 80 |
| All others* | 82 |
Includes hepatocellular carcinoma
Figure 2.

Venn diagram of BMI Classes and Percent Cachetic
The median total hospital length of stay was 15.0 days; with 5.5 ICU days and 2.0 intubation days (see Table 3). While 59% of the patients were sent home, 32% required further post-hospitalization treatment in a longer term medical facility, physical rehabilitation unit or nursing home. Over the period of follow-up mean 1021.2 days (SD = 499.9), 26% of the patients died.
Table 3.
Descriptive Statistics of Outcomes of Interest.
| Variable | Mean | Median | SD |
|---|---|---|---|
| Length of follow up (days) | 1021.2 | 1151.0 | 499.9 |
| Length of survival for deceased (days) | 393.2 | 173 | 447.3 |
| Total LOS (days) | 23.6 | 15.0 | 23.5 |
| ICU LOS (days) | 13.5 | 5.5 | 19.9 |
| Intubation Days | 8.8 | 2.0 | 16.1 |
| Categories | Percent | ||
| Current Status | Deceased | 26.0% | |
| Disposition | Death during hospitalization | 9.2% | |
| Home | 58.9% | ||
| Medical facility, Rehab, or Nursing Home | 31.9% |
Outcome prediction by muscle mass for males
Tables 4–6 show that total muscle and the covariates (patient age, donor age, Charlson score, MELD, and HCV) were, as a group, significant predictors of many outcomes.
Table 4.
Poisson regression of length of stays by total muscle and covariates.
| Gender | Variable | Total LOS B |
ICU LOS B |
Intubation Days B |
|---|---|---|---|---|
| Male | Patient Age | −.01*** | −.002 | .01** |
| Donor Age | .01*** | .01*** | .01*** | |
| Charlson | .06*** | .07*** | .07*** | |
| MELD pre-treatment | .04*** | .06*** | .06*** | |
| HCV | .14*** | .14** | .20*** | |
| Total Muscle/Height2 | −.02*** | −.03*** | −.03*** | |
| Pseudo R (total model)α | .49 | .50 | .47 | |
| Increase in Pseudo R¥ | .16 | .17 | .16 | |
|
| ||||
| Female | Patient Age | .01 *** | .002 | −.002 |
| Donor Age | −.003* | −.003* | −.001 | |
| Charlson | .01 | .07 *** | .09 *** | |
| MELD pre-treatment | .02 *** | .03 *** | .02 *** | |
| HCV | −.03 | −.12 | −.08 | |
| Total Muscle/Height2 | −.01 | −.02** | −.02 *** | |
| Pseudo R (total model) α | .27 | .27 | .23 | |
| Increase in Pseudo R¥ | .04 | .05 | .08 | |
Pseudo R is analogous to a multiple correlation in linear regression for a set of predictors
Increase by adding total muscle over and above the covariates
Significant at <0.05,
at <0.01,
at <0.001
Table 6.
Multinomial logistic regression predicting disposition by total muscle and covariates.
| Variable | Male RRα |
Female RRα |
|
|---|---|---|---|
| Death during hospitalization vs. Home | Patient Age | 1.00 | .93 |
| Donor Age | 1.01 | 1.03 | |
| Charlson | 1.03 | 1.70* | |
| MELD pre-treatment | 1.08* | 1.12* | |
| HCV | .80 | .82 | |
| Total Muscle/Height2 | .97 | .97 | |
| Hospital/Nursing Home vs. Home | Patient Age | 1.04 | 1.07* |
| Donor Age | 1.01 | .98 | |
| Charlson | 1.08 | .85 | |
| MELD pre-treatment | 1.13*** | 1.15*** | |
| HCV | .76 | .73 | |
| Total Muscle/Height2 | .96* | .95 | |
| Pseudo R (total model) | .38 | .47 | |
| Increase in Pseudo R¥ | .11 | .09 |
Relative Risk
Significant at <0.05,
significant at <0.001
Increase by adding total muscle over and above the covariates
There was a significant prediction of total hospital length of stay [χ2(6, N = 211) = 1250.09, p < .001], number of days spent in the ICU [χ2(6, N = 219) = 1257.09, p < .001], as well as the number of days of intubation by total muscle and the covariates [χ2(6, N = 219) = 902.57, p < .001]. Even after controlling for the covariates, less muscle predicted significantly longer duration for each outcome (see Table 4). As shown by the pseudo R values and change to pseudo R with the addition of total muscle, the overall correlation of the set of predictors with the outcomes were moderate, and the addition of muscle mass added modestly to the ability to predict the outcomes. For men a 10% increase in muscle mass (i.e., an increase of 4.65 for the average man) would translate into a 9% decrease in total length of stay (i.e. exp(−0.020 × 4.65) = 0.9), a 12% decrease in ICU length of stay (i.e. exp(−0.027 × 4.65) = 0.88), and a 13% decrease in days of intubation (i.e. exp(−0.029 × 4.65) = 0.087). Importantly this would translate into a 1 to 2 day shorter stay in each of these areas of the hospital.
The set of commonly used covariates in post-LTX survival (age, donor age, MELD, HCV infection and Charlson comorbidity index), plus muscle mass, were significantly associated with the likelihood of death [χ2(6, N = 211) = 17.94, p = .006]. Less muscle predicted poor survival such that each unit less of muscle resulted in a 5% increased risk of death. For men a 10% increase in muscle mass would decrease the likelihood of death by 22% (i.e. 0.95 4.65 = 0.78). The Charlson comorbidity index was the only other significantly predictive variable in the model (see Table 5). Controlling for hepatocellular carcinoma (HCC) did not change these results.
Table 5.
Cox regression of survival by total muscle and covariates
| Variable | Male | Female | ||
|---|---|---|---|---|
| HRα | p | HRα | p | |
| Patient Age | 1.02 | .333 | .98 | .435 |
| Donor Age | 1.01 | .202 | 1.01 | .447 |
| Charlson Comorbidity | 1.16 | .034 | 1.21 | .056 |
| MELD | 1.03 | .159 | 1.01 | .644 |
| HCV | 1.66 | .127 | 1.34 | .496 |
| Total Muscle/Height2 | .95 | .011 | .98 | .554 |
| Pseudo R£ | .19 | .14 | ||
| Increase in Pseudo R¥ | .12 | .03 | ||
Note: Controlling for HCC did not change the results
Hazard Ratios
Pseudo R is analogous to a multiple correlation in linear regression for a set of predictors
Increase by adding total muscle over and above the covariates
The set of covariates plus muscle mass also predicted patient disposition [total model χ2(12, N = 219) = 52.37, p < .001, see Table 6]. Although muscle mass itself did not independently predict the likelihood of dying during the post-LTX hospitalization rather than being sent home, it did predict being sent to another medical facility or nursing home rather than being sent home (p=0.04). A 10% increase in muscle mass would decrease by 18% the likelihood of going to a medical facility or nursing home rather than to home (i.e. 0.96 4.65 = 0.82). Overall, correlations between the set of predictors and each outcome (pseudo R’s) were moderate, with the addition of muscle adding modestly to the correlations.
Outcome prediction by muscle mass for females
Similar to males, there was a significant prediction of total hospital length of stay (χ2(6, N = 115) = 140.02, p < .001), days in the ICU (χ2(6, N = 115) = 172.98, p < .001), and days of intubation (χ2(6, N = 115) = 129.09, p < .001) by muscle and the covariates (see Table 4). For females HCV did not predict any outcome while most covariates were significant for some outcomes. However muscle mass was a significant predictor of longer duration for ICU and intubation days but added modestly to the overall model. For example for females a 10% increase in muscle mass would decrease the total length of stay by 3% (i.e. exp(−0.006 × 3.85) = 0.97), ICU length of stay by 4% (i.e. exp(−0.010 × 3.85)= 0.96), and intubation days by 7% (i.e. exp (−0.017 × 3.85)= 0.93).
In addition, in contrast to males, for females muscle mass did not predict a greater likelihood of death (see, Table 5). Muscle mass for females also did not predict discharge disposition -- whether it was dying during the transplant hospitalization or being sent to a medical facility/nursing home compared to going home (see Table 6).
In comparison, BMI did not predict any of the patient outcomes we examined. Using the body composition data we also examined whether fat mass or ratios of fat to muscle mass were associated with outcomes. We found neither visceral fat, subcutaneous fat, total fat, total fat/height2, total fat/total muscle, nor any of the fat compartments corrected for height were associated with our outcomes.
Discussion
As moderate to severe PEM exists in up to 60% of patients with cirrhosis (1) these patients will commonly be encountered as LTX candidates. Finding the best method to accurately measure malnutrition proves difficult and typically used measures such as BMI are often imprecise specifically due to elements of liver disease. We believed there was a more direct method for determining muscle mass that could be computed quickly with existing data and patterned our investigations from work in other medically ill populations where CT scan technology was used to identify and define malnutrition and cachexia. A prior study using CT scan data of a single muscle, the psoas, found sarcopenia was highly and significantly correlated with post-LTX survival (13). We believed more representative body composition measurements could be made from pre-LTX CT scan data and could be used to estimate muscle mass using a specific transverse abdominal cross-section and standardized algorithms. We additionally hypothesized that muscle mass would predict a variety of outcomes following LTX. We based this on the accumulating evidence that low muscle mass prior to transplant, across all organ types, is associated poor muscle recovery post-transplant (14). We considered malnutrition and low muscle mass to be potentially modifiable factors that could be addressed prior to transplantation.
We demonstrated the ability to use pre-LTX CT scan data to estimate body muscle mass and found the majority, 68%, of our patients pre-LTX could be defined as cachetic. This is substantially higher than the 41% found by Tandon et. al (4) perhaps because our CT scans were closer to the point of LTX such that our patients were more decompensated as reflected by our higher mean MELD scores (20 vs. 15). More importantly we showed these data can predict important immediate, short and long term post-operative outcomes for LTX recipients. We identified that especially for men, incremental increases in muscle mass, as determined by our hypothetical example, may result in decreases in time spent in the ICU and total hospital length of stay and can positively impact post-transplant disposition and ultimately survival. While no studies to date have examined serial CT measurements in LTX patients to identify increases or decreases in muscle, one study of pancreatic cancer patients found the overall decrease of skeletal muscle was −3.1 ± 12.0%/100 days with the lowest tertile losing muscle at a rate of −12.7 ± 5.2%/100 days (6). In our calculations we analyzed the effect of a 10% muscle increase (4.65 cm2/height m2) contributing to decreasing specific hospital lengths of stay. If liver disease advances at a rate similar to cancer patients, within a matter of 6–9 months a liver transplant candidate could lose critical muscle mass predicting a much more extended hospital stay. This suggests that increasing muscle mass or even preventing additional loss could decrease lengths of stay and improve other outcomes. Interestingly, contrary to common concerns over obese LTX candidates, we did not find that fat predicted any of our outcomes. The next logical step in this work is to demonstrate for LTX candidates with low muscle mass, significant increases are obtainable and can be achieved expeditiously enough to be worthwhile goals during the pre-LTX wait period.
Interestingly, we found a different pattern of results between men and women with respect to the importance of muscle mass on outcomes. A similar finding was noted in wait-listed LTX candidates where the L3 skeletal muscle index predicted 3 and 6 month survival for men but not women (15). While both men and women undergo age-related muscle loss associated with decline in testosterone levels, men undergo a larger lifetime loss of muscle mass and strength, a process undoubtedly accentuated by liver disease and the concomitant lowering of testosterone. While it was not less muscle that explained our observed gender differences (and we did not examine the pathophysiology or the functional status of muscle), one supposition is that the muscle mass in men may be affected by hormonal changes such that in men the muscle may also become less functional as liver disease progresses. An additional consideration is the gender differences in liver diseases with women having more autoimmune diseases and NASH while men had more viral and alcohol related liver diseases. Additionally men had significantly more visceral fat while women had more subcutaneous fat (not significant). While we could not control for all liver diseases, in the analysis we did control for HCV which is known to contribute significantly to post-LTX survival. However differences in the location of compartmental body fat and its association with outcomes requires further investigation.
While we could have used other levels of transverse section, the L3-4 transverse section is the standard section for body composition analyses allowing comparisons to a growing literature on body composition in other types of medical illnesses. A complete body composition can be created from a total body scan such that the adjustment for height would not be required. However we strove to identify a method that could both be used with existing data and be applicable to the typical clinical practice of obtaining an abdominal scan, not a total body scan, during LTX evaluation. We used thresholds of cachexia derived from investigations of cancer patients which may not apply to patients with cirrhosis. In the future using larger samples it would be important to derive specific muscle mass cut points for patients with end-stage liver disease that are associated with poor outcomes. Additionally our median time from the CT scan to the date of LTX was 2.8 months. With ESLD a patient’s status can change rapidly affecting body habitus. This is a limitation of our study design. We did additional analyses correcting for the time from CT scan to LTX and found no difference in our survival results. There may have been a selection bias based on the availability of scans however we did obtain nearly 70% of the scans of the cohort transplanted within our time frame and note that there were no differences in key demographics between those in the study and those without CT scan data. Additionally we did not know the breakdown of reasons why scans were not available and this would be important to future clinical applications. For example some patients had an MRI instead of CT scan and for future clinical applications if clinicians trend towards MRIs to reduce radiation exposure the ability to analyze MRI data will be critical. The final limitation is the possible impact of unmeasured covariates. However we chose the covariates that are routinely examined in studies of LTX outcomes and considered to be the top predictors of outcomes.
We envision the next step as employing pre-LTX interventions to improve muscle mass on the wait list and examining CT scan muscle mass data as the outcome measure. Nutritional interventions have been successfully used in patients with cirrhosis but not specifically for LTX candidate or examining LTX outcomes. One intervention targeting nutrition, rather than muscle mass, in a small study of 15 post-operative LTX recipients showed nutritional supplementation significantly improved the restoration of body protein and reduced the incidence of post-LTX infections (16). A recent review of the literature on exercise capacity in patients with cirrhosis identified two studies suggesting exercise training was well tolerated in patients with cirrhosis (17). Whether an exercise intervention could be tolerated and successful for patients with ESLD, especially with portal hypertension and risk for gastrointestinal bleeding, requires further investigation.
Our work is beginning to highlight the importance of muscle mass to transplant outcomes but may be too preliminary to suggest threshold for clinical decision making with regard to LTX candidacy. We believe the next step would be to examine changes in muscle mass over time to determine if a critical threshold exists after which post-LTX recovery will be poor. However of the factors that impact post-LTX outcomes PEM is one of the few modifiable factors that could be addressed by a proactive intervention targeting muscle mass and malnutrition. To evaluate the success of such an intervention requires a method to accurately measure muscle mass. Finally these data may provide useful information in combination with other medical co-morbidities and known risk factors to create a risk profile for the individual. Modifiable factors could then be chosen for interventions with subsequent modeling to demonstrate the reduction of risk. We believe our work lends to the greater understanding of those factors and ways to manage risk.
Acknowledgments
This research is funded by grant R01 DK066266 and an administrative supplement NOT-OD-09-056N to the R01 both from the National Institute of Digestive Disorders and Kidney Diseases Rockville, MD and by grant 5UL1 RR024153-04 from the National Center for Research Resources (NCRR), a component of the National Institutes of Health (NIH), and NIH Roadmap for Medical Research. Its contents are solely the responsibility of the authors and do not necessarily represent the official view of NIDDK, NCRR or NIH. Information on NCRR is available at http://www.ncrr.nih.gov/.
List of Abbreviations
- BMI
Body Mass Index
- CT
Computerized tomography
- ESLD
End-stage liver disease
- HBV
Hepatitis C cirrhosis
- HCV
Hepatitis C cirrhosis
- HU
Hounsfield unit
- ICU
Intensive Care Unit
- IQR
Interquartile range
- IRB
Institutional Review Board
- LTX
Liver transplant
- MELD
Model for End-Stage Liver Disease
- MRI
Magnetic Resonance Imaging
- NASH
Non-alcoholic steatohepatitis
- PEM
Protein energy malnutrition
- PSC
Primary Sclerosing Cholangitis
- PBC
Primary Biliary Cirrhosis
- SD
Standard Deviation
Footnotes
The contents do not reflect the views of the Department of Veterans Affairs or the United States Government.
The authors of this manuscript have no conflicts of interest to disclose
Author Contributions (author’s names in initials):
Study concept and design: AD, RC, MAD, BG, PF
Acquisition of data: AD, RC, BG, KF
Analysis and interpretation of data: AD, RC, MAD, LM, BG, KF, KK, PF
Drafting of the manuscript: AD, RC, MAD, LM, BG, KF, KK, PF
Statistical analysis: AD, RC, MAD, LM, KK
References
- 1.Figueiredo FA, Perez RM, Freitas MM, Kondo M. Comparison of three methods of nutritional assessment in liver cirrhosis: subjective global assessment, traditional nutritional parameters, and body composition analysis. J of Gastro. 2006;41(5):476–82. doi: 10.1007/s00535-006-1794-1. [DOI] [PubMed] [Google Scholar]
- 2.Ohkawa S, Odamaki M, Yoneyama T, et al. Standardized thigh muscle area measured by computed axial tomography as an alternate muscle mass index for nutritional assessment of hemodialysis patients. Am J Clin Nutr. 2000;71(2):485–490. doi: 10.1093/ajcn/71.2.485. [DOI] [PubMed] [Google Scholar]
- 3.Marquis K, Debigare R, Lacasse Y, et al. Midthigh muscle cross-sectional area is a better predictor of mortality than body mass index in patients with chronic obstructive pulmonary disease. Am J Respir Crit Care Med. 2002;166:809–813. doi: 10.1164/rccm.2107031. [DOI] [PubMed] [Google Scholar]
- 4.Tandon P, Ney M, Irwin I, et al. Severe Muscle Depletion in Patients on the Liver Transplant Wait List: Its Prevalence and Independent Prognostic Value. Liver Transpl. 2012;18:1209–1216. doi: 10.1002/lt.23495. [DOI] [PubMed] [Google Scholar]
- 5.Charlson ME, Pompei P, Ales KL, MacKenzie CR. A new method of classifying prognostic comorbidity in longitudinal studies: development and validation. J Chron Dis. 1987;40(5):373–383. doi: 10.1016/0021-9681(87)90171-8. [DOI] [PubMed] [Google Scholar]
- 6.Tan B, Birdsell LA, Martin L, Baracos VE, Fearon KCH. Sarcopenia in an Overweight or Obese Patient Is an Adverse Prognostic Factor in Pancreatic Cancer. Clin Cancer Res. 2009;15:6973–6979. doi: 10.1158/1078-0432.CCR-09-1525. [DOI] [PubMed] [Google Scholar]
- 7.Vehmas T, Kairemo KJ, Taavitsainen MJ. Measuring visceral adipose tissue content from contrast enhanced computed tomography. Int J Obes Relat Metab Disord. 1996;20:570–3. [PubMed] [Google Scholar]
- 8.Mitsiopoulos N, Baumgartner RN, Heymsfield SB, et al. Cadaver validation of skeletal muscle measurement by magnetic resonance imaging and computerized tomography. J Appl Physiol. 1998;85:115–22. doi: 10.1152/jappl.1998.85.1.115. [DOI] [PubMed] [Google Scholar]
- 9.Mourtzakis M, Prado CM, Lieffers JR, et al. A practical and precise approach to quantification of body composition in cancer patients using computed tomography images acquired during routine care. Appl Physiol Nutr Metab. 2008;33:997–1006. doi: 10.1139/H08-075. [DOI] [PubMed] [Google Scholar]
- 10.Janssen I, Heymsfield SB, Wang Z, Ross R. Skeletal muscle mass and distribution in 468 men and women aged 18–88 yr. J Appl Physiol. 2000;89:81–88. doi: 10.1152/jappl.2000.89.1.81. [DOI] [PubMed] [Google Scholar]
- 11.Prado CM, Lieffers JR, McCargar LJ, et al. Prevalence and clinical implications of sarcopenic obesity in patients with solid tumours of the respiratory and gastrointestinal tracts: a population-based study. Lancet Oncol. 2008;9:629–35. doi: 10.1016/S1470-2045(08)70153-0. [DOI] [PubMed] [Google Scholar]
- 12.Lieffers JL, Mourtzakis M, Hal KD, et al. A viscerally driven cachexia syndrome in patients with advancedcolorectal cancer: contributions of organ and tumor mass to whole-body energy demands. Am J Clin Nutr. 2009;89:1173–9. doi: 10.3945/ajcn.2008.27273. [DOI] [PMC free article] [PubMed] [Google Scholar]
- 13.Englesbe MJ, Patel SP, He K, et al. Sarcopenia and Mortality after Liver Transplantation. J Am Coll Surg. 2010;211:271–278. doi: 10.1016/j.jamcollsurg.2010.03.039. [DOI] [PMC free article] [PubMed] [Google Scholar]
- 14.Williams TJ, McKenna MJ. Exercise Limitation Following Transplantation. Compr Physiol. 2012;2:1937–1979. doi: 10.1002/cphy.c110021. [DOI] [PubMed] [Google Scholar]
- 15.Montano–Loza AJ, Meza–Junco J, Prado CMM, et al. Muscle wasting is associated with mortality in patients with cirrhosis. Clin Gastroenterol Hepatol. 2012;10:166–173. doi: 10.1016/j.cgh.2011.08.028. [DOI] [PubMed] [Google Scholar]
- 16.Plank LD, McCall JL, Gane EJ, et al. Pre- and postoperative immunonutrition in patients undergoing liver transplantation: a pilot study of safety and efficacy. Clin Nutr. 2005;24(2):288–96. doi: 10.1016/j.clnu.2004.11.007. [DOI] [PubMed] [Google Scholar]
- 17.Jones JC, et al. Exercise capacity and muscle strength in patients with cirrhosis. Liver Transpl. 2012;18(2):146–51. doi: 10.1002/lt.22472. [DOI] [PubMed] [Google Scholar]