

Abstract
Brown adipose tissue (BAT) is the primary tissue responsible for nonshivering thermogenesis in mammals. The amount of BAT and its level of activation help regulate the utilization of excessive calories for thermogenesis as opposed to storage in white adipose tissue (WAT) which would lead to weight gain. Over the past several years, BAT activity in vivo has been primarily assessed by positron emission tomography-computed tomography (PET-CT) scan using 2-[18F]-fluoro-2-deoxy-D-glucose (18F-FDG) to measure glucose utilization associated with BAT mitochondrial respiration. In this study, we demonstrate the feasibility of mapping and estimating BAT volume and metabolic function in vivo in rats at a 9.4T magnetic resonance imaging (MRI) scanner using sequences available from clinical MR scanners. Based on the morphological characteristics of BAT, we measured the volume distribution of BAT with MRI sequences that have strong fat–water contrast. We also investigated BAT volume by utilizing spin-echo MRI sequences. The in vivo MRI-estimated BAT volumes were correlated with direct measurement of BAT mass from dissected samples. Using MRI, we also were able to map hemodynamic responses to changes in BAT metabolism induced pharmacologically by β3-adrenergic receptor agonist, CL-316,243 and compare this to BAT activity in response to CL-316,243 assessed by PET 18F-FDG. In conclusion, we demonstrate the feasibility of measuring BAT volume and function in vivo using routine MRI sequences. The MRI measurement of BAT volume is consistent with quantitative measurement of the tissue ex vivo.
INTRODUCTION
Obesity develops when calorie intake exceeds energy expenditure, with the extra energy stored in fat. Over the past couple of decades, researchers identified psychological and physiological factors attributing to food consumption, including the appetite-regulating hormones leptin, ghrelin, peptide-YY, etc. Among those factors, adipose tissue (i.e., fat) plays an active role in weight regulation, not just an energy storage depot (1,2).
Adipose tissue is metabolically and hormonally active, capable of releasing free fatty acids and producing numerous hormones and adipokines, such as leptin, adiponectin, tumor necrosis factor-α, interleukin-6 (IL-6), and retinol binding protein-4 (RBP-4), all of which are important in regulating food intake, energy balance, and insulin sensitivity (3). At least two distinguishable forms of fat have been identified: white adipose tissue (WAT) and brown adipose tissue (BAT). White adipocytes are large spherical cells (30–200 μm) that store lipids in unilocular droplets, whereas brown adipocytes are smaller polyhedral cells (20–40 μm) that store lipids in multilocular droplets. BAT is also notable for containing numerous mitochondria and a rich blood supply (4). Mitochondria in BAT utilize the cell-specific protein uncoupling protein-1 (UCP-1) to dissipate the intermembrane proton-motive force to generate heat (5–8). BAT is important for the maintenance of core body temperature in the setting of ambient temperatures below thermoneutrality in a process known as nonshivering thermogenesis, and in certain circumstances BAT may also be stimulated to consume excess calories through diet-induced thermogenesis (9). This ability to consume large amounts of ingested lipids and glucose (10) suggests that BAT may play an important role in whole-body energy balance.
Despite the morphological differences, WAT and BAT are not readily distinguishable with in vivo medical imaging. In general WAT and BAT have similar X-ray absorption coefficients in a single computed tomography (CT) or X-ray scan. Thus CT and X-ray in general can only be used to locate the total adipose tissue. However, a recent CT study described variation in the Hounsfield units of BAT following its activation (11). A key breakthrough for studying in vivo BAT activity was using combined positron emission tomography (PET)-CT scans (12–14). The CT scans identify the total amount of fat whereas PET scans with 2-[18F]-fluoro-2-deoxy-D-glucose (18F-FDG) identify BAT via the high glucose utilization associated with high metabolic activity. However, the need for using ionizing radiation and the requirement of BAT to be stimulated detract from widely applying PET-CT for longitudinal studies in humans. Furthermore, PET-CT measurement for BAT activation is known to have a wide variability within a given subject over time. Also interpretation can be difficult since differences in the 18F-FDG signal can represent differences in BAT volume or BAT stimulation. Thus, in vivo imaging approaches that are capable in detecting BAT volume and metabolic activity separately will be essential in understanding clinical disorders of energy balance such as obesity and metabolic syndrome, as well as BAT research. Magnetic resonance imaging (MRI), which does not use ionizing radiation, would be an ideal tool for estimating BAT volume and distribution longitudinally, noninvasively, and with minimal risk (15–17). In addition, functional MRI (fMRI), a tool already used for accessing brain activity, could be used to access BAT metabolic activity.
There have been many efforts to evaluate BAT volume and distribution using in vivo MR techniques, including MR spectroscopy (MRS) (15,18,19), MRI, and a combination of the two, such as chemical shift imaging (see detail discussion in ref. (16)). These MR studies were based on the fact that BAT differs from WAT by the fraction of saturated fatty acids, diunsaturated fatty acids (15), and water content (15,16,19). However, most of these MR studies used tailored sequences to distinguish BAT and WAT, requiring extensive post-processing of the data. Here, we demonstrate the feasibility of mapping and estimating BAT volume and metabolic function in vivo using MR sequences available in most clinical MR scanners. We used multiple MR sequences to capture BAT volume and distribution in rodents which have distinguishable interscapular BAT (IBAT) lumps. We utilized MRI sequences sensitive to water-fat content to generate high tissue contrast between BAT and WAT. Previous work reported the use of the Dixon method for distinguishing BAT and WAT (16,17). T1- and T2-weighted MR images were also reported to be useful for the detection of BAT in newborn babies (20,21). We focused our investigation on the use of fast-spin echo (FSE) which is routinely used in clinical scanners and had not been reported previously for BAT imaging. (i) With its high water content, the MR signal of BAT remains visible even with fat saturation (22)—a phenomenon we examined with fat-saturation efficiency. (ii) BAT with a heterogeneous tissue composition, high iron content in the mitochondria and rich vasculature, may contribute to a reduced T2 value. The impact of magnetic field susceptibility on T2 is a topic which had been studied extensively in the literature (23–25). We examined T2 values of BAT and WAT with a multi-echo spin-echo sequence (MESE). (iii) BAT with a rich vasculature would have greater blood perfusion—a phenomenon we examined based on the contrast produced by a long half-life MR blood-pool contrast agent monocrystalline iron oxide nanocolloid (MION).
We also demonstrated that BAT activity could be assessed by fMRI. fMRI detects metabolic activity via measuring hemodynamic changes associated with oxygenation demand. Although fMRI is traditionally used for neuronal activity, it is equally powerful for detecting metabolic activity in non-brain organs, including BAT. BAT requires glucose and oxygen to be delivered rapidly through the bloodstream when BAT mitochondria are activated. We used fMRI to monitor hemodynamic response to changes in BAT metabolism induced pharmacologically by β3-adrenergic receptor agonist CL-316,243.
METHODS AND PROCEDURES
Animals
Adult Spraque-Dawley rats (eight males and one female, 240–500 g) were used in this study. Rats were anesthetized with sodium pentobarbital throughout the whole imaging session (initial dose 50–75 mg/kg intraperitoneally, followed by 20 mg/kg, intraperitoneally every 30 min starting 1 h after the initial dose). At the end of imaging session, rats were sacrificed and locations of BAT and WAT were inspected visually. WAT and IBAT tissues were dissected, weighed, and processed for measurement of messenger RNA (mRNA) expression. The volume of IBAT was estimated by converting tissue weight with BAT density (0.98 g/ml). The BAT density was obtained from a separate group of samples by immersing BAT sample in ethanol (density 0.79 g/ml) for volume estimation. “Apparent” BAT density was also calculated: weightIBAT sample divided by MR-measured IBAT volume.
MRI
MRI studies were carried out using a 9.4T scanner (Bruker, Billerica, MA) with an 1.5 inch home-made surface coil on top of the interscapular area. All MR images were acquired with the same spatial resolution (in-plane resolution 0.234 mm × 0.234 mm, slice thickness 1.0 mm, 15 slices).
FSE sequences
Volume of WAT and BAT were identified by the signal intensity (SI) contrast (threshold SI) of FSE images: repetition time (TR) 2,300 ms, effective echo time (TE) 56 ms, eight segmentations (i.e., eight encoding echoes), field of view was 3 cm by 3 cm, with 128 by 128 encoding steps, 20 slices with 1 mm thickness, number of averages was four. No fat saturation (FATS) was applied.
Fat-saturation efficiency
Fat-saturation efficiency was measured by the degree of FSE signal changes with and without fat saturation.
T2 values
T2 values were mapped using conventional MESE (TR 3,000 ms, initial TE 9.5 ms with 9.5 ms increments, eight echoes, single full encoding segmentation). The T2 measurement study had the same slice prescription and spatial resolution as in the FSE experiment. Number of averages was one.
Blood perfusion
MION is a MR contrast agent with long blood pool half-life (>6 h) (26). Blood perfusion was determined by contrasting SI from the pair of FSE images before and after MION injection (15 mg/kg, intravenously). MION was provided by the core biochemistry laboratory (led by Dr Anna Moore) in the A. Martino’s Center for Biomedical Imaging.
BAT activity
Increased BAT activity was induced pharmacologically by CL-316,243, a β3-adrenergic receptor agonist. fMRI study was carried out right after the “blood perfusion” study. A total of 60 FSE time points were acquired repetitively (FSE parameters were the same as the anatomical scan, except that the number of average per time point was 1 to yield temporal resolution of 37.5 s per image set). CL-316,243 (0.1 mg/kg, intravenously) was administered at the 20th time point. The degree of activation was evaluation according to Villringer et al. (27). fMRI activation was generated by general linear model on a pixel-by-pixel basis by fitting the whole time course to a basis function describing the hemodynamic changes.
Tissue segmentation
Tissue segmentation was carried out in the fat regions only, excluding the subcutaneous fat layer. Histogram from all fat areas was used to determine the threshold value to segregate BAT and WAT. The radial signal decay associated surface coil was precorrected in the case of analyzing FSE signal contrast (assuming that the signal decay was proportional to the square of distance from the isocenter of the coil).
PET imaging procedures
18F-FDG PET imaging studies were conducted in a separate group of rats. PET imaging was carried out using MicroPET, P4 (spatial resolution 1.8 mm × 1.8 mm × 1.25 mm; Concord Microsystems, Knoxville, TN). PET studies consisted two imaging sessions, 2 days apart. The first imaging session assessed basal glucose utilization, and the second session assessed glucose utilization upon CL-316,243 challenge. A blood sample collected from the tail tip was used to determine blood glucose value before administration of radioactivity. Rats received saline (baseline study) or CL-316,243 (0.1 mg/kg, intravenously) injection followed by 18F-FDG (300–400 μCi) injection right before the 90 min acquisition of volumetric dynamic data sets. PET images were corrected for photon attenuation using information obtained from an image of an external rotating 57Co pin (28). Images were reconstructed using filtered back projection and ramp filter with a cut-off value of 0.5 and were corrected for uniformity, sensitivity, attenuation, decay, injected activity, and acquisition time. Glucose utilization was estimated from the measured time-activity curves at the steady state level (60 min after administration of the ligand). The average percent activity of the injected radioactivity (time interval 60–90 min) was corrected for the animal weight to obtain standardized unit values (29).
mRNA
BAT and WAT tissues were collected and snap frozen in liquid nitrogen and stored at −80 °C. Total cellular RNA was extracted from tissue using an RNeasy minikit (Qiagen, Valencia, CA) according to instructions. Quantity and purity were assessed by ultraviolet absorbance between 260 and 280 nm. cDNA was prepared from 6 ng/μl of RNA using the High Capacity cDNA Reverse Transcription kit (Applied Biosystems, Foster City, CA) according to the manufacturer’s instructions; 2.5 μl (15 ng) of cDNA was used in a 10 μl PCR (SYBR Green; PE Biosystems, Foster City, CA) containing primers for TATA box binding protein (TBP) forward 5′-GAA TAA GAG AGC CAC GAA CAA CTG -3′ and reverse 5- CCC AGC TTC TGC ACA ACT CT -3′, UCP-1 forward 5′-TCC CTC AGG ATT GGC CTC TAC -3′ and reverse 5′-GTC ATC AAG CCA GCC GAG AT -3′, and leptin forward 5′-TTT CAC ACA CGC AGT CGG TAT C -3′ and reverse 5′-GGT CTG GTC CAT CTT GGA CAA -3′ at a concentration of 10 μmol/l each. PCRs were run in duplicates and quantitated in the ABI Prism 7700 sequence detection system (Applied Biosystems). The values were normalized to the expression of TBP, and results were expressed as ratios in arbitrary units.
RESULTS
MRI detection of BAT volume
MRI was used to distinguish BAT from WAT based on two principle features: (i) BAT has a higher water-to-fat ratio and (ii) BAT is comparatively rich in mitochondria and blood vessels, giving it a higher magnetic field susceptibility within the tissue.
(1) FSE sequence
MRI sequences sensitive to water-fat content such as FSE or Dixon (16) are useful for distinguishing BAT and WAT. We focused our investigation on the use of FSE, which has not been reported previously for BAT imaging. Figure 1 shows the measurement of BAT volume via FSE signal contrast in a rat in the basal state. Although both BAT and WAT were bright in FSE, the SI was less bright in BAT than in WAT, consistent with BAT having less water than WAT but more than muscle, which appears dark in FSE. Thus, BAT volume could be segmented by contrasting SI (i.e., signal thresholding method).
Figure 1.

Use of FSE to distinguish BAT from WAT. (a) Fast-spin echo (FSE) shows great signal contrast between WAT and BAT, with hyperintensity in WAT and hypointensity in BAT. FSE images identified two primary BAT lumps (arrow heads) in the interscapular area, immediately beneath a sheet of WAT. FSE images also identified to side BAT wings (arrows). Note that FSE with the chosen echo time is insensitive to muscle signal. (b) Example of WAT and BAT segmentation, according to threshold in signal intensity (BAT and WAT are indicated by solid boundaries). Showing in the figure is a representative result of a single rat, from a pool of nine animals. (c) Fat saturation routine is less efficient for BAT, due to the higher water content. Thus, BAT volume (areas in gray tone) can be segmented according to fat saturation efficiency (online version of article indicates degree of fat saturation in color scale). The underlay is a non-FATS FSE image. BAT, brown adipose tissue; FATS, no fat saturation; WAT, white adipose tissue.
With FSE images, we identified two major IBAT masses under a triangular sheet of WAT in the interscapular area (Figure 1a, triangles) and two deeper lateral BAT “wings” (Figure 1a, arrows). IBAT visualized by MRI imaging was proven to be BAT at postmortem dissection (Figure 2), which were positive for UCP-1 mRNA expression (UCP-1 for BAT was 515.00 ± 89.86 and for WAT was 2.13 ± 1.21, n = 7.). UCP-1 levels varied widely among the “wings,” consistent with their having a mixture of BAT and WAT. We hence focused our MRI volume quantification on the major IBAT masses only.
Figure 2.
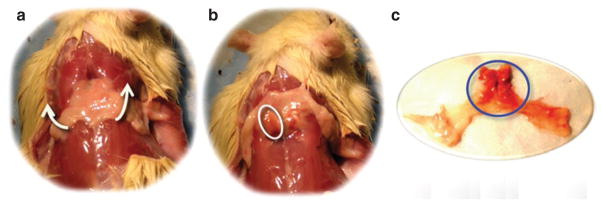
Two primary IBAT masses are located underneath the triangular WAT sheet. (a) Triangle WAT sheet in the interscapular area. (b) IBAT (circled) can be seen by flipping the WAT sheet upward. (c) Fat tissue dissection showed WAT (yellow tissue) and BAT (brown tissue, circled). BAT, brown adipose tissue; IBAT, interscapular BAT; WAT, white adipose tissue.
(2) Fat-saturation efficiency
The high water-to-fat ratio of BAT (22) makes the “fat-saturation” routine less efficient for BAT. Thus, BAT volume could also be segmented according to fat-saturation efficiency, i.e., contrasting SI with and without fat saturation. Figure 1c shows BAT after the portion of fat with high fat saturation efficiency (i.e., WAT) was masked out.
(3) T2 measurement
BAT is expected to have shorter T2 relaxation time due to the high iron content in the mitochondria and the rich vasculature. With MESE, IBAT had significant lower T2 values (57.76 ± 3.92 ms, range 47–74 ms, n = 9) than WAT (83.07 ± 2.20 ms, range 69–99 ms, n = 9, P < 10−6). Figure 3 shows the map of T2 values over BAT and WAT.
Figure 3.

Separate BAT and WAT via T2 evaluation. BAT has short T2 value, due to the heterogeneous tissue contents with higher iron/mitochondrial level and greater vascular population. (a) Map of T2 values of fat, with higher T2 values in WAT and lower T2 values in BAT. (b) Distribution of T2 values for BAT and WAT from all animals. BAT: 57.76 ± 3.92 (ms), WAT: 83.07 ± 2.20. Paired Student’s t-test: P < 10−6. BAT, brown adipose tissue; WAT, white adipose tissue.
(4) Blood perfusion
Since BAT has a much higher metabolic demand even in the basal state compared to WAT, it has more vascularization. Thus, MION, a long-lived MR angiographic contrast agent, can detect BAT via the degree of blood perfusion. Figure 4 shows BAT volume detected via the degree of blood perfusion through a bolus injection of MION. Since the MION method detects blood perfusion, an indirect measurement of BAT volume that confined to blood vessels only. The resulting BAT estimation with MION was less accurate than the other MR measurements.
Figure 4.

Map of blood perfusion over BAT. BAT has significant higher blood perfusion, due to the high vessel distribution. Blood perfusion map was generated by contrasting MR signal intensity before and after MION injection. Color overlay shows fat tissue with high blood perfusion (>6% changes in signal intensity after MION injection), primarily in BAT area. BAT, brown adipose tissue; MION, monocrystalline iron oxide nanocolloid; MR, magnetic resonance; SI, signal intensity.
The MRI estimated volume of the primary IBAT lumps correlated to the body weight (Figure 5a) and partially correlated to the volume from the dissected sample (Figure 5b). Volume estimations for the major IBAT are listed in Table 1, along with weight and equivalent volume obtained from the dissected IBAT tissue. The apparent IBAT density (Weight(sample)/volume(MRI), g/ml) measured by different MR approaches were 1.30 ± 0.12 by FSE signal threshold, 1.38 ± 0.18 by FSE fat saturation, 1.32 ± 0.13 by MESE T2, and 1.75 ± 0.33 by MION.
Figure 5.
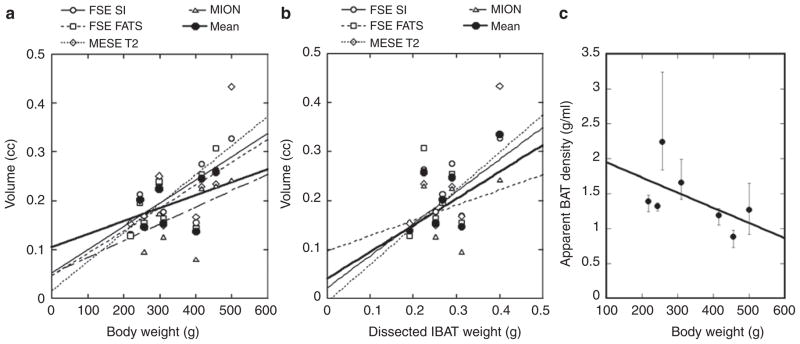
Correlate MR measurement of BAT to body weight and tissue dissection. (a) Correlation between MRI-estimated volume vs. body weight (FSE SI: R > 0.74, FSE fat supp. and MESE T2: R > 0.65, MION: R > 0.5). (b) Correlation between MRI-estimated volume vs. weight of IBAT tissue (FSE SI: R > 0.65, MESE T2: R > 0.79). The conversion of IBAT weight to volume was not exact, as we assumed uniform density of IBAT. The poor correlation between the MION results and IBAT weight may be due to the indirect measurement of blood perfusion by MION, and the relative uncertain factor between IBAT weight and mass. (c) Apparent density of BAT is inversely correlated to body weight. Error bar represents the range of apparent density measurement from the four MRI methods. BAT, brown adipose tissue; FATS, fat saturation; FSE, fast-spin echo; IBAT, interscapular BAT; MESE, multi-echo spin-echo sequence; MION, monocrystalline iron oxide nanocolloid; MRI, magnetic resonance imaging; SI, signal intensity.
Table 1.
Quantitative comparisons between MRI and tissue dissection measurements
| ID | Body weight (g) | Tissue
|
MRI estimation (ml)
|
||||
|---|---|---|---|---|---|---|---|
| IBAT (g) | IBAT (ml)a | FSE SI | FSE FATS | MESE T2 | MION | ||
| 1 | 400 | N/A | N/A | 0.155 | 0.144 | 0.166 | 0.081 |
| 2 | 500 | 0.401 | 0.411 | 0.327 | N/A | 0.434 | 0.243 |
| 3 | 218 | 0.191 | 0.195 | 0.132 | 0.129 | 0.154 | N/A |
| 4 | 310 | 0.251 | 0.257 | 0.177 | 0.163 | 0.150 | 0.126 |
| 5 | 298 | N/A | N/A | 0.234 | 0.240 | 0.251 | 0.173 |
| 6 | 257 | 0.311 | 0.319 | 0.169 | 0.154 | 0.168 | 0.096 |
| 7 | 244 | 0.267 | 0.273 | 0.213 | 0.195 | 0.199 | 0.201 |
| 8 | 455 | 0.225 | 0.230 | 0.263 | 0.307 | 0.234 | 0.230 |
| 9 | 415 | 0.290 | 0.297 | 0.275 | 0.254 | 0.228 | 0.225 |
BAT, brown adipose tissue; FATS, fat saturation; FSE, fast-spin echo; IBAT, interscapular BAT; MESE, multi-echo spin-echo sequence; MION, monocrystalline iron oxide nanocolloid; MRI, magnetic resonance imaging; N/A, not appropriate; SI, signal intensity.
IBAT tissue volume was estimated by converting tissue weight with tissue density (0.98 g/ml).
MRI detection of BAT activity
fMRI detects metabolite activity via measuring hemodynamic changes associated with oxygenation demand. Although fMRI is traditionally used for neuronal activity, it is equally powerful for detecting metabolite activity in non-brain organs, including BAT. BAT requires glucose and oxygen to be delivered rapidly through the bloodstream when BAT mitochondria are activated. We show in Figure 6 the fMRI detection of BAT activity upon challenge with β3-adrenergic receptor agonist (CL-316,243) (30). fMRI demonstrated that blood volume increases locally in BAT, but not in WAT upon challenge with CL-316,243 (0.1 mg/kg, intravenously). These fMRI studies are the very first in vivo imaging studies to capture dynamic BAT activity in living animals.
Figure 6.
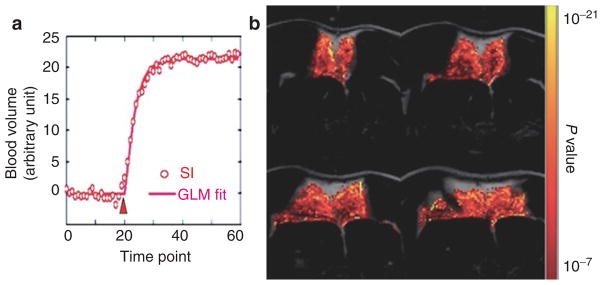
Use fMRI to map IBAT response to a β3-adrenergic receptor agonist, CL-316,243 (0.1 mg/ml, intravenously). (a) Time course for blood volume changes in IBAT. CL-316,243 was injected at the 20th time point (“Δ” ) and led to blood volume increases. (b) The activation map was generated by fitting time courses to a basis function (solid line in a) describing the hemodynamic changes on a pixel-by-pixel basis. BAT, brown adipose tissue; fMRI, functional magnetic resonance imaging; GLM, general linear model; IBAT, interscapular BAT; SI, signal intensity.
PET detection of BAT activity
Glucose utilization was assessed with 18F-FDG in the basal state and after challenge of CL-316, 243 (0.1 mg/kg, intravenously). 18F-FDG accumulation maps are shown in Figure 7. In the basal state, there was significant 18F-FDG accumulation in the heart, but not in BAT. After CL-316,243 challenge, the 18F-FDG accumulation was significantly increased in BAT. However, the signal was greatly reduced in the heart, compared to the basal level. Figure 7c shows the quantitative differences between 18F-FDG accumulation at basal levels and after CL-316,243 challenge among the four rats studied.
Figure 7.
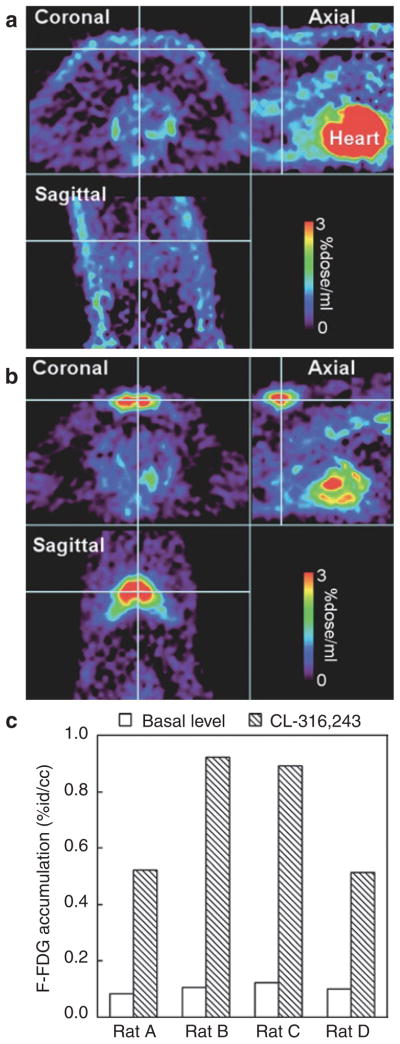
18F-FDG study for BAT activity. (a) At basal level, 18F-FDG accumulation was high in the heart. But there was no significant accumulation in BAT (cross hair). (b) After CL-316,243 challenge (0.1 mg/kg, intravenously), there was a significant 18F-FDG accumulation in BAT (cross hair). The 18F-FDG accumulation in the heart was greatly reduced from the basal level. (c) Quantitative comparison of 18F-FDG accumulation in IBAT at basal level and after CL-316,243 challenge. The color bar presents percent of the injected isotope dose per ml. 18F-FDG, 2-[18F]-fluoro-2-deoxy-D-glucose; BAT, brown adipose tissue; IBAT, interscapular BAT.
DISCUSSION
The IBAT volume estimated by the four commonly used MRI protocols showed good agreement among each other (R > 0.75), but with a coarser correlation with the dissected tissue volume (Figure 5). The lower degree of correlation between MRI measurements and the dissected tissue volumes may due to imperfect volume estimation of the IBAT samples. We assumed a general tissue density (0.98 g/ml) to convert IBAT weight to volume. In addition, IBAT often contains WAT since various amounts of leptin mRNA were detected in IBAT. Using leptin-to-UCP-1 ratio as the weighting factor in the regression analysis, we obtained a higher correlation coefficient between MRI and tissue volumes (FSE SI: R > 0.8, FATS: R > 0.44, T2*: R > 0.75, MION perfusion: R > 0.6), although the mRNA levels of leptin and UCP-1 may not be fully correct to represent the volume fraction of WAT and BAT. We also expected variation of BAT density across animals and thus the use of a single density value to convert weight to volume would also reduce the correlation between the BAT sample and MR measurement. Interestingly, all apparent IBAT density showed values greater than 0.98 g/ml, the standard BAT density we employed for converting BAT mass to volume. The discrepancy is likely due to underestimation of volume by the MRI method, especially near at the border of BAT and WAT. An additional analysis on the apparent density showed an inverse correlation between body weight and the apparent BAT density (Figure 5c, error bar representing the range of apparent density measurement from the four MRI methods).
With MESE, we estimated that the T2 value for WAT is 83.07 ± 2.20 ms (69–99 ms), whereas for BAT it is significantly lower at 57.76 ± 3.92 ms (47–74 ms). A lower T2 value is expected in BAT due to the heterogeneous tissue composition, the high iron content in the mitochondria and the rich vasculature. Similar lower T2 values for BAT have been reported by Hu et al. (16) in analysis of dead animals (WAT: 9–20 ms, BAT: 11–50 ms) using a gradient echo sequence. Much shorter T2 values in both BAT and WAT are expected in carcasses, majorly due to changes in blood composition (16). Furthermore, the lower T2 values could due to species differences (i.e., rat vs. mouse). Beside T2, T2* is another parameter that has the potential to distinguish BAT and WAT. However, the gradient echo sequence that usually used for obtaining T2* values caused too much MR signal loss at 9.4T, and we were not able to obtain accurate T2* estimation in neither BAT or WAT.
Since MRI is highly sensitive to hemodynamic changes, the hypervascularization of BAT provides an opportunity not only to distinguish it from WAT, but also to study BAT metabolic activity. Clinically, gadolinium-enhanced imaging is a routine examination to identify hibernoma, a benign tumor of BAT. Gadolinium, a T1 MR contrast agent, with fast dynamic MR images can capture vascular perfusion within the first blood passage (27). In tumor studies, gadolinium leads to hyper MR-SI due to vascular leakage in the tumor (31,32). However, there is no evidence showing vascular leakage in BAT in healthy normal animals. An alternative to gadolinium is superparamagentic iron oxide nanoparticles (SPION) such as MION, a T2 contrast agent with long blood half-life (>6 h) (26,33), which provides long time window for vasculature imaging. The long blood half-life allows higher number of averages (i.e., require longer acquisition time) for higher signal contrast. As shown in our study, MION indeed led to greater signal changes in BAT than in WAT, indicating hypervascularization in BAT. However, since MION does not leak out of blood vessels, the BAT map established by MION perfusion tends to be spotty compared the other MR approaches. In other words, the MION perfusion method tends to slightly underestimate BAT volume (Table 1). Although some versions of the SPION are approved by Food and Drug Administration (FDA) for angiography, it is yet to be approved as a contrast agent for general MR imaging due to the possibility of iron deposition in the liver. Whether MION can be used in future human BAT study is a work in progress. Thus the SPION approach may be restricted to BAT research in non-human species for the near future.
An additional advantage of using SPION as the MR contrast agent is to boost the fMRI contrast-to-noise ratio (26) that leads to higher statistical confidence in evaluating cell/tissue activity. As showed in Figure 6, CL316,243 led to ~20% fMRI signal changes with MION, compared to the typical 2–10% signal changes with BOLD fMRI at 9.4T. CL316,243, a β3-adrenergic receptor agonist, is known to enhance mitochondrial respiration in BAT (30) and thus a higher demand for oxygenation and blood flow. We used MION in this study to demonstrate the possibility of using fMRI to measure BAT activity in animals, primarily to demonstrate the feasibility of measuring hemodynamic change in responding to BAT activity. The advantage of using MION is to give us a clear picture of the functional responses of BAT. It clearly identifies blood volume changes. With the MION results, we can proceed with more confidence to study parameters such as BOLD which includes information of both flow and volume.
One of our challenges in imaging BAT activity in living small animals is the body motion. Although the body motion could be reduced in postimaging process, the motion correction routine is not as robust for soft tissues (e.g., fat and muscles) compared to brain whose shape is rigidly restrained by skull. Nonetheless, seven out of nine rats we studied remained reasonably still, and we were able to get reliable activation maps upon CL-316,243 challenge in those animals with only minor motion correction. We point out the lack of activation found in muscles upon CL-316,243 challenge (Figure 6). There is a decent amount of evidence to indicate that there is comparatively little β3-adrenergic receptor expression in skeletal muscle. And, muscle has near null SI in the FSE images. Such a hyposensitivity of muscle activation is actually to our advantage to isolate BAT activity in the wholebody imaging.
In conclusion, we demonstrate the feasibility of imaging BAT volume, distribution, and metabolic function, at both dormant and activated states, using MRI sequences available in most clinical scanners. Our team is currently working on translating these protocols to human studies. The animal-human translation will provide additional challenges since human tends to have mixture of BAT and WAT, whereas rodents have purer collections of BAT. Thus, one would need to fine tune parameters in FSE and FATS to achieve maximal signal contrast between BAT and WAT. One would also anticipate a more subtle differences in T2 values between BAT and WAT assuming human BAT is more heterogeneous than the rodent counterpart. Last, MRI measurement of BAT activity would show less contrast-to-noise ratio in human studies because of (i) lower magnetic field strength for human MR scanner and (ii) MION is not currently used for human fMRI. However, MION is clinically used for liver imaging and angiography, so the option to use MION to study blood volume in BAT remains a future possibility. In summary, the use of MRI sequences to estimate BAT volume and activity in our animal model should have direct applicability to the evaluation of human BAT, including its role in metabolism and its potential utility for treating obesity and diabetes.
Acknowledgments
MR contrast agent was synthesized by Anna Moore’s laboratory at the Martino’s Center for Biomedical Imaging. This study was supported by a NIH NIDDK grant 5-RC1-DK087317-02 and K23 DK081604.
Footnotes
DISCLOSURE
The authors declared no conflict of interest.
References
- 1.Kozak LP, Koza RA, Anunciado-Koza R. Brown fat thermogenesis and body weight regulation in mice: relevance to humans. Int J Obes (Lond) 2010;34(Suppl 1):S23–S27. doi: 10.1038/ijo.2010.179. [DOI] [PubMed] [Google Scholar]
- 2.Ravussin E, Kozak LP. Have we entered the brown adipose tissue renaissance? Obes Rev. 2009;10:265–268. doi: 10.1111/j.1467-789X.2008.00559.x. [DOI] [PMC free article] [PubMed] [Google Scholar]
- 3.Galic S, Oakhill JS, Steinberg GR. Adipose tissue as an endocrine organ. Mol Cell Endocrinol. 2010;316:129–139. doi: 10.1016/j.mce.2009.08.018. [DOI] [PubMed] [Google Scholar]
- 4.Cinti S. The adipose organ. Prostaglandins Leukot Essent Fatty Acids. 2005;73:9–15. doi: 10.1016/j.plefa.2005.04.010. [DOI] [PubMed] [Google Scholar]
- 5.Nedergaard J, Golozoubova V, Matthias A, et al. UCP1: the only protein able to mediate adaptive non-shivering thermogenesis and metabolic inefficiency. Biochim Biophys Acta. 2001;1504:82–106. doi: 10.1016/s0005-2728(00)00247-4. [DOI] [PubMed] [Google Scholar]
- 6.Shabalina IG, Kramarova TV, Nedergaard J, Cannon B. Carboxyatractyloside effects on brown-fat mitochondria imply that the adenine nucleotide translocator isoforms ANT1 and ANT2 may be responsible for basal and fatty-acid-induced uncoupling respectively. Biochem J. 2006;399:405–414. doi: 10.1042/BJ20060706. [DOI] [PMC free article] [PubMed] [Google Scholar]
- 7.Matthias A, Ohlson KB, Fredriksson JM, et al. Thermogenic responses in brown fat cells are fully UCP1-dependent. UCP2 or UCP3 do not substitute for UCP1 in adrenergically or fatty scid-induced thermogenesis. J Biol Chem. 2000;275:25073–25081. doi: 10.1074/jbc.M000547200. [DOI] [PubMed] [Google Scholar]
- 8.Rial E, González-Barroso MM, Fleury C, Bouillaud F. The structure and function of the brown fat uncoupling protein UCP1: current status. Biofactors. 1998;8:209–219. doi: 10.1002/biof.5520080307. [DOI] [PubMed] [Google Scholar]
- 9.Cannon B, Nedergaard J. Nonshivering thermogenesis and its adequate measurement in metabolic studies. J Exp Biol. 2011;214:242–253. doi: 10.1242/jeb.050989. [DOI] [PubMed] [Google Scholar]
- 10.Bartelt A, Bruns OT, Reimer R, et al. Brown adipose tissue activity controls triglyceride clearance. Nat Med. 2011;17:200–205. doi: 10.1038/nm.2297. [DOI] [PubMed] [Google Scholar]
- 11.Baba S, Jacene HA, Engles JM, Honda H, Wahl RL. CT Hounsfield units of brown adipose tissue increase with activation: preclinical and clinical studies. J Nucl Med. 2010;51:246–250. doi: 10.2967/jnumed.109.068775. [DOI] [PubMed] [Google Scholar]
- 12.Virtanen KA, Lidell ME, Orava J, et al. Functional brown adipose tissue in healthy adults. N Engl J Med. 2009;360:1518–1525. doi: 10.1056/NEJMoa0808949. [DOI] [PubMed] [Google Scholar]
- 13.van Marken Lichtenbelt WD, Vanhommerig JW, Smulders NM, et al. Cold-activated brown adipose tissue in healthy men. N Engl J Med. 2009;360:1500–1508. doi: 10.1056/NEJMoa0808718. [DOI] [PubMed] [Google Scholar]
- 14.Cypess AM, Lehman S, Williams G, et al. Identification and importance of brown adipose tissue in adult humans. N Engl J Med. 2009;360:1509–1517. doi: 10.1056/NEJMoa0810780. [DOI] [PMC free article] [PubMed] [Google Scholar]
- 15.Strobel K, van den Hoff J, Pietzsch J. Localized proton magnetic resonance spectroscopy of lipids in adipose tissue at high spatial resolution in mice in vivo. J Lipid Res. 2008;49:473–480. doi: 10.1194/jlr.D700024-JLR200. [DOI] [PubMed] [Google Scholar]
- 16.Hu HH, Smith DL, Jr, Nayak KS, Goran MI, Nagy TR. Identification of brown adipose tissue in mice with fat-water IDEAL-MRI. J Magn Reson Imaging. 2010;31:1195–1202. doi: 10.1002/jmri.22162. [DOI] [PMC free article] [PubMed] [Google Scholar]
- 17.Henkelman RM, Hardy PA, Bishop JE, Poon CS, Plewes DB. Why fat is bright in RARE and fast spin-echo imaging. J Magn Reson Imaging. 1992;2:533–540. doi: 10.1002/jmri.1880020511. [DOI] [PubMed] [Google Scholar]
- 18.Branca RT, Warren WS. In vivo brown adipose tissue detection and characterization using water-lipid intermolecular zero-quantum coherences. Magn Reson Med. 2011;65:313–319. doi: 10.1002/mrm.22622. [DOI] [PMC free article] [PubMed] [Google Scholar]
- 19.Hamilton G, Smith DL, Jr, Bydder M, Nayak KS, Hu HH. MR properties of brown and white adipose tissues. J Magn Reson Imaging. 2011;34:468–473. doi: 10.1002/jmri.22623. [DOI] [PMC free article] [PubMed] [Google Scholar]
- 20.Carter BW, Schucany WG. Brown adipose tissue in a newborn. Proc (Bayl Univ Med Cent) 2008;21:328–330. doi: 10.1080/08998280.2008.11928419. [DOI] [PMC free article] [PubMed] [Google Scholar]
- 21.Dundamadappa SK, Shankar S, Danrad R, et al. Imaging of brown fat associated with adrenal pheochromocytoma. Acta Radiol. 2007;48:468–472. doi: 10.1080/02841850701199918. [DOI] [PubMed] [Google Scholar]
- 22.da Motta AC, Tunkel DE, Westra WH, Yousem DM. Imaging findings of a hibernoma of the neck. AJNR Am J Neuroradiol. 2006;27:1658–1659. [PMC free article] [PubMed] [Google Scholar]
- 23.Fisel CR, Ackerman JL, Buxton RB, et al. MR contrast due to microscopically heterogeneous magnetic susceptibility: numerical simulations and applications to cerebral physiology. Magn Reson Med. 1991;17:336–347. doi: 10.1002/mrm.1910170206. [DOI] [PubMed] [Google Scholar]
- 24.Yablonskiy DA, Haacke EM. Theory of NMR signal behavior in magnetically inhomogeneous tissues: the static dephasing regime. Magn Reson Med. 1994;32:749–763. doi: 10.1002/mrm.1910320610. [DOI] [PubMed] [Google Scholar]
- 25.Kennan RP, Zhong J, Gore JC. Intravascular susceptibility contrast mechanisms in tissues. Magn Reson Med. 1994;31:9–21. doi: 10.1002/mrm.1910310103. [DOI] [PubMed] [Google Scholar]
- 26.Chen YC, Mandeville JB, Nguyen TV, et al. Improved mapping of pharmacologically induced neuronal activation using the IRON technique with superparamagnetic blood pool agents. J Magn Reson Imaging. 2001;14:517–524. doi: 10.1002/jmri.1215. [DOI] [PubMed] [Google Scholar]
- 27.Villringer A, Rosen BR, Belliveau JW, et al. Dynamic imaging with lanthanide chelates in normal brain: contrast due to magnetic susceptibility effects. Magn Reson Med. 1988;6:164–174. doi: 10.1002/mrm.1910060205. [DOI] [PubMed] [Google Scholar]
- 28.Lehnert W, Meikle SR, Siegel S, et al. Evaluation of transmission methodology and attenuation correction for the microPET Focus 220 animal scanner. Phys Med Biol. 2006;51:4003–4016. doi: 10.1088/0031-9155/51/16/008. [DOI] [PubMed] [Google Scholar]
- 29.Paley EL, Denisova G, Sokolova O, et al. Tryptamine induces tryptophanyl-tRNA synthetase-mediated neurodegeneration with neurofibrillary tangles in human cell and mouse models. Neuromolecular Med. 2007;9:55–82. doi: 10.1385/nmm:9:1:55. [DOI] [PubMed] [Google Scholar]
- 30.Okuyama C, Sakane N, Yoshida T, et al. (123)I- or (125) I-metaiodobenzylguanidine visualization of brown adipose tissue. J Nucl Med. 2002;43:1234–1240. [PubMed] [Google Scholar]
- 31.Anderson SE, Schwab C, Stauffer E, Banic A, Steinbach LS. Hibernoma: imaging characteristics of a rare benign soft tissue tumor. Skeletal Radiol. 2001;30:590–595. doi: 10.1007/s002560100405. [DOI] [PubMed] [Google Scholar]
- 32.Atilla S, Eilenberg SS, Brown JJ. Hibernoma: MRI appearance of a rare tumor. Magn Reson Imaging. 1995;13:335–337. doi: 10.1016/0730-725x(94)00115-j. [DOI] [PubMed] [Google Scholar]
- 33.Shen T, Weissleder R, Papisov M, Bogdanov A, Jr, Brady TJ. Monocrystalline iron oxide nanocompounds (MION): physicochemical properties. Magn Reson Med. 1993;29:599–604. doi: 10.1002/mrm.1910290504. [DOI] [PubMed] [Google Scholar]