

Abstract
An association between laser printer use and emissions of particulate matter (PM), ozone and volatile organic compounds has been reported in recent studies. However, the detailed physico-chemical, morphological and toxicological characterization of these printer-emitted particles (PEPs) and possible incorporation of engineered nanomaterials into toner formulations remain largely unknown. In this study, a printer exposure generation system suitable for the physico-chemical, morphological, and toxicological characterization of PEPs was developed and used to assess the properties of PEPs from the use of commercially available laser printers. The system consists of a glovebox type environmental chamber for uninterrupted printer operation, real-time and time-integrated particle sampling instrumentation for the size fractionation and sampling of PEPs and an exposure chamber for inhalation toxicological studies. Eleven commonly used laser printers were evaluated and ranked based on their PM emission profiles. Results show PM peak emissions are brand independent and varied between 3000 to 1 300 000 particles/cm3, with modal diameters ranging from 49 to 208 nm, with the majority of PEPs in the nanoscale (<100 nm) size. Furthermore, it was shown that PEPs can be affected by certain operational parameters and printing conditions. The release of nanoscale particles from a nano-enabled product (printer toner) raises questions about health implications to users. The presented PEGS platform will help in assessing the toxicological profile of PEPs and the link to the physico-chemical and morphological properties of emitted PM and toner formulations.
Keywords: Exposure platform, laser printers, nanoparticles, occupational exposures, printer emitted particles
Introduction
The use of printing equipment, such as laser printers and photocopiers, has grown exponentially over the last decade, driven primarily by the substantial increase in the number of home-based businesses in the USA and the use of personal computing (Jamieson, 2012). According to a recent report, the annual production of laser printers was estimated to be about 23 million units a year worldwide, and the number of workers in quick-printing centers in the USA is increasing, with more than 160 000 workers (Dun & Bradstreet Reports, 2011). Aside from exposures at printing centers, there is also the risk of occasional exposures in many other settings, such as schools, hospitals, offices and homes. Thus, it is of growing importance to evaluate printer emissions and to perform a proper science-based risk assessment.
Laser printers (or other printing equipment) utilize a photosensitive drum to attract the toner powder and fuse it on the page with a set of rollers that apply high levels of pressure and heat (Pettersson & Fogden, 2006). There are numerous studies associating the process of printing with emission of particulate matter (PM) and gaseous pollutants, such as semi-volatile organic compounds (sVOCs) and ozone, among others (Barthel et al., 2011; Brown, 1999; Castellano et al., 2012; Kagi et al., 2007; Tang et al., 2012; Wang et al., 2012; Wensing et al., 2006). It was shown that consumer grade printers can increase indoor particle number concentrations from 860 to 38 000 particles/cm3 and emit up to 7.6×10⁹ particles per printed page (Barthel et al., 2011; He et al., 2007). These printer-emitted particles (PEPs) were identified to have an average mobility equivalent particle diameter between 50 and 244 nm and are released via the board cooler, rear of printer, paper tray and toner waste bin (Byeon & Kim, 2012; He et al., 2007; Jiang & Lu, 2010; Kagi et al., 2007; Lee & Hsu, 2007; McGarry et al., 2011; Morawska et al., 2009; Schripp et al., 2008; Wang et al., 2012; Wensing et al., 2008). It is important to note that there is limited literature on the physico-chemical properties of PEPs, and more significantly there is no evidence on the incorporation of engineered nanomaterials (ENMs) in the toner formulation and their possible emission into the air. More specifically, while it is clear that laser printers emit PM, neither their complex chemistry, nor their formation is clearly understood (Byeon & Kim, 2012; Castellano et al., 2012; Jiang & Lu, 2010; Wang et al., 2012). Furthermore, it was shown in many studies that various operational parameters, such as fuser roller temperature, page coverage, printer brand, printer speed and newness of toner cartridge may affect PM emissions (Byeon & Kim, 2012; He et al., 2007).
Undoubtedly, the high levels of PM emissions have undoubtedly raised concerns about possible toxicity, since there is a plethora of historic epidemiological and toxicological evidence linking exposures to ambient particles with adverse health effects (Dockery et al., 1993; Dominici et al., 2006; Perrone et al., 2013; Zhao et al., 2013). The toxicological potential of PEPs is currently poorly understood, but circumstantial evidence continues to grow. A major limitation of some of the current toxicological studies is the use of toner powder particles in both in vitro and in vivo test platforms (Gminski et al., 2011; Morimoto et al., 2005). Several in vivo studies revealed that long-term inhalation exposures using toner powders can cause chronic inflammation and fibrosis in rats and development of lung tumors in rats after intratracheal instillation (Mohr et al., 2005, 2006; Moller et al., 2004). Furthermore, in vitro cellular bioassays using toner powder reported increased levels of reactive oxygen species, cyto- and genotoxicity markers, fibrosis, reduced pulmonary clearance and cell proliferation (Furukawa et al., 2002; Mohr et al., 2005; Morimoto et al., 2005; Slesinski & Turnbull, 2008). The conflicting results from the aforementioned cellular studies might be attributed to variable chemical composition of toner powders (obscured by improper characterization of the test material used in the experiments), a lack of a harmonization protocol for PM liquid suspension preparation and dosimetric considerations. Additionally, toxicological assessment of PEPs using toner particles rather than actually emitted ones does not accurately reflect the actual exposures and properties of PEPs and prohibits interpretation of the findings. Therefore, there is a need to develop exposure generation systems suitable for physico-chemical and toxicological characterization of realistic exposures from printers.
A recent study by the authors on the physicochemical and morphological evaluation of different PM size fractions (PM0.1, PM2.5 and PM10) sampled in photocopy centers revealed for the first time the incorporation of ENMs in the toner formulation for photocopier equipment, which were emitted in high numbers during the photocopying process. Detailed physico-chemical characterization of the emitted aerosol revealed complex chemistry that reflected that of the toner, and contained several nanoscale metals/metal oxides, sVOCs, traces of elemental carbon and a substantial fraction of organic carbon, which comprised 50–70% of the total mass of the aerosol fraction (Bello et al., 2012). More importantly, in a series of both in vitro and in vivo toxicological studies, also performed by our group using size-fractionated PM collected from photocopy centers, revealed the potential of emitted PM to affect the physiology of the lung (Khatri et al., 2013a,b; Pirela et al., 2013), consistent with acute inflammation in upper airways and systemic oxidative stress findings in human volunteers (Khatri et al., 2012). These new toner formulations may pose potential health and safety issues given the hazard uncertainties associated with this class of nanomaterials. The unique physical and chemical properties exhibited by ENMs, which are distinct from those of their micron-sized counterparts, endow them with exceptional performance in consumer products. However, these properties may also be responsible for unique biological effects that can render them unsafe for humans and the environment (Demokritou et al., 2012; Nel et al., 2006; Sotiriou et al., 2014). The possibility that laser printer toner formulations contain ENMs and their potential to be released into the air still remain to be shown.
In this study, an integrated platform suitable for the physico-chemical, morphological and toxicological characterization of realistic PEPs was developed and tested. The developed exposure system was utilized to assess various laser printers in terms of their PM emission profiles and operational parameters. This article is the first of a trilogy of manuscripts describing the integrated exposure platform and the detailed physico-chemical, morphological and toxicological characterization of both PEPs and toner formulations for commonly used laser printers.
Methods
A printer exposure generation system (PEGS) was developed to generate real world PEPs exposures associated with commonly used laser printers. The system is suitable for physico-chemical, morphological and toxicological characterization of PEPs. The PEGS consists of: (a) a glovebox type environmental chamber to house the printers for uninterrupted operation; (b) real-time and time-integrated PM particle sampling and monitoring instrumentation to quantify particle size distribution and collect size-fractionated PEPs for analysis and (c) an animal inhalation exposure system for toxicological evaluation. Figure 1 illustrates the PEGS. In more detail:
Figure 1.
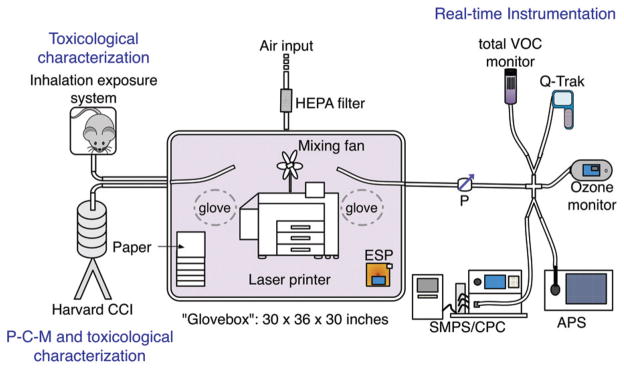
Printer exposure generation system.
Environmental exposure chamber
An environmental exposure chamber with a volume of 0.52m3 was constructed to contain each printer individually during the respective print job evaluation. The chamber was made out of aluminum frames with polyacrylic panels (MiniTec Framing Systems, LLC, Victor, NY), lined with grounded aluminum foil to minimize particle loss. The front panel of the chamber had a pair of neoprene gloves to facilitate handling of printers inside the chamber (e.g. ensure change toner cartridge, add paper, clear paper jams) and ensure uninterrupted operation. The chamber was equipped with a power strip for operation of various instruments inside the chamber and a Universal Serial Bus port that allowed connectivity to a computer outside the chamber in which the monitoring software was used. A modulated-speed, small fan was placed in the back of the chamber for air mixing. Two sampling ports were placed on the center of both side panels for the real-time and time-integrated instrumentation and the sampling tube was extended in the chamber for 20 cm, to sample air from the center of the chamber.
Real-time instrumentation for PM and gaseous pollutants
A water-based condensation particle counter (WCPC Model 3785, TSI Inc., Shoreview, MN) was used to monitor the number concentration of particles sized from 5 to 1000 nm. A scanning mobility particle sizer (SMPS Model 3080, TSI Inc.) was also used to measure the particle size distribution (ranging from 2.5 to 210 nm) in the chamber. An aerodynamic particle sizer (APS Model 3321, TSI Inc.) was used to measure, the particle number concentration as a function of time for particles from 0.5 to 20 μm. In addition to PM data, real-time measurements of environmental conditions in the chamber, including temperature, relative humidity and ozone concentration, were obtained using a Q-Trak (Model 8551, TSI Inc.). Total VOC (tVOC) measurements were also obtained using a photo ionization based system (GrayWolf Sensing Solutions, Shelton, CT) equipped with a sensitive ppb probe. All the instruments were calibrated and background tests were performed at the beginning of each sampling experiment.
Size-selective integrated PM sampling
The Harvard compact cascade impactor (CCI; Demokritou et al., 2004) was used to size fractionate and collect PM samples. The CCI operates with four stages and allows for collection of moderately large amounts of particles (mg level) for the following size fractions: PM2.5–10, PM0.1–2.5 and PM0.1. The main advantage of CCI is the fact that size-fractionated PM is collected on pre-cleaned adhesive-free polyurethane foam (PUF) impaction substrates from which the particles can be efficiently extracted using a water-based protocol (Chang et al., 2013; Demokritou et al., 2002; Khatri et al., 2013a, b; Lough et al., 2005; Pirela et al., 2013).
Animal inhalation exposure system
The BuxCo environmental exposure chamber system, previously described by the authors (Pyrgiotakis et al., 2014), is used to house the animals for inhalation studies. It consists of eight individual cages (PLY42211 V1.0, BuxCo Research Systems, Wilmington, NC) with attached transducers (TRD5700, BuxCo systems) that are connected to the Max II acquisition center (BuxCo systems) and enable monitoring of the breathing pattern of the animals during the aerosol exposure (Reynolds et al., 2008). Please note that the data from the in vivo inhalation part of the study will be included in an upcoming companion paper.
Post-sampling gravimetric analysis of impaction substrates
The PUF impaction substrates and Teflon filter (used to collect the PM0.1 size fraction) from the CCI were weighed pre- and post-sampling following a 48-h stabilization process in a temperature- and humidity-controlled environmental chamber utilizing a Mettler Toledo XPE analytical microbalance as previously described (Bello et al., 2012). Thus, the weight difference was used to determine the collected PEPs mass and the time averaged particle mass concentration in the chamber during the printing episode. All sampling media (Teflon filters and PUF substrates) were pre-cleaned in the laboratory to minimize background contamination following a published protocol (Bello et al., 2012).
Assessing the emission profiles from 11 commonly used laser printers using the PEGS
Printers, paper and toner
Eleven laser printers (two color and nine halftone) were assessed in terms of PEPs emissions using the PEGS platform described above. Printers were selected based on a variety of factors (e.g. marketability, age, model, printer speed) to represent a broad spectrum of possibilities in a university office setting. The printers represent four of the most commercially available manufacturers (A, B, C, and D), and various models from each manufacturer were used. New toner cartridges and the standard white letter paper size (8.5×11 in.) were used for all experiments in this study. Supplementary Table S1 summarizes the information on the printer properties.
Protocol for evaluating PEP profiles
The following protocol was used in the assessment of the PEP emission profiles from each printer. Each printer was placed inside the environmental chamber. HEPA-filtered air was supplied at a flow rate of 30 l/min until the chamber background particle concentration reached approximately 200 particles/cm3. Once this level was attained, the chamber airflow rate was reduced to 5 l/min, which is the total air flow required by the real-time instrumentation. The air change per hour was calculated to be 0.33. The printer was then set to operate continuously for 60 min, printing a single-sided monochrome document with a 5% page coverage. A standard page with a 5% coverage from the International Organization for Standardization and International Electrotechnical Commission was used (ISO.ORG, 2014). During the print job, both real-time aerosol data and size-fractionated PM samples were collected, including measurement of size distribution, particle number and mass concentration, as well as chamber air quality parameters. The size-fractionated PEPs were sampled using the Harvard CCI, and gravimetric analysis was performed on the collected PEPs to calculate the time-integrated particle mass concentration of the PEPs. Printers were ranked based on the maximum particle number concentration during the 60-min print job.
Evaluation of the effect of operational parameters on PEPs profiles
The PEGS was also used to assess the influence of certain operational parameters on the emission characteristics of three randomly selected printers (B1, C5 and C6). Specifically, we tested various page coverages (5%, 25% and 40%), printing of a single- or double-sided page using a 5% page coverage, as well as a continuous and intermittent printing mode using a 5% page coverage. Two printing scenarios for the intermittent mode were used: (a) print 25 pages, pause for a couple of minutes and print the remaining 25 pages; (b) print 17 pages, pause for a couple of minutes and repeat twice until 51 pages were printed.
Calculation of the potential deposition of PEPs in the human lung
The multiple path particle deposition model (Anjilvel & Asgharian, 1995) was utilized to calculate the lung deposition fraction and deposition mass flux of the particles emitted from one of the highest emitting laser printers (printer B1) on the human respiratory system. Supplementary Table S2 summarizes the parameters used in the model. The aerosol size distribution obtained from the real-time monitoring instrumentation measurements described above was used in the model.
Statistical analysis
Raw data from the sampling instruments were imported into a spreadsheet. The database was then exported into SPSS® (v17, SPSS Inc., Chicago, IL) for further data reduction and analysis. All files from the real-time instrumentation were transferred into a new worksheet and standard statistical methods were utilized to obtain the geometric mean (GM), standard deviation and mode of the measurements pertaining to each laser printer tested. Experiments were performed in triplicate. The distributions of the total number concentration and other continuous dependent variables from the real-time instruments were examined graphically via probability plots and histograms. The total number concentration and tVOC were found to be lognormal and subsequently they were log-transformed. All analyses were conducted on the transformed data. Summary aerosol statistics including the geometric mean (GM), geometric standard deviation (GSD) and mode were calculated.
Results
Laser printer ranking in terms of PEPs
Table 1 summarizes the ranking of the 11 printers in terms of the maximum particle number concentration during the 1-h printing episode. The printers with the highest particle emissions are A1 and B1, with maximum particle concentrations close to 1.3 million particles/cm3.
Table 1.
Ranking of the 11 laser printers evaluated based on number of particles emitted during a continuous printing episode.
| Ranking | Printer | Maximum particle number concentration (#/cm3)a |
|---|---|---|
| 1 | A1 | 1.27×10⁶ |
| 2 | B1 | 1.26×10⁶ |
| 3 | B2 | 6.78×10⁵ |
| 4 | C1 | 2.62×10⁵ |
| 5 | C2 | 2.12×10⁵ |
| 6 | C3 | 1.70×10⁵ |
| 7 | C4 | 1.52×10⁵ |
| 8 | C5 | 1.02×10⁵ |
| 9 | C6 | 3.27×10⁴ |
| 10 | D1 | 5.27×10³ |
| 11 | A2 | 2.99×10³ |
Values represent the peak particle number concentration obtained from a 1-h print job for each laser printer.
PEPs profiles for commercial printers
Figure 2 illustrates the particle number concentration of the three highest emitting printers during the 60-min print job (the data on the remaining tested printers are summarized in Supplementary Figure S1). Almost all of the 11 printers showed an “initial burst” emission pattern, evidenced by a transient peak within the first 10–20 min of initiating the print job. For all of the printers, the particle number concentration upon completion of the print job is about 0.2–0.7 times the peak concentration and did not seem to depend on the printer model and consequently, the toner cartridge used. The highest particle number concentration observed was in the order of 1.27 million particles/cm3 by printers A1 and B1, while the lowest was 3000 particles/cm3 by printer A2.
Figure 2.

Total emitted particle number concentration from the three highest emitting printers during a 60-min print job using a 5% page coverage (dashed line represents no data for that particular time point).
Figure 3 shows the size distribution for emitted particles at three different 10-min intervals of the print job: early (10–20 min), middle (30–40 min) and end (50–60 min) for the three highest particle-emitting printers (please refer to Supplementary Figure S2 for data on all other tested printers). A unimodal size distribution is evident throughout the printing job of the majority of printers used, with the exception of two printers (B2 and C5) that had a bimodal distribution. Mean particle diameters ranged from 39 to 138 nm for all printers tested. The majority, if not all, of the particles emitted during the 1-h print job appear to be in nanoscale (<100 nm) and only a minuscule number of particles are larger than 200 nm. However, there are a small number of emitted particles larger than 2 μm. Furthermore, there is a noticeable variation in the mobility diameter of the PEPs at the three different time points of the printing (modal diameter varies from 50 to 110 nm). In particular, printer A1 emits approximately 2.5 times fewer particles at the middle stage rather than the early stage of the print job; and emitted particles were halved at the completion of the job. The printers from the remaining manufacturers had similar size distributions, with higher level of particles emitted early when compared to the end of printing.
Figure 3.

Mean PEP size distribution generated by the three highest particle-emitting laser printers at different time points of a 60-min print job using a 5% page coverage. Graph data shows the GM±GSD at different print job time points.
Figure 4 presents the mass concentration data of the size-fractionated PEPs of the six highest emitting printers based on the gravimetric analysis and CCI. Overall, for most printers, it can be observed that the mass concentration of particles less than 2.5 μm in size is considerably larger than the mass concentration for those particles greater than 2.5 μm in size. In particular, printers C2 and A1 released amounts of PM2.5 as high as 94.71 and 99.81 μg/m3, respectively, for the tested conditions. Generally, PM>2.5 mass concentrations were lower than that of PM2.5 and ranged from 13.18 to 49.41 μg/m3, with the exception of printer B2, which released the largest observed PM>2.5 mass concentration of 49.41 μg/m3.
Figure 4.

Maximum airborne mass concentration of the six highest emitting laser printers during a print job using a 5% page coverage. The printers are graphed in order of increasing number of particles emitted.
Table 2 shows the various indoor environmental parameters measured in the chamber during the printing process. There are no observable differences in temperature or ozone levels for all printers, which ranged from 27.83 to 34.29 °C and 9.54 to 23.84 parts per billion by volume (ppbv), respectively. The average relative humidity and temperature in the chamber was close to that of the ambient environment. Carbon monoxide (CO) levels were very low, while carbon dioxide (CO2) levels varied from 666 to 716 ppm. The levels of tVOCs were measured only during print jobs using the six highest emitting printers, and there was a noticeable increase to mean values of up to 2889 ppb for printer B2, which is the third highest particle emitter. These concentrations are up to 13 times the chamber background levels and are directly proportional to the chamber temperature during the print job. This might also be attributed to VOC emissions associated not only with the printer itself but also with the stack of paper piled in the chamber and used during the printing job.
Table 2.
Measurement of chamber air quality for the 11 laser printers evaluated during a continuous printing episode.
| Printer | Temperature (°C) | RH (%) | Ozone (ppbv) | CO2 (ppm) |
|---|---|---|---|---|
| Background | 24.5±0.80 | 21.8±6.05 | 14.9±5.35 | 715±26.6 |
| A1 | 28.3±2.71 | 55.0±24.7 | 13.7±8.22 | 685±20.8 |
| B1 | 32.3±5.46 | 48.6±12.9 | 13.8±3.87 | 681±21.1 |
| B2 | 34.3±5.51 | 56.8±15.8 | 14.5±8.41 | 682±51.9 |
| C1 | 28.9±2.41 | 39.6±1.62 | 23.9±5.98 | 671±57.8 |
| C2 | 29.3±3.78 | 70.2±24.7 | 20.1±4.10 | 666±34.3 |
| C3 | 28.4±1.90 | 70.6±15.1 | 9.83±1.17 | 716±40.9 |
| C4 | 30.1±1.96 | 77.8±23.4 | 15.0±3.84 | 709±26.3 |
| C5 | 27.8±3.06 | 66.0±25.7 | 16.5±8.98 | 674±24.6 |
| C6 | 77.1±2.42 | 59.9±27.8 | 29.2±10.9 | 683±22.8 |
| D1 | 28.6±2.17 | 64.0±18.7 | 11.5±3.87 | 709±30.1 |
| A2 | 32.3±3.86 | 59.1±17.5 | 9.54±2.53 | 703±24.2 |
Values represent the mean value of each parameter. CO levels remained at 0.00 ppm throughout experiments.
Effect of operational parameters on printer emission profiles
Page coverage
Figure 5 shows an increase in particle number concentration as a function of the page coverage. It is apparent that more particles are emitted as the coverage of the page increments. For instance, the particle emissions ranged from 25 000 to almost 60 000 particles/cm3 for printer C6. However, the 5% page coverage led to higher emissions than the 10% coverage.
Figure 5.

Particle number concentration while printing using different page coverages (5%, 10%, 20% or 40%) using Printer C6.
Single- and double-sided printing
There was no difference in the printer emission profile in single- and double-sided printing (data not shown).
Printing frequency mode
Compared with continuous printing, the intermittent mode led to a reduction of about half the maximum number of emitted particles in printers B1 and C5 (data not shown). As for printer C6, a slight difference in particle concentration was barely noticeable in the two printing scenarios. The data suggest that intermittent printing results in a different number of emitted particles as opposed to continuous printing.
Potential deposition of PEPs in the human lung
Figure 6 shows the modeled deposited mass fraction and mass flux for the various areas of human lung. It can be observed that the majority of the inhaled PEPs would deposit in the respiratory bronchioles and distal alveoli due to their small size. Approximately 30% of the inhaled PEPs would deposit in the lungs. Furthermore, for exposure durations of 8 h, or 60 and 15 min the total lung surface dose is equal to 831.5, 103.9 and 25.99 μg/m2, respectively. These values were derived using the total deposition mass flux of 1.732 μg/minm2 and the corresponding exposure time.
Figure 6.

Deposition of PEPs in the human lung. (A) Deposition fraction and deposition mass flux as a function of generation number of the human respiratory tree. (B) Deposition mass fraction in the total and various sections of the human lung: trachea, bronchus, bronchiole, respiratory bronchioles and distal alveolar region.
Discussion
The data presented illustrate the versatility of the developed PEGS platform and its ability to generate realistic PEP exposures suitable for the physico-chemical and toxicological characterization of PEPs. Data also provide evidence that laser printers emit particles at substantially high levels that can reach particle number concentrations close to 1.3 million particles/cm3 in addition to other pollutants (e.g. ozone, tVOCs). Real-time PM monitoring data also showed that the majority of PEPs are in the nanoscale with very few particles greater than 200 nm. This is in accordance with a study by He et al. (2007), which concluded that approximately 73–99% of the total particles emitted by three different laser printers ranged from 40 to 76 nm. Jiang & Lu (2010) also observed PEPs formed agglomerates of 10–200 nm in size, although the majorities were approximately 80 nm. Interestingly, a study by Byeon & Kim (2012) found the mobility diameter of the emitted particles was directly proportional to the printing speed.
Moreover, the data showed consistently that most of the printers, regardless of the manufacturer and model, had an “initial burst” emission pattern characterized by a transient peak in particle number concentration within the first 10–20 min of printing, followed by a steady decay until completion of printing. This “initial burst” type of emission was also observed in other published studies, and it has been attributed to the rise in temperature of the fuser unit (Barthel et al., 2011; Schripp et al., 2008; Wensing et al., 2008). The intensity of the emission initial particle peak varies with the printer model and manufacturer.
Note that in our experiments using the PEGS platform, some printers emitted PEPs at extremely high levels with particle number concentrations in the order of a million particles/cm3. Such levels are higher than those observed in highly polluted highways (Fuller et al., 2013; Padro-Martinez et al., 2012). Similarly, the PM2.5 mass concentration levels for one of the high emitters (printer A1) was 99.81 μg/m3, which surpasses the Environmental Protection Agency retained 24-h ambient PM standard of 35 μg/m3 (EPA.GOV, 2014). Our findings raise concerns about potential health effects of PEPs given the historic epidemiological and toxicological evidence linking PM exposures to disease (Dockery et al., 1993; Dominici et al., 2006; Perrone et al., 2013; Zhao et al., 2013). Furthermore, the levels of tVOCs in the exposure chamber during the 1-h printing experiment were found to be in the range of 216.7–2889 ppb. These high levels may be due to the fact that high temperatures are used in the printer (up to 225 °C) to fuse the toner powder to the paper (Lee et al., 2001). The temperature and relative humidity in the chamber remained fairly similar amongst the 11 printers, as did the ozone levels, which remained close to background levels and similar to those observed in the literature (He et al., 2010; Lee et al., 2001; McKone et al., 2009). Notably, a modification in the printing technology employed by manufacturers in the past years in order to get rid of the ozone generating corona wire device, which produces the ion field, has led to a dramatically decrease in ozone levels.
Moreover, the data presented illustrate the effect of various operational parameters on the emission pattern. It was shown that there is an association between the number of particles emitted and the page coverage as well as the continuity of the printing. As expected, increasing the page coverage had a direct effect on the number of particles emitted. This is in agreement with another published study (He et al., 2007). Printing double-sided pages led to no real change in the number of particles emitted when compared to single-sided printing. Lastly, the data presented show that continuous versus intermittent printing also affects the number of PEPs. This is in agreement with a similar investigation by Wensing et al. (2008). Even though operational parameters may vary across manufacturers and models, these results provide an understanding of the particle emission trends for various laser printers with different operational settings, which can be helpful in providing insight into how to reduce or prevent the risk of exposure to PEPs.
Due to their nanoscale size the PEPs would make their way deep into the lungs where they are deposited, as indicated in the presented lung deposition data. The potential high deposited doses in the lungs reported here raise concerns for adverse health effects (Bengalli et al., 2013; Michael et al., 2013) as more than 52% of those inhaled particles deposit in the alveoli and 26% in the respiratory bronchioles. Specifically, particle deposition in the lung would be approximately 4 and 16 μg/m2 for 15- and 60-min PEPs exposures, respectively. Considering the average lung has a surface area of approximately 70m2, total dose of exposure now becomes 1115 μg, for a 1-h exposure duration. A major concern when discussing adverse effects of respirable PM is the focus on susceptible populations like asthmatics and elderly, among others (Harkema et al., 2004; Murr et al., 2006). A study by Tanaka et al. (2013) showed exposure to nanoparticle-rich diesel exhaust exacerbated ovalbumin-induced eosinophilic airway inflammation, evidenced by an increase in levels of key cyto-/chemokines and myeloperoxidase release into alveolar spaces. Thus, the potential of high deposited dose of PEPS in the lungs highlights the critical need to fully understand the effects these PEPs on pulmonary response and more importantly the potential health effects on those with preexisting respiratory and cardiovascular conditions.
In summary, the developed PEGS system described here can serve as a test platform for the uninterrupted generation, collection and characterization of physico-chemical and toxicological properties of PEPs. Moreover, this integrated platform will enable researchers to assess the possible health implications of exposures to PEPs, which can in turn aid in the development of control technologies that may reduce or prevent emissions from laser-based printing equipment.
This paper is the first of three companion papers on this emerging health matter. The other two companion papers, which are in preparation, will include detailed information on the chemical composition and morphology of both the toner powder and PEPs from the six highest emitting printers. Lastly, the results from an in vitro and in vivo toxicological characterization of the PEPs from one of the highest emitting printers (printer B1) will be presented in the third companion paper.
Conclusions
Overall, the presented integrated realistic exposure generation platform, i.e. PEGS, is suitable for the physico-chemical, morphological and toxicological characterization of PEPs. It will enable toxicologists to link chemical composition and morphology of toners and PEPs to toxicological outcomes. This integrated approach provides a testing platform for nano-risk assessors to understand the properties of released PM from nano-enabled products and their link to toxicological outcomes and can be used for other nanomaterials. Such a methodological approach will improve our understanding of the potential impact of nano exposures on human health in both occupational and non-occupational settings and generate suitable data for science-based risk assessment.
Supplementary Material
Acknowledgments
The authors thank John Martin for his help with the sampling substrates and other logistics of the study.
Footnotes
Declaration of interest
The authors acknowledge funding for this study from NIEHS Center Grant ES-000002, NIOSH and CPSC (Grant # 212-2012-M-51174).
The findings and conclusions in this manuscript have not been formally disseminated by the NIOSH or CPSC and should not be construed to represent any agency determination or policy.
References
- Anjilvel S, Asgharian B. A multiple-path model of particle deposition in the rat lung. Fundam Appl Toxicol. 1995;28:41–50. doi: 10.1006/faat.1995.1144. [DOI] [PubMed] [Google Scholar]
- Barthel M, Pedan V, Hahn O, et al. XRF-analysis of fine and ultrafine particles emitted from laser printing devices. Environ Sci Technol. 2011;45:7819–25. doi: 10.1021/es201590q. [DOI] [PubMed] [Google Scholar]
- Bello D, Martin J, Santeufemio C, et al. Physicochemical and morphological characterisation of nanoparticles from photocopiers: implications for environmental health. Nanotoxicology. 2012;7:989–1003. doi: 10.3109/17435390.2012.689883. [DOI] [PubMed] [Google Scholar]
- Bengalli R, Mantecca P, Camatini M, Gualtieri M. Effect of nanoparticles and environmental particles on a cocultures model of the air–blood barrier. Biomed Res Int. 2013;2013:801214. doi: 10.1155/2013/801214. [DOI] [PMC free article] [PubMed] [Google Scholar]
- Brown S. Pollutant emission properties of photocopiers and laser printers. Indoor Air 99: proceedings of the 8th International Conference on Indoor Air Quality and Climate; August, 1999; Edinburgh, Scotland. 1999. pp. 813pp. 123–8. [Google Scholar]
- Byeon JH, Kim J-W. Particle emission from laser printers with different printing speeds. Atmos Environ. 2012;54:272–6. [Google Scholar]
- Castellano P, Canepari S, Ferrante R, L’Episcopo N. Multiparametric approach for an exemplary study of laser printer emissions. J Environ Monit. 2012;14:446–54. doi: 10.1039/c2em10696e. [DOI] [PubMed] [Google Scholar]
- Chang C, Demokritou P, Shafer M, Christiani D. Physicochemical and toxicological characteristics of welding fume derived particles generated from real time welding processes. Environ Sci Process Impacts. 2013;15:214–24. doi: 10.1039/c2em30505d. [DOI] [PubMed] [Google Scholar]
- Demokritou P, Gass S, Pyrgiotakis G, et al. An in vivo and in vitro toxicological characterization of realistic nanoscale CeO2 inhalation exposures. Nanotoxicology. 2012;7:1338–50. doi: 10.3109/17435390.2012.739665. [DOI] [PMC free article] [PubMed] [Google Scholar]
- Demokritou P, Kavouras IG, Ferguson ST, Koutrakis P. Development of a high volume cascade impactor for toxicological and chemical characterization studies. Aerosol Sci Technol. 2002;36:925–33. [Google Scholar]
- Demokritou P, Lee SJ, Ferguson ST, Koutrakis P. A compact multistage (cascade) impactor for the characterization of atmospheric’ aerosols. J Aerosol Sci. 2004;35:281–99. [Google Scholar]
- Dockery D, Arden C, Xu X, et al. An association between air pollution and mortality in six U.S. cities. N Engl J Med. 1993;329:1753–9. doi: 10.1056/NEJM199312093292401. [DOI] [PubMed] [Google Scholar]
- Dominici F, Peng R, Bell M, et al. Fine particulate air pollution and hospital admission for cardiovascular and respiratory diseases. JAMA. 2006;295:1127–34. doi: 10.1001/jama.295.10.1127. [DOI] [PMC free article] [PubMed] [Google Scholar]
- Dun & Bradstreet Reports. SIC 7334 photocopying and duplicating services – description, market prospects, industry history [Online] [Last accessed: Feb 2014];Reference for Business, Encyclopedia of Business. (2). 2011 Available from: http://www.referenceforbusiness.com/industries/Service/Photocopying-Duplicating-Services.html.
- EPA.GOV. Air and Radiation. US EPA; 2014. [Last accessed: 23 Jan 2014]. National Ambient Air Quality Standards (NAAQS) Available from: http://www.epa.gov/air/criteria.html. [Google Scholar]
- Fuller CH, Brugge D, Williams PL, et al. Indoor and outdoor measurements of particle number concentration in near-highway homes. J Exp Sci Environ Epidemiol. 2013;23:506–12. doi: 10.1038/jes.2012.116. [DOI] [PMC free article] [PubMed] [Google Scholar]
- Furukawa Y, Aizawa Y, Okada M, et al. Negative effect of photocopier toner on alveolar macrophages determined by in vitro magnetrometric evaluation. Indus Health. 2002;40:214–21. doi: 10.2486/indhealth.40.214. [DOI] [PubMed] [Google Scholar]
- Gminski R, Decker K, Heinz C, et al. Genotoxic effects of three selected black toner powders and their dimethyl sulfoxide extracts in cultured human epithelial A549 lung cells in vitro. Environ Mol Mutagen. 2011;52:296–309. doi: 10.1002/em.20621. [DOI] [PubMed] [Google Scholar]
- Harkema JR, Keeler G, Wagner J, et al. Effects of concentrated ambient particles on normal and hypersecretory airways in rats. Res Rep Health Effect Inst. 2004;120:1–68. [PubMed] [Google Scholar]
- He C, Morawska L, Taplin L. Particle emission characteristics of office printers. Environ Sci Technol. 2007;41:6039–45. doi: 10.1021/es063049z. [DOI] [PubMed] [Google Scholar]
- He C, Morawska L, Wang H, et al. Quantification of the relationship between fuser roller temperature and laser printer emissions. J Aerosol Sci. 2010;41:523–30. [Google Scholar]
- ISO.ORG. [Last accessed: 21 Jan 2014];ISO/IEC 19752:2004 – information technology – method for the determination of toner cartridge yield for monochromatic electrophotographic printers and multi-function devices that contain printer components. 2014 Available from: http://www.iso.org/iso/home/store/catalogue_tc/catalogue_detail.htm?csnumber=34911.
- Jamieson L. Ink and toner cartridge use among SMBs in the United States. Photizo Group; 2012. [Last accessed: 17 Mar 2013]. Available from: http://photizogroup.-com/wp-content/uploads/2012/09/8.31.12-U.S.-SMB-Ink-and-Toner-Cartridge-Use.pdf. [Google Scholar]
- Jiang H, Lu L. Measurement of the surface charge of ultrafine particles from laser printers and analysis of their electrostatic force. Atmos Environ. 2010;44:3347–51. [Google Scholar]
- Kagi N, Fujii S, Horiba Y, et al. Indoor air quality for chemical and ultrafine particle contaminants from printers. Build Environ. 2007;42:1949–54. [Google Scholar]
- Khatri M, Bello D, Gaines P, et al. Nanoparticles from photocopiers induce oxidative stress and upper respiratory tract inflammation in healthy volunteers. Nanotoxicology. 2012;7:1014–27. doi: 10.3109/17435390.2012.691998. [DOI] [PubMed] [Google Scholar]
- Khatri M, Bello D, Pal A, et al. Human cell line evaluation of cytotoxic, genotoxic and inflammatory responses caused by nanoparticles from photocopiers. Particle Fiber Toxicol. 2013a;10:42. doi: 10.1186/1743-8977-10-42. [DOI] [PMC free article] [PubMed] [Google Scholar]
- Khatri M, Bello D, Pal A, et al. Toxicological effects of PM0.1-2.5 particles collected from a photocopy center in three human cell lines. Inhal Toxicol. 2013b;25:621–32. doi: 10.3109/08958378.2013.824525. [DOI] [PubMed] [Google Scholar]
- Lee C-W, Hsu D-J. Measurements of fine and ultrafine particles formation in photocopy centers in Taiwan. Atmos Environ. 2007;41:6598–609. [Google Scholar]
- Lee SC, Lam S, Fai HK. Characterization of VOCs, ozone, and PM10 emissions from office equipment in an environmental chamber. Build Environ. 2001;36:837–42. [Google Scholar]
- Lough G, Schauer J, Park J, et al. Emissions of metals associated with motor vehicle roadways. Environ Sci Technol. 2005;39:826–36. doi: 10.1021/es048715f. [DOI] [PubMed] [Google Scholar]
- Mcgarry P, Morawska L, He C, et al. Exposure to particles from laser printers operating within office workplaces. Environ Sci Technol. 2011;45:6444–52. doi: 10.1021/es200249n. [DOI] [PubMed] [Google Scholar]
- Mckone T, Maddalena R, Destaillats H, et al. Indoor pollutant emissions from electronic office equipment. California: 2009. [Last accessed: Feb 2014]. unpublished work Available from: http://www.arb.ca.gov/research/seminars/mckone/mckone.pdf. [Google Scholar]
- Michael S, Montag M, Dott W. Pro-inflammatory effects and oxidative stress in lung macriophages and epithelial cells induced by ambient particular matter. Environ Pollut. 2013;183:19–29. doi: 10.1016/j.envpol.2013.01.026. [DOI] [PubMed] [Google Scholar]
- Mohr U, Ernst H, Roller M, Pott F. Carcinogenicity study with nineteen granular dusts in rats. Eur J Oncol. 2005;10:249–81. [Google Scholar]
- Mohr U, Ernst H, Roller M, Pott F. Pulmonary tumor types induced in Wistar rats of the so-called “19-dust study”. Exp Toxicol Pathol. 2006;58:13–20. doi: 10.1016/j.etp.2006.06.001. [DOI] [PubMed] [Google Scholar]
- Moller A, Muhle H, Creutzenberg O, et al. Biological procedures for the toxicological assessment of toner dusts. Gefahrst Reinhalt Luft. 2004;64:13–20. [Google Scholar]
- Morawska L, He C, Johnson G, et al. An investigation into the characteristics and formation mechanisms of particles originating from the operation of laser printers. Environ Sci Technol. 2009;43:1015–22. doi: 10.1021/es802193n. [DOI] [PubMed] [Google Scholar]
- Morimoto Y, Kim H, Oyabu T, et al. Negative effect of longterm inhalation of toner on formation of 8-hydroxydeoxyguanosine in DNA in the lungs of rats in vivo. Inhal Toxicol. 2005;17:749–53. doi: 10.1080/08958370500224771. [DOI] [PubMed] [Google Scholar]
- Murr LE, Soto KF, Garza KM, et al. Combustion-generated nanoparticles in the El Paso, TX, USA/Juarez, Mexico Metroplex: their comparative characterization and potential for adverse health effects. Int J Environ Res Public Health. 2006;1:48–66. doi: 10.3390/ijerph2006030007. [DOI] [PMC free article] [PubMed] [Google Scholar]
- Nel A, Xia T, Madler L, Li N. Toxic potential of materials at the nanolevel. Science. 2006;311:622–7. doi: 10.1126/science.1114397. [DOI] [PubMed] [Google Scholar]
- Padro-Martinez LT, Patton AP, Trull JB, et al. Mobile monitoring of particle number concentration and other traffic related air pollutants in a near-highway neighborhood over the course of a year. Atmos Environ (1994) 2012;61:253–64. doi: 10.1016/j.atmosenv.2012.06.088. [DOI] [PMC free article] [PubMed] [Google Scholar]
- Perrone MG, Gualtieri M, Consonni V, et al. Particle size, chemical composition, seasons of the year and urban, rural or remote site origins as determinants of biological effects of particulate matter on pulmonary cells. Environ Pollut. 2013;176C:215–27. doi: 10.1016/j.envpol.2013.01.012. [DOI] [PubMed] [Google Scholar]
- Pettersson T, Fogden A. Levelling during toner fusing: effects on surface roughness and gloss of printed-paper. J Imaging Sci Technol. 2006;50:202–15. [Google Scholar]
- Pirela S, Molina R, Watson C, et al. Effects of copy center particles on the lungs: a toxicological characterization using a Balb/c mouse model. Inhal Toxicol. 2013;9:498–508. doi: 10.3109/08958378.2013.806614. [DOI] [PMC free article] [PubMed] [Google Scholar]
- Pyrgiotakis G, Mcdevitt J, Bordini A, et al. A chemical free, nanotechnology-based method for airborne bacterial inactivation using engineered water nanostructures. Environ Sci Nano. 2014;1:15–26. doi: 10.1039/C3EN00007A. [DOI] [PMC free article] [PubMed] [Google Scholar]
- Reynolds JS, Johnson VJ, Frazer DG. Unrestrained acoustic plethysmograph for measuring specific airway resistance in mice. J Appl Physiol. 2008;105:711–17. doi: 10.1152/japplphysiol.00949.2007. [DOI] [PubMed] [Google Scholar]
- Schripp T, Wensing M, Uhde E, et al. Evaluation of ultrafine particle emissions from laser printers using emission test chambers. Environ Sci Technol. 2008;42:4338–43. doi: 10.1021/es702426m. [DOI] [PubMed] [Google Scholar]
- Slesinski RS, Turnbull D. Chronic inhalation exposure of rats for up to 104 weeks to a non-carbon-based magnetite photocopying toner. Int J Toxicol. 2008;27:427–39. doi: 10.1080/10915810802616560. [DOI] [PubMed] [Google Scholar]
- Sotiriou G, Watson C, Murdaugh KM, et al. Engineering saferby-design, transparent, silica-coated ZnO nanorods with reduced DNA damage potential. ES Nano. 2014;1:144–53. doi: 10.1039/C3EN00062A. [DOI] [PMC free article] [PubMed] [Google Scholar]
- Tanaka M, Aoki Y, Tajano H, et al. Effects of exposure to nanoparticle-rich or -depleted diesel exhaust on allergic pathophysiology in the murine lung. J Toxicol Sci. 2013;38:35–48. doi: 10.2131/jts.38.35. [DOI] [PubMed] [Google Scholar]
- Tang T, Hurrass J, Gminski R, Mersch-Sundermann V. Fine and ultrafine particles emitted from laser printers as indoor air contaminants in German offices. Environ Sci Pollut Res Int. 2012;19:3840–9. doi: 10.1007/s11356-011-0647-5. [DOI] [PubMed] [Google Scholar]
- Wang H, He C, Morawska L, et al. Ozone-initiated particle formation, particle aging, and precursors in a laser printer. Environ Sci Technol. 2012;46:704–12. doi: 10.1021/es203066k. [DOI] [PubMed] [Google Scholar]
- Wensing M, Pinz G, Bednarek M, et al. Particle measurement of hardcopy devices. Healthy Buildings Conference; Lisboa. 2006. [Google Scholar]
- Wensing M, Schripp T, Uhde E, Salthammer T. Ultra-fine particles release from hardcopy devices: sources, real-room measurements and efficiency of filter accessories. Sci Total Environ. 2008;407:418–27. doi: 10.1016/j.scitotenv.2008.08.018. [DOI] [PubMed] [Google Scholar]
- Zhao J, Gao Z, Tian Z, et al. The biological effects of individual-level PM2.5 exposure on systemic immunity and inflammatory response in traffic policemen. Occup Environ Med. 2013;70:426–31. doi: 10.1136/oemed-2012-100864. [DOI] [PubMed] [Google Scholar]
Associated Data
This section collects any data citations, data availability statements, or supplementary materials included in this article.