

Abstract
Diabetic nephropathy (DN) is one of the major complications of diabetes mellitus (DM), leads to chronic kidney disease (CKD), and, ultimately, is the main cause for end-stage kidney disease (ESKD). Beyond urinary albumin, no reliable biomarkers are available for accurate early diagnostics. Urinary extracellular vesicles (UEVs) have recently emerged as an interesting source of diagnostic and prognostic disease biomarkers. Here we used a protease and respective protease inhibitor array to profile urines of type 1 diabetes patients at different stages of kidney involvement. Urine samples were divided into groups based on the level of albuminuria and UEVs isolated by hydrostatic dialysis and screened for relative changes of 34 different proteases and 32 protease inhibitors, respectively. Interestingly, myeloblastin and its natural inhibitor elafin showed an increase in the normo- and microalbuminuric groups. Similarly, a characteristic pattern was observed in the array of protease inhibitors, with a marked increase of cystatin B, natural inhibitor of cathepsins L, H, and B as well as of neutrophil gelatinase-associated Lipocalin (NGAL) in the normoalbuminuric group. This study shows for the first time the distinctive alterations in comprehensive protease profiles of UEVs in diabetic nephropathy and uncovers intriguing mechanistic, prognostic, and diagnostic features of kidney damage in diabetes.
1. Introduction
Diabetes mellitus (DM) has emerged as one of the major global health problems and a heavy burden for all healthcare systems [1]. Current predictions estimate that by 2025 more than 480 million people globally will have an altered glucose tolerance and 380 million will have developed type 2 diabetes [2]. Among diabetic complications diabetic nephropathy (DN) has already become the leading cause of end-stage kidney disease (ESKD) worldwide [3, 4]. Moreover, progressive decline of kidney function is associated with an increase in all-cause mortality and severe cardiovascular complications in patients with diabetes [5–7]. Despite important advances in understanding, for example, the molecular pathways associated with the pathogenesis of DN [8, 9], the clinical management of patients, and pharmacological treatments to protect the kidney function are not completely satisfactory [10, 11].
The diagnosis of DN is based on clinical parameters including the measurement of urinary albumin excretion rate (AER), assessment of glomerular filtration rate (GFR) [12], and registering end-organ complications (retinopathy or neuropathy). Leakage of albumin into urine (albuminuria) has been the golden marker to indirectly indicate the integrity of the glomerular filtration barrier and as an index of kidney functionality. Depending on severity of damage, the level of albumin found in urine increases in a linear fashion. Patients are commonly stratified as normoalbuminuric (<20 μg per minute or <30 mg/24 hours), microalbuminuric (20–200 μg per minute or 30–300 mg/24 hours), or macroalbuminuric (>200 μg per minute or >300 mg/24 hours) [13, 14]. In the diabetic patient, the onset of microalbuminuria proceeding to macroalbuminuria typically appears between 5 to 15 years and 15 to 25 years from the onset of diabetes [15, 16]. However, in patients with type 1 diabetes the decline of GFR is not always in concordance with the level of albuminuria and GFR reduces without clear signs of albuminuria and conversely reversion from microalbuminuria to normoalbuminuria can happen [17]. These evidences suggest that more than 1 pathway may well be involved in the development of DN and surrogate biomarkers in support of albuminuria are badly necessary to predict the progression of DN.
In the last decade urinary extracellular vesicles (UEVs) have gained considerable research interest due to their content of potential key molecules for intercellular communication and the possible use as source of biomarkers [18–20]. More in general cells secrete a surprising variety of vesicles such as exosomes, microvesicles, exosome-like vesicles, apoptotic blebs, and retrovirus-like particles (RLPs) into the extracellular space [21, 22] apparently reflecting intracellular processes. Thus, they provide a lucrative approach to better define the molecular events associated with metabolic disturbances as in diabetes. Moreover, UEVs have already shown to provide a promising source of biomarkers and their full potential has still to be utilised [23–25]. In this study we reveal, for the first time, a comprehensive analysis of proteases and proteases inhibitors in UEVs isolated from healthy subjects and DN in type 1 diabetes.
2. Methods
2.1. Urine Samples
Control urine samples were collected from twelve healthy volunteers among the laboratory staff, aged 20–40, in accordance with ethical protocols of the Dublin City University. First morning void urine was processed within 3 h without addition of protease inhibitors. Urine was anonymously tested by Combur 10 Test D dipstick (Roche Diagnostics, Basel, Switzerland) for the following: specific gravity, leucocytes, nitrites, proteins, glucose, ketones, urobilinogen, bilirubin, blood, and haemoglobin.
All patients participated in the Finnish Diabetic Nephropathy (FinnDiane) study, a nationwide multicenter study with the aim of identifying genetic and clinical risk factors for diabetic nephropathy in type 1 diabetes. The study protocol is in accordance with the Declaration of Helsinki, and it has been approved by the local ethics committee in each participating study centre. Urinary albumin excretion rate (AER) was determined in 24 h urine collections by immunoturbidimetry (Pharmacia, Uppsala, Sweden). The renal status was defined based on AER in at least two of three collections. Patients were divided by AER categorically.
2.2. Vesicle Purification
UEVs were purified by a hydrostatic filtration dialysis (HFD) system recently developed in our group [26]. Briefly, control and DN urine samples were centrifuged at a relative centrifugal force (RCF) of 2,000 g calculated at maximum radius of 160 mm in a swing bucket rotor Benchtop Universal 320 centrifuge (Hettich Zentrifugen, Tuttlingen, Germany) for 30 min at room temperature (RT) (without using break).
The supernatant (SN) was poured in a funnel connected to dialysis membrane with a molecular weight cutoff (MWCO) of 1,000 kDa as shown in supplemental Figure 1(S) (see Supplementary Material available online at http://dx.doi.org/10.1155/2015/289734). The hydrostatic pressure of the analyte solution is strong enough to push the solvent through the mesh of dialysis membrane carrying all the analytes below the MWCO (HFDb). Thus, after the first step of concentration (~3 mL) the funnel is refilled with 200 mL of deionised filtrate (0.22 μm) water to rinse what is left in the concentrated urine until the volume of ~5 mL was reached again. This concentration process is called “hydrostatic filtration dialysis.” The retained solution above the 1,000 kDa cutoff (HFDa) was used for all the following experiments.
2.3. Protein Assay, Gel Electrophoresis, and Western Blot
Protein quantification was determined by Coomassie [27] microassay. Proteins were separated by SDS-PAGE employing freshly cast T 6–18%, C 2.6% gradient resolving gel (80 mm × 50 mm × 1.5 mm) [28]. Protein amounts (based on the Bradford assay) were first dried by vacuum concentration and then resuspended in a strong chaotropic solution made of the following: 7 M urea, 2 M thiourea, 5% (w/v) SDS, 40 mM Tris-HCl, pH 6.8, 0.5 mM ethylenediaminetetraacetic acid (EDTA), 20% (v/v) glycerol, and 50 mM dithiothreitol (DTT) in a ratio of 0.25 μg of protein per μL of solution [29]. Protein denaturation was obtained after an overnight (ON) incubation at RT. After electrophoresis the gels were either stained with colloidal Coomassie [30] or transferred to 0.45 μm nitrocellulose membrane (Whatman, Springfield, UK) [31]. For Western blotting, membranes were saturated with Odyssey blocking buffer (LI-COR Biosciences, Lincoln, MA) and incubated with specific antibody as follows: rabbit anti-tumour suppressor gene (TSG101) (Sigma Aldrich, Dorset, UK), rabbit anti-ubiquitin (Dako, Glostrup, Denmark), and mouse anti-proteinase 3 (R&D Biosystem, Minneapolis, MN). After 6 washes in PBS-Tween (0.1%, v/v) membranes were incubated with infrared dye-coupled secondary antibody with a fluorescent tag (an emission of either 680 nm or 700 nm) (LI-COR Biosciences) dilution 1 : 5000 2 h incubation RT. Determination of molecular weight of all bands of interest and quantification of the signal were performed by Odyssey Infrared Laser Scanner software (LI-COR Biosciences).
2.4. Proteases and Protease Inhibitor Profiles
Proteome profiler human protease array kit and proteome profiler human protease inhibitor array kit (R&D Systems) were used to detect 34 proteases and 32 inhibitors, respectively. HFDa pooled fractions were dried by vacuum concentration (miVac speed trap, GeneVac Ltd, Ipswich, UK) and resuspended in 50 μL of 0.3% (w/v) sodium dodecyl sulphate (SDS) for 2 hours. Samples were diluted to 1 mL with Array buffer 6 plus 0.5 mL of Array buffer 4 (both buffers from R&D Systems). Fifteen microliters of reconstituted detection antibody cocktail was added to the sample solution and incubated for 1 hour at RT in end-over-end agitation. Mix sample-antibody solutions were incubated overnight at 6°C with the membrane on a rocking platform shaker. After three 10-minute washes with 1x buffer, the membranes were incubated with infrared dye-coupled streptavidin with a fluorescent tag emitting at 800 nm (LI-COR Biosciences), 1 : 2000 dilution for 1 h at room temperature on the rocking platform shaker. After three × 10 min wash with 1x Wash Buffer the membrane slides were acquired by Odyssey Infrared Laser Scanner (LI-COR Biosciences) and relative quantification analysis was performed by Odyssey Infrared Laser Scanner software (LI-COR Biosciences).
2.5. Gelatin Zymography
Gelatin zymography was performed using gradient sodium dodecyl sulfate gel electrophoresis (SDS-PAGE, T = 6–18% C = 2.6%) copolymerized with 2 mg/mL pig skin gelatin type B (Sigma). UEVs (5 μg per group) were incubated overnight in nonreducing Laemmli buffer [28]. After electrophoresis, gels were washed twice for 30 minutes in 2.5% (v/v) Triton X-100 at 4°C and were incubated overnight in collagenase buffer (50 mM Tris–HCl, pH 7.8 with 5 mM CaCl2 at 37°C). Gels were stained with Coomassie BlueR 250 (Bio-Rad) in 40% (v/v) methanol and 10% (v/v) acetic acid for 1 hour and were destained in the same solution without dye. Gelatinase activities were visualized as distinct bands, indicating proteolysis of the substrate [32].
2.6. Spectrophotometric Assay for Protease Activities
The proteolytic activities of specific group of proteases in normo-, micro- and macroalbuminuric HFDa fractions were assayed using 0.1 mM glycyl-prolyl-p-nitroanilide (GP-pNA) and 0.25 mM N-benzoyl-proline-phenylalanine-arginine-p-nitroanilide (Be-PFR-pNA), N-methoxysuccinyl-alanine-alanine-proline-valine-p-nitroanilide (Me-AAPV-pNA), and succinyl-alanine-alanine-proline-phenylalanine p-nitroanilide (Suc-AAPFpNA) chromogenic substrate of chromogenic substrates to establish activity of DPP IV, Kallikreins, proteinase 3, and cathepsins, respectively [23, 33–35]. Assays were performed for 20 min under same conditions of 100 mM Tris-HCl buffer pH 7.8 with addition of 5 mM CaCl2 except for GP-pNA, for which 100 mM Tris-HCl buffer pH 8.6 was used. Incubations were performed at 37°C for 20 min in 96-well flat bottom microplates (Greiner Bio One Kremsmüster, Austria). Reactions were stopped by 30% (v/v) final concentration of acetic acid. Results were read using 410 nm wavelength in Biotek PowerWave XS device (BioTek Instruments Inc., Winooski, VT). The specific activity has been defined as μmole of 4-nitroaniline released per minute by one milligram of the protease under the assay conditions. Assays were performed for intact vesicles (without treatment) and after delipidation [36]. Briefly, an equivalent of 100 μg of proteins from each sample was resuspended in milliQ water in total volume of 375 μL. Next, 675 μL of delipidation solution made of 60% (v/v) diisopropyl ether (DIPE) and 40% (v/v) butanol were added. Samples were vortexed and centrifuged for 10 min at 5000 rpm at RT. Upper phase was removed; 1125 μL of DIPE was added to aqueous phase and mixed end-over-end for 5 min at RT. Samples were then centrifuged at 5000 rpm for 5 min in RT and the upper phase was discarded while tubes were placed under a fume hood to remove traces of an organic phase. Bradford assay was performed to establish protein concentration and samples were diluted to obtain an optimal concentration for colorimetric assay.
3. Results
In the pilot study 12 (6 males and 6 females) control volunteers provided 15 mL of midstream first morning urine. Thirty seven urine samples from diabetes patients, with different levels of albumin-proteinuria were studied. After enriching UEVs by hydrostatic filtration dialysis, samples were assayed in electrophoresis and Western blots for general protein patterns and detection of the respective vesicle markers including tumor suppressor gene 101 (TSG101) specific for exosome vesicles (Figure 1).
Figure 1.

SDS-PAGE protein pattern and TSG101 detection: Immunodetection of the exosome marker protein TSG101 from the same order in the silver staining gels. Four μg of protein (Bradford assay) was loaded per sample in each lane. Molecular weights are expressed in kilo Dalton.
3.1. UEVs Characterization
Silver stained gels showed a good overlapping pattern with a moderate interindividual variability, most likely due to variable amounts of Tamm-Horsfall Protein (THP). Interestingly, TSG101 assay also showed a progressive signal decrease in the micro- and macroalbuminuric groups, respectively. This trend was even more evident when urine pools were created for the protease and protease inhibitor arrays (Figure 2). Moreover, a detectable shift of the apparent TSG101 molecular weight (MW) was observed when pools were run in adjacent lanes in the same gel. This most likely reflects changes in posttranslational modifications of exosome components during disease course. These results were confirmed in two independent Western blots, the second of which was carried out with an optimised gradient gel to have a better separation in the TSG101 molecular weight (MW) region. In order to investigate this alteration in detail we assayed the ubiquitination state of exosomes. Although the precise molecular mechanism of the vesicle formation and protein recruitment needs to be fully elucidated, it seems apparent that this posttranslation modification (PTM) faithfully reflects the disease pathogenesis. Interestingly, ubiquitination is involved in a variety of cellular processes, including protein sorting and translocation inside the vesicle lumen during vesicle biogenesis as well as in protein degradation [37]. In support of this, Western blotting revealed a specific ubiquitination pattern in the DN groups. Anti-ubiquitin antibody used in this screening recognised free ubiquitin and monoubiquitinated protein. In all the DN groups it is possible to observe a strong signal at 8.5 kDa corresponding to the monomeric ubiquitin and 17 kDa (white rectangle) which is absent in the healthy control. Moreover a specific pattern in the normo-, micro-, and macroalbuminuric groups with an apparently relative changing for some bands (asterisk) is visible between 50 and 75 kDa.
Figure 2.

SDS-PAGE protein pattern, TSG101, and ubiquitin detection of pooled samples. Two μg of protein (Bradford assay) was loaded per sample in each lane. Molecular weights are expressed in kilo Dalton. H: healthy control, N: normoalbuminuric, Mi: microalbuminuric, and Ma: macroalbuminuric.
3.2. Proteases Array and Relative Quantification
Despite the fact that the challenges of using sample pools have been thoroughly debated, pools for each study group were created to overcome substantial limitation such as a relative protein recovery from a limited volume of urine. Moreover a superpool made of the same amount of protein for each HFDa sample was created to normalise the relative quantitative changing of the proteases array (Figure 3(a)) and overcome the lack of a housekeeping protein.
Figure 3.

Protease array. (a) Nitrocellulose membrane slides were acquired at the same time as fluorescent intensity. (b) Relative quantification of positive protease (signal-to-noise ratio ≥3) was normalised by a pool made of all the samples included in the analysis. P: pool, H: healthy control, N: normoalbuminuric, Mi: microalbuminuric, and Ma: macroalbuminuric.
Membrane slides were analyzed at the same time adjusting the intensity of the laser to reach the limit of saturation for the most abundant spot. The spots in positions A1,2, A19,20, and E1,2 represent the positive controls. The absence of spots in position E 7,8 (white rectangular), which is the negative control, indicates the specificity of the antibody cocktail.
Table 1 reports changes of ±1.5-fold of the proteases, with respect to the healthy control. The complete list is available in a spreadsheet as supplemental Table 1. A positive signal of 29 proteases was detected out of 34, out of which 16 showed a significant change during progression of DN. Figure 3(b) shows the plots as bar chart of the fluorescent intensity (F.I.) for each protease normalised by the F.I. of the superpool. Positive spots were considered as those with a detection limit (signal-to-noise ratio) ≥3.
Table 1.
Proteases array coordinate, features, and changing fold.
| Coordinates | Protein name | Uniprot number | Gene name | Vesiclepedia | Isoform specificity | Normo | Micro | Macro |
|---|---|---|---|---|---|---|---|---|
| A5, A6 | ADAM9 | Q13443 | ADAM9 | √ | Ectodomain | −2.16 | −2.62 | −2.92 |
| A11, A12 | Cathepsin A | P10619 | CTSA | √ | Proform and active | 1.46 | 5.93 | 4.34 |
| A15, A16 | Cathepsin C | P53634 | CTSC | √ | Proform and active | 2.47 | 2.98 | 2.50 |
| A17, A18 | Cathepsin D | P07339 | CTSD | √ | Proform and active | 4.00 | 6.62 | 6.88 |
| B3, B4 | Cathepsin E | P14091 | CTSE | √ * | Proform and active | −1.11 | −1.29 | −1.63 |
| B5, B6 | Cathepsin L | P07711 | CTSL1 | √ | Proform and active | −1.01 | 2.95 | 2.27 |
| B11, B12 | Cathepsin X/Z/P | Q9UBR2 | CTSZ | √ | Proform and active | 2.63 | 8.13 | 7.19 |
| B13, B14 | DPPIV/CD26 | P27487 | DPP4 | √ | Ectodomain | −1.84 | −1.41 | 1.00 |
| B15, B16 | Kallikrein 3/PSA | P07288 | KLK3 | √ | Proform and active | −2.13 | 1.91 | 1.68 |
| C3, C4 | Kallikrein 6 | Q92876 | KLK6 | √ | Proform and active | 1.63 | 1.34 | −1.35 |
| C7, C8 | Kallikrein 10 | O43240 | KLK10 | √ ‡ | Proform and active | 1.87 | 1.93 | 1.90 |
| C11, C12 | Kallikrein 13 | Q9UKR3 | KLK13 | X | Proform and active | 4.70 | 4.38 | 2.44 |
| C15, C16 | MMP-2 | P08253 | MMP2 | √ | Proform and active | −1.36 | −1.50 | −1.52 |
| D7, D8 | MMP-9 | P14780 | MMP9 | √ | Proform and active | 6.40 | 1.83 | −1.02 |
| D13, D14 | Neprilysin/CD10 | P08473 | MME | √ | Ectodomain | −1.89 | −1.30 | −1.37 |
| E3, E4 | Proteinase 3 | P24158 | PRTN3 | √ | Active | 4.15 | 5.20 | 1.96 |
*Reported in vesiclepedia database in mouse and rat species.
‡Reported in vesiclepedia database as mRNA.
A set of proteases appear to progressively increase in different groups of DN patients (especially for the cathepsin family with a progressive increase of A, C, D, L, and Z) while only cathepsin E seems to decrease following a trend which becomes significant (less than 1.5-fold) in the macroalbuminuric group.
In the family of Kallikreins, Kallikrein 3/PSA, Kallikrein 10, Kallikrein 13, and Kallikrein 6 could be biased by the gender distribution of samples in the groups. Metalloprotease MMP9 is abundantly present in the normoalbuminuric group while MMP2 showed a progressive decrease reaching the threshold of −1.5-fold in the micro- and macroalbuminuric groups. Other proteases which showed an interesting trend are DDP IV targets of gliptins and proteinase 3 (PRTN3) or myeloblastin. DDP IV decreased in the normoalbuminic group and then increased during progression of DN while proteinase 3 (PRTN3) has an opposite trend with a marked increase in the normoalbuminuric and microalbuminuric group to reach a normal level in the macroalbuminuric group.
3.3. Protease Activities
Beside the relative quantitative amount we checked the activity of some of these proteases by gelatine zymography for metalloproteases (Figure 4) which confirmed a clear increase of gelatinase activity in the normoalbuminuric group and by chromogenic substrates for DPP IV, Kallikreins, cathepsins, and PRTN3 (Figure 5). Spectrophotometric assays were performed in native condition and after organic delipidation to release proteases which can be localized in the vesicle lumen. After delipidation only the Kallikrein family was significantly affected (full loss of activity) while all the other protease activities maintained the same profile. Although there is a substantial increase of the cathepsin expression in the protease array, the colorimetric assay showed a decrease of the activity in the DN groups. Moreover, it is interesting to notice that the activity of DPP IV was much lower in the DN groups independently of the levels detected in the array. Proteinase 3 activity was high in the normoalbuminuric group but in the other groups it remained unchanged despite the higher levels especially in the microalbuminuric group. Since proteomic profiling of UEVs reported the presence of several protease inhibitors [18, 19], such discrepancy between activity and expression levels could be caused by the presence of protease inhibitors.
Figure 4.

Protease chromogenic activity. Protease activities were assessed by specific chromogenic substrates for DDPIV Gly-Pro-p-nitroanilide (GP-pNA), leukocyte proteinase 3, and elastase (N-methoxysuccinyl Ala-Ala-Pro-Val-p-nitroanilide M-MeAAPV-pNA). Two μg of protein (Bradford assay) was used per replica. The bar represents the standard deviation of the technical triplicate.
Figure 5.
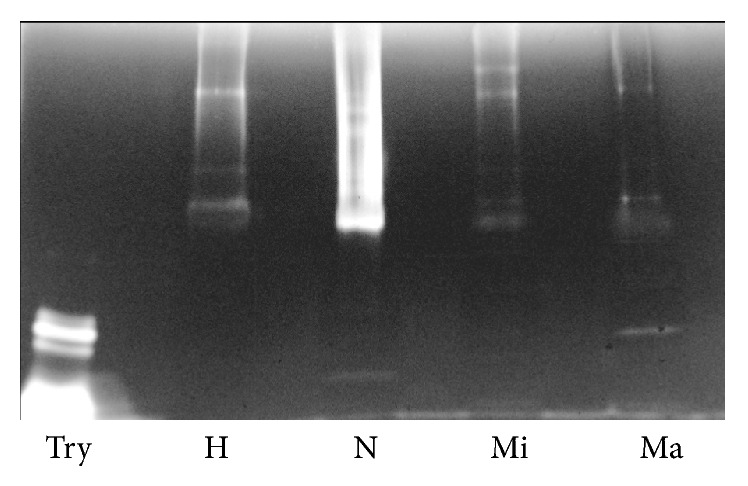
Zymography SDS-PAGE of vesicle-associated gelatinases. One μg of protein per each pool (Bradford assay) was loaded in each lane. Gel was incubated at 37°C for 16 hours. Try: Trypsin (50 ng), H: healthy, N: normoalbuminuric, Mi: microalbuminuric, and Ma: macroalbuminuric pools.
3.4. Protease Inhibitor Array and Relative Quantification
Based on the same assay, a protease inhibitor array to screen the expression of protease inhibitors was performed. Out of 32 inhibitors 19 were present in the same pool, and 15 showed more than 1.5-fold change (Table 2 and Figure 6). Also in this array we can identify different trends. Firstly, 6 inhibitors appeared to be more abundant (cystatin B, fetuin B, angiotensinogen, serpin A8, serpin F1, and elafin) progressively in the 3 diabetic groups. Those with decreased amounts showed either a progressive decrease which becomes significant in the micro- and/or macroalbuminuric groups (e.g., serpin B5 and TIMP-2) or very low amount in all the 3 DN groups (cystatin C E/M, EMMPRIN/CD147, HA-2, and HE4/WFDC2). Finally, two protease inhibitors (Lipocalin-2/NGAL and Protease Nexin II) showed a peculiar increase in the normoalbuminuric group and a sharp decrease in the macroalbuminuric cohort.
Table 2.
Protease inhibitor array, coordinates, features, and changing fold.
| Coordinates | Protein name | Uniprot number | Gene name | Vesiclepedia | Normo | Micro | Macro |
|---|---|---|---|---|---|---|---|
| A3, A4 | Protease Nexin II | P05067 | APP | √ | −1.75 | −1.37 | −1.90 |
| A5, A6 | Cystatin A | P01040 | CSTA | √ | −1.35 | −1.62 | −1.73 |
| A7, A8 | Cystatin B | P04080 | CSTB | √ | 3.74 | 2.39 | 2.91 |
| A11, A12 | Cystatin E/M | Q15828 | CST6 | √ | −2.75 | −1.71 | −2.36 |
| A13, A14 | EMMPRIN/CD147 | P35613 | BSG | √ | −2.05 | −2.27 | −3.08 |
| A15, A16 | Fetuin B | Q9UGM5 | FETUB | X | 1.11 | 1.44 | 1.68 |
| B3, B4 | HAI-2 | O43291 | SPINT2 | √ ‡ | −2.38 | −2.43 | −2.82 |
| B5, B6 | HE4/WFDC2 | Q14508 | WAP 5 | √ ‡ | −2.44 | −1.81 | −1.99 |
| B9, B10 | Lipocalin-1 | P31025 | LCN1 | √ | −1.62 | −1.30 | −1.47 |
| B11, B12 | Lipocalin-2/NGAL | P80188 | LCN2 | √ | 2.72 | −1.30 | −1.61 |
| B17, B18 | Serpin A8 | P01019 | AGT | √ | −1.19 | 1.79 | 1.50 |
| C7, C8 | Serpin B5 | P36952 | SERPINB5 | √ | −1.03 | 1.06 | 2.67 |
| C9, C10 | Serpin B6 | P35237 | SERPINB6 | √ | −1.43 | −1.57 | −1.81 |
| C15, C16 | Serpin F1 | P36955 | SERPINEF1 | √ | −1.23 | 1.69 | 2.36 |
| D5, D6 | TFPI | P10646 | TFPI | √ | −1.44 | −1.46 | −1.54 |
| D7, D8 | TFPI-2 | P48307 | TFPI2 | X | −1.31 | −1.44 | −1.61 |
| D9, D10 | TIMP-1 | P01033 | TIMP1 | √ | −1.31 | −1.14 | −1.57 |
| D11, D12 | TIMP-2 | P16035 | TIMP2 | √ | 1.29 | −1.47 | −1.86 |
| D17, D18 | Elafin | P19957 | PI3 | X | 4.62 | 2.84 | 1.15 |
‡Reported in vesiclepedia database as mRNA.
Figure 6.

Protease inhibitors array. (a) Nitrocellulose membrane slides were acquired at the same time as fluorescent intensity. (b) Relative quantification of positive protease (signal-to-noise ratio ≥3) normalised by a pool made of all the samples included in the analysis. P: pool, H: healthy control, N: normoalbuminuric, M: microalbuminuric, and Ma: macroalbuminuric.
In order to establish whether there is any functional interconnection between proteases and protease inhibitors we used the Kidney & Urinary Pathway knowledge Base (KUPKB) [38] designed to collect data set from scientific publications and other datasets related specifically to renal diseases. The query of the KUPKB algorithm provided the protein network presented in Figure 7. Out of 30 entries which are up- or downregulated by 1.5-fold in the protease and protease inhibitor arrays, 11 entities were found to be connected as a network together. Within the network we have found that cathepsin L via cystatin A is connected to the metalloproteases 9 and 2 whose dysregulation is potentially involved in the progression of DN [39]. Interestingly, PRNT-3 mRNA was reported to be upregulated in type 2 diabetic nephropathy [40]. Thus, a further screening in Western blot was carried out evaluating the full cohorts of samples as shown in Figure 8 qualitatively confirming the array data.
Figure 7.
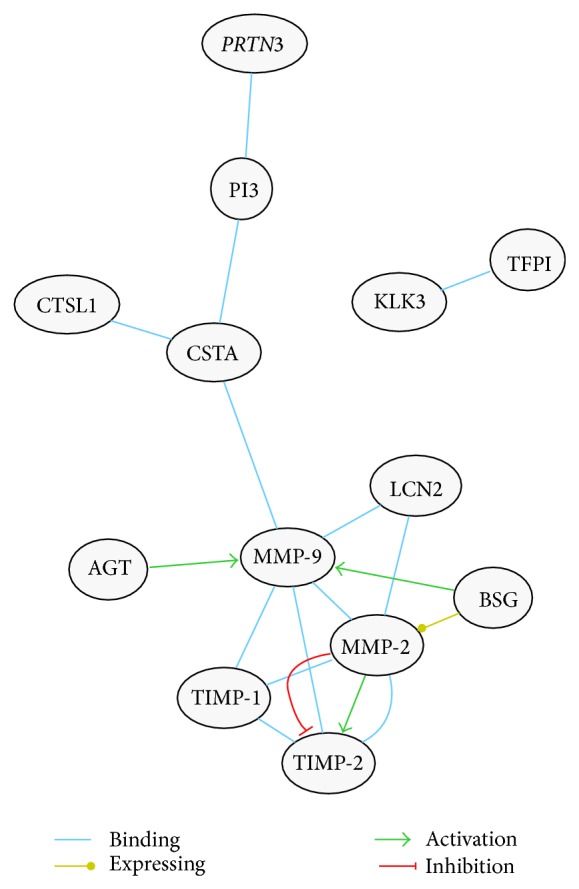
Urinary and kidney network map. A biological network of interaction using 30 proteases and proteases inhibitor entries extrapolated from the respective arrays was analysed by KUPKB [38]. Selected proteins were 1.5-fold up- or downregulated with respect to the healthy control. According to their intracellular pathways, several proteases can bind and degrade also endogenous inhibitors. This type of binding and interactions can add further complexity to the respective networks, and proteolytic signals themselves may end up in multiple directions. Accordingly, cathepsin L inactivates serpinA1 [75] and MMPs can inactivate a variety of serpins [76]. Conversely, some cystatins interact with MMP-9, still preserving the catalytic function after autodegradation [77]. Interestingly, angiotensinogen (AGT) decreases, through the action of AGT II, the transcription of MMP-1, MMP-2, TIMP-1, TIMP-2, and TIMP-3 but increases MMP-9 in human cardiomyocytes [78].
Figure 8.

Myeloblastin (PRNT3) immunodetection. Two μg of protein (Bradford assay) was loaded per sample in each lane. Nitrocellulose membranes were acquired at the same time as fluorescent intensity. (a) Healthy Control. (b) Normoalbuminuric. (c) Microalbuminuric. (d) Macroalbuminuric. (e) Average of the fluorescent intensity of each group. Molecular weights are expressed in kilo Dalton. H: healthy control, N: normoalbuminuric, Mi: microalbuminuric, and Ma: macroalbuminuric.
4. Discussion
Diabetic nephropathy (DN) is a major complication of diabetic patients, constituting the leading cause of ESKD and considerably increasing cardiovascular risk and associated mortality. Defining the pathophysiologic mechanisms in DN is necessary to better understand the disease and identify new targets for therapeutic intervention. Kidney lesions can start to develop early during the quiescent period when the patient is still normoalbuminuric and with normal glomerular filtration rate (GFR) [17].
Microalbuminuria has a solid role in the clinical practice and management of diabetic kidney disease (DKD). However, an increasing number of studies have shown that decrease of GFR can occur independently from the presence of albuminuria or progression to macroalbuminuria and therefore the utility of albuminuria itself has been questioned [41]. Thus, in addition to albumin excretion rate (AER) and GFR, selected biomarkers for the detection of early functional abnormalities have been proposed and recently reviewed by Macisaac et al. [42].
Recently urinary exosomes or, more in general, urinary extracellular vesicles (UEVs) have been actively studied for their biological role as a potentially new cell-to-cell communication system. Despite the partly overlapping and confusing nomenclature, EVs can be divided into various main categories with respect to their secretory pathway [21, 22]. Thus, exosome vesicles are formed by inward invagination of the endosomal membrane in an ubiquitin-dependent mechanism which requires the Endosomal Sorting Complex Required for Transport (ESCRT) machinery. Exosomes are then released in the extracellular space when multivesicular bodies (MVBs) of late endosomes fuse with the plasma membrane and release their intraluminal vesicle cargo [43]. Microvesicles are shed vesicles or membrane particles which derive directly from the outward budding of plasma membrane in response to a variety of pathophysiological stimuli [44, 45]. Furthermore, EVs can mediate intercellular communication by delivering elements of genetic content from one cell to another in a paracellular fashion [46]. Thus, UEVs faithfully reflect the antigenic characteristics of their parent cells thus making them excellent cell-type specific. This has led to an explosion of interest in EVs as potential source of biomarkers as mirror of the pathophysiology of the cell of origin [19, 47]. Thus, UEVs can provide a good platform as a surrogate of a “fluid biopsy” to support the clinical management of, for example, diabetic patients, assuming the DN kidney damage is reflected in the repertoire of UEVs with a specific fingerprint at each stage of disease progression.
The first aim of this study was to isolate and characterize UEVs from healthy donors and 3 cohorts of DN grouped according to the AER using a new isolation method developed in our group [26]. This is based on a hybrid ultrafiltration-dialysis system which enriches vesicles without the interference of soluble protein like human serum albumin (HSA). As shown in Figure 1 for all the samples under investigation, the main protein present in the UEVs is Tamm-Horsfall Protein (THP). THP is abundant in the healthy controls and it progressively decreases in the DN groups. No evidence of massive presence of human serum albumin (HSA) even in the macroalbuminuric group was seen. As expected, more prominent bands in the microalbuminuric and macroalbuminuric groups are visible at 62, 52, and 25 kDa and these correspond to the heavy and light chains of immunoglobulin (Ig) isotypes α, γ, κ, and/or λ chains.
Immunoglobulins have been identified in the proteome profiling of UEVs [18, 19] and elevated concentration of IgG and IgA in urine has been proposed as a novel mechanism of kidney damage independent from charge and size impairment in early DN [48, 49]. More dedicated studies are necessary to investigate the role of vesicles-Ig interaction in DN for their role.
Detection of the exosomal marker TSG101 confirmed the abundance of UEVs in the HFDa fractions. Interestingly, we noticed a progressive decrease of the signal during worsening of AER. Additionally, a shift of the molecular weight of TSG101 was observed (Figure 2). TSG101 can be acetylated [50] and/or ubiquitylated [51] and as component of the ESCRT-I machinery it binds ubiquitylated protein to sort it out into vesicles during its biogenesis to form the multivesicular body (MVB) which then either can release its vesicle cargo (exosomes) outside the cell and/or fuse with lysosome for degradation [52]. Thus, the ubiquitinated pattern of UEVs in the healthy and DN groups was checked by Western blot utilising a polyclonal antibody which recognised ubiquitin and monoubiquitinated proteins (Figure 3). Interestingly, the DN samples, at different stages of disease, provided a well defined and characteristic ubiquitome. This result along with decrease of TSG101 signal suggests that an impairment of the endosome/vesicle trafficking happens in the early stages of disease. Ubiquitin, more in general the ubiquitin-proteasome, plays a pivotal role in the degradation of misfolded proteins, concentration, and turnover of cellular proteins. Thus the ubiquitin-proteasome system works in synergy with lysosomal proteases, caspases, calpains, and separases to generate shorter polypeptides accessible to the proteasomes system for a full protein degradation [53]. Our results show convincingly that there are major intracellular changes reacting to altered microenvironment and this is reflected in the void UEVs.
Proteases cover an important role not only in the pathogenesis of DN [39] but more in general as the dynamic reaction obviously needed to keep the intracellular homeostasis, in our case to fight back the hyperglycaemia induced changes [54, 55]. In this study we wanted to focus our attention on proteases first and their well established inhibitors and how they are represented in the UEVs as indicators of intracellular events.
Sixteen and nineteen proteases and inhibitors, respectively, changed by ±1.5-fold with respect to the healthy group. Cathepsins of the A, C, D, L, and XZP classes were found as markedly more abundant in the DN groups. The only one less represented is cathepsin E, while cathepsins B, S, and V did not show any change. Cathepsins are lysosomal proteases, which can exert their proteolytic activity in the extracellular space in extracellular matrix (ECM) remodeling, and in synergy with MMP are implicated in the development of renal diseases (CRDs) [56, 57]. Beside the increased level of cathepsin L the protease inhibitors array showed a concomitant increase of cystatin B a thiol proteinase inhibitor which, reversibly, binds cathepsin L [58]. Interestingly, neutrophil gelatinase-associated Lipocalin (NGAL) binds and preserves metalloproteinase 9 (MMP-9) from degradation thus supporting its gelatinase activity [59]. Increase of urinary excretion of NGAL-MMP-9 has been described in diabetic subjects in a gender-specific manner [60]. In our study proteases, protease inhibitors arrays, and their functional verification with zymography showed that this association is also reflected inside the UEV fraction. Intriguingly, whether these findings show a “spillover” reflection of the cellular reaction to elevated glucose content or a mechanism to allow specific targeting to more downstream sites of protease needs should be studied in detail.
Increase of the urinary level of DPP IV associated with microvesicles is correlated with the worsening of DN [23]. In our array, we found that the level of DPP IV decreases in the normoalbuminuric group and then starts to progressively increase in the samples from patients with micro- and macroalbuminuria. Independently of the levels DPP IV, its functional activity is markedly lower in the 3 DN groups than in control.
Sun and colleagues [23] reported an increased excretion of DPP IV associated with microvesicles in type 2 diabetic patients. Their results are in contrast with the result of our screening but the methodological approach can explain such a difference. While in our study we collected the whole amount of UEVs retained in the dialysis tube, they enriched DPP IV using a specific monoclonal antibody anti-AD-1 (leucine aminopeptidase). The authors reported it to be expressed on the brush border of the proximal tubular in the cortex (S1, S2 segments) and in the outer medulla and in the medullary rays (S3 segments). However, DPP IV is widely expressed also in the glomeruli [61] and an increase of DPP IV activity in podocytes is correlated with kidney injury [62, 63]. Of course additional studies are necessary to better evaluate changes in the DPP IV levels in microvesicles.
In order to analyze the link between the proteases and their inhibitor we used the Kidney & Urinary Pathway knowledge Base (KUPKB) [38] to specifically focus on proteins/genes relative to pathways in the kidneys. Notably, a distinct protein network as shown in Figure 7 was observed. In addition to the MMPs and their relative inhibitors, two relatively new proteins emerged which are potentially involved in the complexity of DN pathogenesis: myeloblastin and its natural inhibitor Trappin-2. Myeloblastin or proteinase 3 (PRTN3) is a serine protease present in granules and the cell surface of neutrophils and monocytes. It can function in a membrane bound or soluble form. It has pleiotropic effects and multiple substrates including extracellular matrix and cytokines [64, 65] and it can be found in urine [66]. Recruitment of neutrophils in glomeruli and the release of PRTN3 potentially lead to endothelial dysfunction [67]. More recently podocytes have shown to actively regulate neutrophil recruitment through action of glomerular endothelial cells [68]. PRTN3 binds to the endothelial surface but it can be also internalised inducing apoptosis [69, 70]. Moreover, PRTN3 has been proposed as an inflammatory enzyme able to digest insulin-like growth factor 1 (IGF-1) and the insulin-like growth factor-binding protein-3 (IGFBP3) and promote glomerular inflammation in type 2 diabetes. Interestingly, endothelial dysfunction and inflammation have been recently proposed as predictors of DN in type 1 and 2 diabetes [71, 72]. Our results showed that also these mechanisms can be monitored by detecting a combination of selected proteases and their inhibitors. The protease array (Figure 3), verified with the functional chromogenic activity (Figure 5) and screening patients (Figure 8), confirmed an increase of the level and activity already in the normoalbuminuric group: in patients with changes induced by hyperglycemia but with no signs of permanent kidney damage yet. Indirectly we can generalize that hyperglycemia leads also to inflammation, contributes to the complexity of changes, and can be the ultimate functional component for apoptosis and autophagy [73]. This is supported by the dysregulated ubiquitination mirrored in the UEVs (Figure 2). This is interesting as very recently it has been reported that the ubiquitination-dependent of coactivator-associated arginine methyltransferase 1 (CARM1) can mediate podocyte apoptosis in DN [74]. A more comprehensive analysis of the distinct proteases and their association to their preferential pathophysiological processes is warranted.
In conclusion, UEVs have a strong potential as key elements for a fluid kidney biopsy by reflecting the respective pathophysiology, exact mechanisms involved, and often also information on the exact domain of the nephron affected. Consequently, they also carry a great potential to develop distinct inhibitors/activators. However, more detailed studies and, most preferably, correlating findings with those from tissue biopsies and clinical parameters are imperative. Here we show that the new hydrostatic filtration dialysis method offers an unbiased approach for vesicle enrichment from urine and their subsequent use for distinct purposes of protease inhibitor studies.
Supplementary Material
Supplemental Figure 1: Hydrostatic filtration dialysis system, assembling and function. Pictures show how to assemble the system with basic laboratory tools and the main phases of filtration to enrich urinary vesicles step by step.
Supplemental Table 1: Full list of proteases and protease inhibitors arrays. All proteases and inhibitors with a noise to signal ratio ≤ 3 are in red. Proteases and protease inhibitors with ± 1.5 fold changes with respect to the healthy control group are highlighted in yellow and green respectively.
Acknowledgments
This study was supported by the Irish Health Research Board HRB Grant no. HRA/09/62, European Union funded programs “Urosense” (IAAP-GA-2011-286386), and “KidneyConnect” (Grant no. 602422). FinnDianne was supported by grants from the Folkhälsan Research Foundation, the Wilhem and Else Stockmann Foundation, Liv och Hälsa Foundation, Helsinki University Central Hospital Research Funds (EVO), the Sigrid Juselius Foundation, the Signe and Ane Gyllenberg Foundation, Finska Läkaresällskapet, TEKES, Academy of Finland (134379), and the European Union's seventh Framework Program (FP7/2007-2013) for the Innovative Medicine Initiative under Grant Agreement no. IM/115006 (the SUMMIT consortium).
Conflict of Interests
The authors declare no conflict of interests.
References
- 1.Maruthur N. M. The growing prevalence of type 2 diabetes: increased incidence or improved survival? Current Diabetes Reports. 2013;13(6):786–794. doi: 10.1007/s11892-013-0426-4. [DOI] [PubMed] [Google Scholar]
- 2.van Dieren S., Beulens J. W. J., van der Schouw Y. T., Grobbee D. E., Neal B. The global burden of diabetes and its complications: an emerging pandemic. European Journal of Cardiovascular Prevention and Rehabilitation. 2010;17(1):s3–s8. doi: 10.1097/01.hjr.0000368191.86614.5a. [DOI] [PubMed] [Google Scholar]
- 3.Collins A. J., Foley R. N., Chavers B., et al. US Renal Data System 2013 Annual Data Report. American Journal of Kidney Diseases. 2014;63(S1):p. A7. doi: 10.1053/j.ajkd.2013.11.001. [DOI] [PubMed] [Google Scholar]
- 4.Atkins R. C., Zimmet P. World Kidney Day 2010: diabetic kidney disease—act now or pay later. The American Journal of Kidney Diseases. 2010;55(2):205–208. doi: 10.1053/j.ajkd.2009.12.001. [DOI] [PubMed] [Google Scholar]
- 5.Selvarajah S., Uiterwaal C. S. P. M., Haniff J., et al. Renal impairment and all-cause mortality in cardiovascular disease: effect modification by type 2 diabetes mellitus. European Journal of Clinical Investigation. 2013;43(2):198–207. doi: 10.1111/eci.12035. [DOI] [PubMed] [Google Scholar]
- 6.Targher G., Zoppini G., Chonchol M., et al. Glomerular filtration rate, albuminuria and risk of cardiovascular and all-cause mortality in type 2 diabetic individuals. Nutrition, Metabolism and Cardiovascular Diseases. 2011;21(4):294–301. doi: 10.1016/j.numecd.2009.10.002. [DOI] [PubMed] [Google Scholar]
- 7.Groop P.-H., Thomas M. C., Moran J. L., et al. The presence and severity of chronic kidney disease predicts all-cause mortality in type 1 diabetes. Diabetes. 2009;58(7):1651–1658. doi: 10.2337/db08-1543. [DOI] [PMC free article] [PubMed] [Google Scholar]
- 8.Kanwar Y. S., Sun L., Xie P., Liu F.-Y., Chen S. A glimpse of various pathogenetic mechanisms of diabetic nephropathy. Annual Review of Pathology: Mechanisms of Disease. 2011;6(1):395–423. doi: 10.1146/annurev.pathol.4.110807.092150. [DOI] [PMC free article] [PubMed] [Google Scholar]
- 9.Arora M. K., Singh U. K. Molecular mechanisms in the pathogenesis of diabetic nephropathy: an update. Vascular Pharmacology. 2013;58(4):259–271. doi: 10.1016/j.vph.2013.01.001. [DOI] [PubMed] [Google Scholar]
- 10.Fineberg D., Jandeleit-Dahm K. A. M., Cooper M. E. Diabetic nephropathy: diagnosis and treatment. Nature Reviews Endocrinology. 2013;9(12):713–723. doi: 10.1038/nrendo.2013.184. [DOI] [PubMed] [Google Scholar]
- 11.Krolewski A. S., Bonventre J. V. High risk of ESRD in type 1 diabetes: new strategies are needed to retard progressive renal function decline. Seminars in Nephrology. 2012;32(5):407–414. doi: 10.1016/j.semnephrol.2012.07.002. [DOI] [PMC free article] [PubMed] [Google Scholar]
- 12.Jerums G., Panagiotopoulos S., Premaratne E., MacIsaac R. J. Integrating albuminuria and GFR in the assessment of diabetic nephropathy. Nature Reviews Nephrology. 2009;5(7):397–406. doi: 10.1038/nrneph.2009.91. [DOI] [PubMed] [Google Scholar]
- 13.American Diabetes Association. Standards of medical care in diabetes. Diabetes Care. 2009;32(supplement 1):S13–S61. doi: 10.2337/dc09-s013. [DOI] [PMC free article] [PubMed] [Google Scholar]
- 14.KDOQI. Guideline 1: screening and diagnosis of diabetic kidney disease. The American Journal of Kidney Diseases. 2009;49(supplement 2):S42–S61. [Google Scholar]
- 15.Adler A. I., Stevens R. J., Manley S. E., Bilous R. W., Cull C. A., Holman R. R. Development and progression of nephropathy in type 2 diabetes: the United Kingdom Prospective Diabetes Study (UKPDS 64) Kidney International. 2003;63(1):225–232. doi: 10.1046/j.1523-1755.2003.00712.x. [DOI] [PubMed] [Google Scholar]
- 16.Remuzzi G., Benigni A., Remuzzi A. Mechanisms of progression and regression of renal lesions of chronic nephropathies and diabetes. Journal of Clinical Investigation. 2006;116(2):288–296. doi: 10.1172/JCI27699. [DOI] [PMC free article] [PubMed] [Google Scholar]
- 17.Perkins B. A., Ficociello L. H., Roshan B., Warram J. H., Krolewski A. S. In patients with type 1 diabetes and new-onset microalbuminuria the development of advanced chronic kidney disease may not require progression to proteinuria. Kidney International. 2010;77(1):57–64. doi: 10.1038/ki.2009.399. [DOI] [PMC free article] [PubMed] [Google Scholar]
- 18.Pisitkun T., Shen R.-F., Knepper M. A. Identification and proteomic profiling of exosomes in human urine. Proceedings of the National Academy of Sciences of the United States of America. 2004;101(36):13368–13373. doi: 10.1073/pnas.0403453101. [DOI] [PMC free article] [PubMed] [Google Scholar]
- 19.Gonzales P. A., Pisitkun T., Hoffert J. D., et al. Large-scale proteomics and phosphoproteomics of urinary exosomes. Journal of the American Society of Nephrology. 2009;20(2):363–379. doi: 10.1681/asn.2008040406. [DOI] [PMC free article] [PubMed] [Google Scholar]
- 20.Miranda K. C., Bond D. T., McKee M., et al. Nucleic acids within urinary exosomes/microvesicles are potential biomarkers for renal disease. Kidney International. 2010;78(2):191–199. doi: 10.1038/ki.2010.106. [DOI] [PMC free article] [PubMed] [Google Scholar]
- 21.Raposo G., Stoorvogel W. Extracellular vesicles: exosomes, microvesicles, and friends. The Journal of Cell Biology. 2013;200(4):373–383. doi: 10.1083/jcb.201211138. [DOI] [PMC free article] [PubMed] [Google Scholar]
- 22.Akers J. C., Gonda D., Kim R., Carter B. S., Chen C. C. Biogenesis of extracellular vesicles (EV): exosomes, microvesicles, retrovirus-like vesicles, and apoptotic bodies. Journal of Neuro-Oncology. 2013;113(1):1–11. doi: 10.1007/s11060-013-1084-8. [DOI] [PMC free article] [PubMed] [Google Scholar]
- 23.Sun A. L., Deng J. T., Guan G. J., et al. Dipeptidyl peptidase-IV is a potential molecular biomarker in diabetic kidney disease. Diabetes and Vascular Disease Research. 2012;9(4):301–308. doi: 10.1177/1479164111434318. [DOI] [PubMed] [Google Scholar]
- 24.Zubiri I., Posada-Ayala M., Sanz-Maroto A., et al. Diabetic nephropathy induces changes in the proteome of human urinary exosomes as revealed by label-free comparative analysis. Journal of Proteomics. 2014;96:92–102. doi: 10.1016/j.jprot.2013.10.037. [DOI] [PubMed] [Google Scholar]
- 25.Barutta F., Tricarico M., Corbelli A., et al. Urinary exosomal MicroRNAs in incipient diabetic nephropathy. PLoS ONE. 2013;8(11) doi: 10.1371/journal.pone.0073798.e73798 [DOI] [PMC free article] [PubMed] [Google Scholar]
- 26.Musante L., Tataruch D., Gu D., et al. A simplified method to recover urinary vesicles for clinical applications. Scientific Reports. 2014;4(article 7532) doi: 10.1038/srep07532. [DOI] [PMC free article] [PubMed] [Google Scholar]
- 27.Bradford M. M. A rapid and sensitive method for the quantitation of microgram quantities of protein utilizing the principle of protein dye binding. Analytical Biochemistry. 1976;72(1-2):248–254. doi: 10.1016/0003-2697(76)90527-3. [DOI] [PubMed] [Google Scholar]
- 28.Laemmli U. K. Cleavage of structural proteins during the assembly of the head of bacteriophage T4. Nature. 1970;227(15):680–685. doi: 10.1038/227680a0. [DOI] [PubMed] [Google Scholar]
- 29.Rabilloud T. Detergents and chaotropes for protein solubilization before two-dimensional electrophoresis. Methods in Molecular Biology. 2009;528(4):259–267. doi: 10.1007/978-1-60327-310-7_18. [DOI] [PubMed] [Google Scholar]
- 30.Candiano G., Bruschi M., Musante L., et al. Blue silver: a very sensitive colloidal Coomassie G-250 staining for proteome analysis. Electrophoresis. 2004;25(9):1327–1333. doi: 10.1002/elps.200305844. [DOI] [PubMed] [Google Scholar]
- 31.Towbin H., Staehelin T., Gordon J. Electrophoretic transfer of proteins from polyacrylamide gels to nitrocellulose sheets: procedure and some applications. Proceedings of the National Academy of Sciences of the United States of America. 1979;76(9):4350–4354. doi: 10.1073/pnas.76.9.4350. [DOI] [PMC free article] [PubMed] [Google Scholar]
- 32.Kleiner D. E., Stetler-Stevenson W. G. Quantitative zymography: detection of picogram quantities of gelatinases. Analytical Biochemistry. 1994;218(2):325–329. doi: 10.1006/abio.1994.1186. [DOI] [PubMed] [Google Scholar]
- 33.Fullaondo A., García-Sánchez S., Sanz-Parra A., Recio E., Lee S. Y., Gubb D. Spn1 regulates the GNBP3-dependent toll signaling pathway in Drosophila melanogaster . Molecular and Cellular Biology. 2011;31(14):2960–2972. doi: 10.1128/mcb.01397-10. [DOI] [PMC free article] [PubMed] [Google Scholar]
- 34.Wiesner O., Litwiller R. D., Hummel A. M., et al. Differences between human proteinase 3 and neutrophil elastase and their murine homologues are relevant for murine model experiments. FEBS Letters. 2005;579(24):5305–5312. doi: 10.1016/j.febslet.2005.08.056. [DOI] [PubMed] [Google Scholar]
- 35.Hogg P. J., Owensby D. A., Chesterman C. N. Thrombospondin 1 is a tight-binding competitive inhibitor of neutrophil cathepsin G. Determination of the kinetic mechanism of inhibition and localization of cathepsin G binding to the thrombospondin 1 type 3 repeats. The Journal of Biological Chemistry. 1993;268(29):21811–21818. [PubMed] [Google Scholar]
- 36.Cham B. E., Knowles B. R. A solvent system for delipidation of plasma or serum without protein precipitation. The Journal of Lipid Research. 1976;17(2):176–181. [PubMed] [Google Scholar]
- 37.Varshavsky A. The ubiquitin system, an immense realm. Annual Review of Biochemistry. 2012;81(9):167–176. doi: 10.1146/annurev-biochem-051910-094049. [DOI] [PubMed] [Google Scholar]
- 38.Klein J., Jupp S., Moulos P., et al. The KUPKB: a novel Web application to access multiomics data on kidney disease. The FASEB Journal. 2012;26(5):2145–2153. doi: 10.1096/fj.11-194381. [DOI] [PubMed] [Google Scholar]
- 39.Thrailkill K. M., Clay Bunn R., Fowlkes J. L. Matrix metalloproteinases: their potential role in the pathogenesis of diabetic nephropathy. Endocrine. 2009;35(1):1–10. doi: 10.1007/s12020-008-9114-6. [DOI] [PMC free article] [PubMed] [Google Scholar]
- 40.Baelde H. J., Eikmans M., Doran P. P., Lappin D. W. P., De Heer E., Bruijn J. A. Gene expression profiling in glomeruli from human kidneys with diabetic nephropathy, The American Journal of Kidney Diseases. 2004;43(4):636–650. doi: 10.1053/j.ajkd.2003.12.028. [DOI] [PubMed] [Google Scholar]
- 41.MacIsaac R. J., Ekinci E. I., Jerums G. ‘Progressive diabetic nephropathy. How useful is microalbuminuria?: contra’. Kidney International. 2014;86(1):50–57. doi: 10.1038/ki.2014.98. [DOI] [PubMed] [Google Scholar]
- 42.Macisaac R. J., Ekinci E. I., Jerums G. Markers of and risk factors for the development and progression of diabetic kidney disease. American Journal of Kidney Diseases. 2014;63(2):S39–S62. doi: 10.1053/j.ajkd.2013.10.048. [DOI] [PubMed] [Google Scholar]
- 43.Wollert T., Hurley J. H. Molecular mechanism of multivesicular body biogenesis by ESCRT complexes. Nature. 2010;464(7290):864–869. doi: 10.1038/nature08849. [DOI] [PMC free article] [PubMed] [Google Scholar]
- 44.Cocucci E., Racchetti G., Meldolesi J. Shedding microvesicles: artefacts no more. Trends in Cell Biology. 2009;19(2):43–51. doi: 10.1016/j.tcb.2008.11.003. [DOI] [PubMed] [Google Scholar]
- 45.Greenwalt T. J. The how and why of exocytic vesicles. Transfusion. 2006;46(1):143–152. doi: 10.1111/j.1537-2995.2006.00692.x. [DOI] [PubMed] [Google Scholar]
- 46.Valadi H., Ekström K., Bossios A., Sjöstrand M., Lee J. J., Lötvall J. O. Exosome-mediated transfer of mRNAs and microRNAs is a novel mechanism of genetic exchange between cells. Nature Cell Biology. 2007;9(6):654–659. doi: 10.1038/ncb1596. [DOI] [PubMed] [Google Scholar]
- 47.Dear J. W., Street J. M., Bailey M. A. Urinary exosomes: a reservoir for biomarker discovery and potential mediators of intrarenal signalling. Proteomics. 2013;13(10-11):1572–1580. doi: 10.1002/pmic.201200285. [DOI] [PubMed] [Google Scholar]
- 48.Gohda T., Walker W. H., Wolkow P., et al. Elevated urinary excretion of immunoglobulins in nonproteinuric patients with type 1 diabetes. The American Journal of Physiology—Renal Physiology. 2012;303(1):F157–F162. doi: 10.1152/ajprenal.00443.2011. [DOI] [PMC free article] [PubMed] [Google Scholar]
- 49.Bakoush O., Tencer J., Tapia J., Rippe B., Torffvit O. Higher urinary IgM excretion in type 2 diabetic nephropathy compared to type 1 diabetic nephropathy. Kidney International. 2002;61(1):203–208. doi: 10.1046/j.1523-1755.2002.00108.x. [DOI] [PubMed] [Google Scholar]
- 50.van Damme P., Lasa M., Polevoda B., et al. N-terminal acetylome analyses and functional insights of the N-terminal acetyltransferase NatB. Proceedings of the National Academy of Sciences of the United States of America. 2012;109(31):12449–12454. doi: 10.1073/pnas.1210303109. [DOI] [PMC free article] [PubMed] [Google Scholar]
- 51.Amit I., Yakir L., Katz M., et al. Tal, a Tsg101-specific E3 ubiquitin ligase, regulates receptor endocytosis and retrovirus budding. Genes and Development. 2004;18(14):1737–1752. doi: 10.1101/gad.294904. [DOI] [PMC free article] [PubMed] [Google Scholar]
- 52.Hurley J. H., Boura E., Carlson L.-A., Róycki B. Membrane budding. Cell. 2010;143(6):875–887. doi: 10.1016/j.cell.2010.11.030. [DOI] [PMC free article] [PubMed] [Google Scholar]
- 53.Korolchuk V. I., Menzies F. M., Rubinsztein D. C. Mechanisms of cross-talk between the ubiquitin-proteasome and autophagy-lysosome systems. FEBS Letters. 2010;584(7):1393–1398. doi: 10.1016/j.febslet.2009.12.047. [DOI] [PubMed] [Google Scholar]
- 54.Panchapakesan U., Mather A., Pollock C. Role of GLP-1 and DPP-4 in diabetic nephropathy and cardiovascular disease. Clinical Science. 2013;124(1):17–26. doi: 10.1042/CS20120167. [DOI] [PubMed] [Google Scholar]
- 55.Mende C. W. Application of direct renin inhibition to chronic kidney disease. Cardiovascular Drugs and Therapy. 2010;24(2):139–149. doi: 10.1007/s10557-010-6232-1. [DOI] [PMC free article] [PubMed] [Google Scholar]
- 56.Wyczalkowska-Tomasik A., Bartlomiejczyk I., Gornicka B., Paczek L. Strong association between fibronectin accumulation and lowered cathepsin B activity in glomeruli of diabetic rats. Journal of Physiology and Pharmacology. 2012;63(5):525–530. [PubMed] [Google Scholar]
- 57.Song R. H., Singh A. K., Leehey D. J. Decreased glomerular proteinase activity in the streptozotocin diabetic rat. American Journal of Nephrology. 1999;19(3):441–446. doi: 10.1159/000013492. [DOI] [PubMed] [Google Scholar]
- 58.Turk V., Bode W. The cystatins: protein inhibitors of cysteine proteinases. FEBS Letters. 1991;285(2):213–219. doi: 10.1016/0014-5793(91)80804-c. [DOI] [PubMed] [Google Scholar]
- 59.Malla N., Sjøli S., Winberg J.-O., Hadler-Olsen E., Uhlin-Hansen L. Biological and pathobiological functions of gelatinase dimers and complexes. Connective Tissue Research. 2008;49(3-4):180–184. doi: 10.1080/03008200802151755. [DOI] [PubMed] [Google Scholar]
- 60.Lacquaniti A., Donato V., Pintaudi B., et al. ‘Normoalbuminuric’ diabetic nephropathy: tubular damage and NGAL. Acta Diabetologica. 2013;50(6):935–942. doi: 10.1007/s00592-013-0485-7. [DOI] [PubMed] [Google Scholar]
- 61.Pala L., Mannucci E., Pezzatini A., et al. Dipeptidyl peptidase-IV expression and activity in human glomerular endothelial cells. Biochemical and Biophysical Research Communications. 2003;310(1):28–31. doi: 10.1016/j.bbrc.2003.08.111. [DOI] [PubMed] [Google Scholar]
- 62.Stiller D., Bahn H., August C. Demonstration of glomerular DPP IV activity in kidney diseases. Acta Histochemica. 1991;91(1):105–109. doi: 10.1016/S0065-1281(11)80302-8. [DOI] [PubMed] [Google Scholar]
- 63.Elleder M., Stejskal J. Induction of dipeptidylpeptidase IV activity in human renal glomeruli—a histochemical study. Acta Histochemica. 1985;77(1):75–78. doi: 10.1016/s0065-1281(85)80019-2. [DOI] [PubMed] [Google Scholar]
- 64.Ballieux B. E. P. B., Hiemstra P. S., Klar-Mohamad N., et al. Detachment and cytolysis of human endothelial cells by proteinase 3. European Journal of Immunology. 1994;24(12):3211–3215. doi: 10.1002/eji.1830241245. [DOI] [PubMed] [Google Scholar]
- 65.Novick D., Rubinstein M., Azam T., Rabinkov A., Dinarello C. A., Kim S.-H. Proteinase 3 is an IL-32 binding protein. Proceedings of the National Academy of Sciences of the United States of America. 2006;103(9):3316–3321. doi: 10.1073/pnas.0511206103. [DOI] [PMC free article] [PubMed] [Google Scholar]
- 66.Navarrete M., Ho J., Krokhin O., et al. Proteomic characterization of serine hydrolase activity and composition in normal urine. Clinical Proteomics. 2013;10, article 17 doi: 10.1186/1559-0275-10-17. [DOI] [PMC free article] [PubMed] [Google Scholar]
- 67.Kuravi S. J., Bevins A., Satchell S. C., et al. Neutrophil serine proteases mediate inflammatory cell recruitment by glomerular endothelium and progression towards dysfunction. Nephrology Dialysis Transplantation. 2012;27(12):4331–4338. doi: 10.1093/ndt/gfs180. [DOI] [PubMed] [Google Scholar]
- 68.Kuravi S. J., McGettrick H. M., Satchell S. C., et al. Podocytes regulate neutrophil recruitment by glomerular endothelial cells via IL-6-mediated crosstalk. The Journal of Immunology. 2014;193(1):234–243. doi: 10.4049/jimmunol.1300229. [DOI] [PMC free article] [PubMed] [Google Scholar]
- 69.Yang J. J., Kettritz R., Falk R. J., Jennette J. C., Gaido M. L. Apoptosis of endothelial cells induced by the neutrophil serine proteases proteinase 3 and elastase. The American Journal of Pathology. 1996;149(5):1617–1626. [PMC free article] [PubMed] [Google Scholar]
- 70.Yang J. J., Preston G. A., Pendergraft W. F., et al. Internalization of proteinase 3 is concomitant with endothelial cell apoptosis and internalization of myeloperoxidase with generation of intracellular oxidants. The American Journal of Pathology. 2001;158(2):581–592. doi: 10.1016/s0002-9440(10)64000-x. [DOI] [PMC free article] [PubMed] [Google Scholar]
- 71.Bae S., Choi J., Hong J., et al. Neutrophil proteinase 3 induces diabetes in a mouse model of glucose tolerance. Endocrine Research. 2012;37(1):35–45. doi: 10.3109/07435800.2011.620579. [DOI] [PubMed] [Google Scholar]
- 72.Roy M. S., Janal M. N., Crosby J., Donnelly R. Markers of endothelial dysfunction and inflammation predict progression of diabetic nephropathy in African Americans with type 1 diabetes. Kidney International. 2014;87:427–433. doi: 10.1038/ki.2014.212. [DOI] [PMC free article] [PubMed] [Google Scholar]
- 73.Ouyang C., You J., Xie Z. The interplay between autophagy and apoptosis in the diabetic heart. Journal of Molecular and Cellular Cardiology. 2014;71:71–80. doi: 10.1016/j.yjmcc.2013.10.014. [DOI] [PubMed] [Google Scholar]
- 74.Kim D., Lim S., Park M., et al. Ubiquitination-dependent CARM1 degradation facilitates Notch1-mediated podocyte apoptosis in diabetic nephropathy. Cellular Signalling. 2014;26(9):1774–1782. doi: 10.1016/j.cellsig.2014.04.008. [DOI] [PubMed] [Google Scholar]
- 75.Johnson D. A., Barrett A. J., Mason R. W. Cathepsin L inactivates α1-proteinase inhibitor by cleavage in the reactive site region. Journal of Biological Chemistry. 1986;261(31):14748–14751. [PubMed] [Google Scholar]
- 76.Kessenbrock K., Plaks V., Werb Z. Matrix metalloproteinases: regulators of the tumor microenvironment. Cell. 2010;141(1):52–67. doi: 10.1016/j.cell.2010.03.015. [DOI] [PMC free article] [PubMed] [Google Scholar]
- 77.Ray S., Lukyanov P., Ochieng J. Members of the cystatin superfamily interact with MMP-9 and protect it from autolytic degradation without affecting its gelatinolytic activities. Biochimica et Biophysica Acta—Proteins and Proteomics. 2003;1652(2):91–102. doi: 10.1016/j.bbapap.2003.08.004. [DOI] [PubMed] [Google Scholar]
- 78.Pan C. H., Wen C. H., Lin C. S. Interplay of angiotensin II and angiotensin(1–7) in the regulation of matrix metalloproteinases of human cardiocytes. Experimental Physiology. 2008;93(5):599–612. doi: 10.1113/expphysiol.2007.041830. [DOI] [PubMed] [Google Scholar]
Associated Data
This section collects any data citations, data availability statements, or supplementary materials included in this article.
Supplementary Materials
Supplemental Figure 1: Hydrostatic filtration dialysis system, assembling and function. Pictures show how to assemble the system with basic laboratory tools and the main phases of filtration to enrich urinary vesicles step by step.
Supplemental Table 1: Full list of proteases and protease inhibitors arrays. All proteases and inhibitors with a noise to signal ratio ≤ 3 are in red. Proteases and protease inhibitors with ± 1.5 fold changes with respect to the healthy control group are highlighted in yellow and green respectively.